Demography - American Sociological Association
Demography - American Sociological Association
Demography - American Sociological Association

Create successful ePaper yourself
Turn your PDF publications into a flip-book with our unique Google optimized e-Paper software.
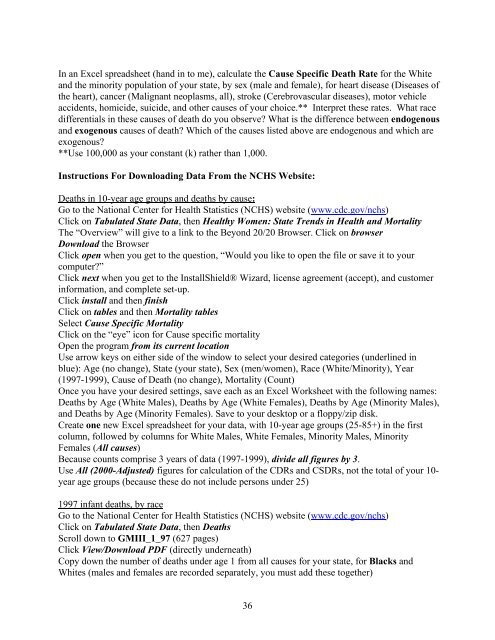
In an Excel spreadsheet (hand in to me), calculate the Cause Specific Death Rate for the White<br />
and the minority population of your state, by sex (male and female), for heart disease (Diseases of<br />
the heart), cancer (Malignant neoplasms, all), stroke (Cerebrovascular diseases), motor vehicle<br />
accidents, homicide, suicide, and other causes of your choice.** Interpret these rates. What race<br />
differentials in these causes of death do you observe? What is the difference between endogenous<br />
and exogenous causes of death? Which of the causes listed above are endogenous and which are<br />
exogenous?<br />
**Use 100,000 as your constant (k) rather than 1,000.<br />
Instructions For Downloading Data From the NCHS Website:<br />
Deaths in 10-year age groups and deaths by cause:<br />
Go to the National Center for Health Statistics (NCHS) website (www.cdc.gov/nchs)<br />
Click on Tabulated State Data, then Healthy Women: State Trends in Health and Mortality<br />
The “Overview” will give to a link to the Beyond 20/20 Browser. Click on browser<br />
Download the Browser<br />
Click open when you get to the question, “Would you like to open the file or save it to your<br />
computer?”<br />
Click next when you get to the InstallShield® Wizard, license agreement (accept), and customer<br />
information, and complete set-up.<br />
Click install and then finish<br />
Click on tables and then Mortality tables<br />
Select Cause Specific Mortality<br />
Click on the “eye” icon for Cause specific mortality<br />
Open the program from its current location<br />
Use arrow keys on either side of the window to select your desired categories (underlined in<br />
blue): Age (no change), State (your state), Sex (men/women), Race (White/Minority), Year<br />
(1997-1999), Cause of Death (no change), Mortality (Count)<br />
Once you have your desired settings, save each as an Excel Worksheet with the following names:<br />
Deaths by Age (White Males), Deaths by Age (White Females), Deaths by Age (Minority Males),<br />
and Deaths by Age (Minority Females). Save to your desktop or a floppy/zip disk.<br />
Create one new Excel spreadsheet for your data, with 10-year age groups (25-85+) in the first<br />
column, followed by columns for White Males, White Females, Minority Males, Minority<br />
Females (All causes)<br />
Because counts comprise 3 years of data (1997-1999), divide all figures by 3.<br />
Use All (2000-Adjusted) figures for calculation of the CDRs and CSDRs, not the total of your 10year<br />
age groups (because these do not include persons under 25)<br />
1997 infant deaths, by race<br />
Go to the National Center for Health Statistics (NCHS) website (www.cdc.gov/nchs)<br />
Click on Tabulated State Data, then Deaths<br />
Scroll down to GMIII_1_97 (627 pages)<br />
Click View/Download PDF (directly underneath)<br />
Copy down the number of deaths under age 1 from all causes for your state, for Blacks and<br />
Whites (males and females are recorded separately, you must add these together)<br />
36