Demography - American Sociological Association
Demography - American Sociological Association
Demography - American Sociological Association

Create successful ePaper yourself
Turn your PDF publications into a flip-book with our unique Google optimized e-Paper software.
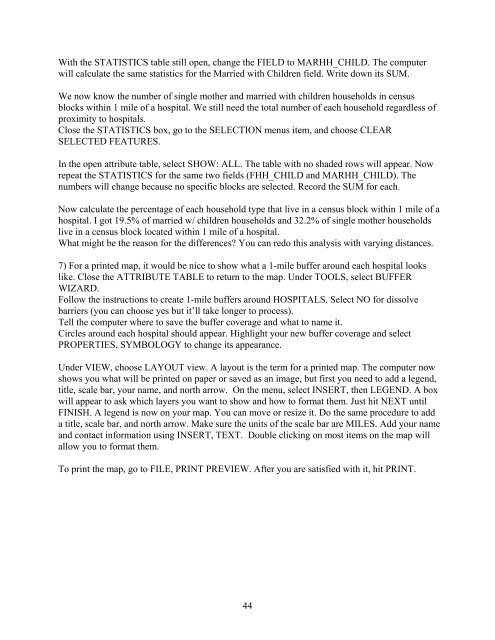
With the STATISTICS table still open, change the FIELD to MARHH_CHILD. The computer<br />
will calculate the same statistics for the Married with Children field. Write down its SUM.<br />
We now know the number of single mother and married with children households in census<br />
blocks within 1 mile of a hospital. We still need the total number of each household regardless of<br />
proximity to hospitals.<br />
Close the STATISTICS box, go to the SELECTION menus item, and choose CLEAR<br />
SELECTED FEATURES.<br />
In the open attribute table, select SHOW: ALL. The table with no shaded rows will appear. Now<br />
repeat the STATISTICS for the same two fields (FHH_CHILD and MARHH_CHILD). The<br />
numbers will change because no specific blocks are selected. Record the SUM for each.<br />
Now calculate the percentage of each household type that live in a census block within 1 mile of a<br />
hospital. I got 19.5% of married w/ children households and 32.2% of single mother households<br />
live in a census block located within 1 mile of a hospital.<br />
What might be the reason for the differences? You can redo this analysis with varying distances.<br />
7) For a printed map, it would be nice to show what a 1-mile buffer around each hospital looks<br />
like. Close the ATTRIBUTE TABLE to return to the map. Under TOOLS, select BUFFER<br />
WIZARD.<br />
Follow the instructions to create 1-mile buffers around HOSPITALS. Select NO for dissolve<br />
barriers (you can choose yes but it’ll take longer to process).<br />
Tell the computer where to save the buffer coverage and what to name it.<br />
Circles around each hospital should appear. Highlight your new buffer coverage and select<br />
PROPERTIES, SYMBOLOGY to change its appearance.<br />
Under VIEW, choose LAYOUT view. A layout is the term for a printed map. The computer now<br />
shows you what will be printed on paper or saved as an image, but first you need to add a legend,<br />
title, scale bar, your name, and north arrow. On the menu, select INSERT, then LEGEND. A box<br />
will appear to ask which layers you want to show and how to format them. Just hit NEXT until<br />
FINISH. A legend is now on your map. You can move or resize it. Do the same procedure to add<br />
a title, scale bar, and north arrow. Make sure the units of the scale bar are MILES. Add your name<br />
and contact information using INSERT, TEXT. Double clicking on most items on the map will<br />
allow you to format them.<br />
To print the map, go to FILE, PRINT PREVIEW. After you are satisfied with it, hit PRINT.<br />
44