Investigating Correlations between Snowmelt and Forest Fires in a ...
Investigating Correlations between Snowmelt and Forest Fires in a ...
Investigating Correlations between Snowmelt and Forest Fires in a ...

You also want an ePaper? Increase the reach of your titles
YUMPU automatically turns print PDFs into web optimized ePapers that Google loves.
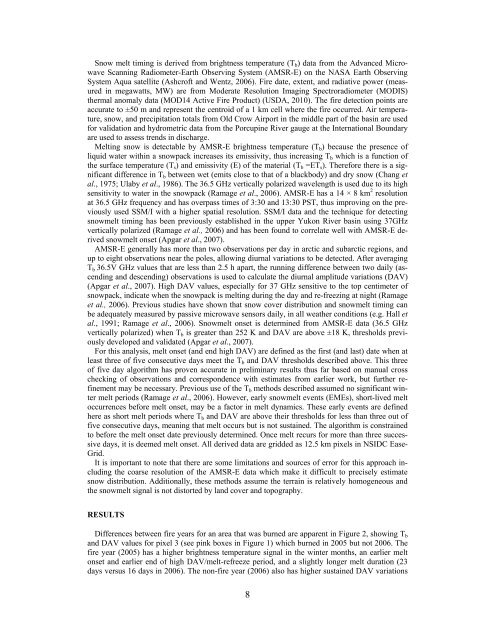
Snow melt tim<strong>in</strong>g is derived from brightness temperature (Tb) data from the Advanced Microwave<br />
Scann<strong>in</strong>g Radiometer-Earth Observ<strong>in</strong>g System (AMSR-E) on the NASA Earth Observ<strong>in</strong>g<br />
System Aqua satellite (Ashcroft <strong>and</strong> Wentz, 2006). Fire date, extent, <strong>and</strong> radiative power (measured<br />
<strong>in</strong> megawatts, MW) are from Moderate Resolution Imag<strong>in</strong>g Spectroradiometer (MODIS)<br />
thermal anomaly data (MOD14 Active Fire Product) (USDA, 2010). The fire detection po<strong>in</strong>ts are<br />
accurate to ±50 m <strong>and</strong> represent the centroid of a 1 km cell where the fire occurred. Air temperature,<br />
snow, <strong>and</strong> precipitation totals from Old Crow Airport <strong>in</strong> the middle part of the bas<strong>in</strong> are used<br />
for validation <strong>and</strong> hydrometric data from the Porcup<strong>in</strong>e River gauge at the International Boundary<br />
are used to assess trends <strong>in</strong> discharge.<br />
Melt<strong>in</strong>g snow is detectable by AMSR-E brightness temperature (Tb) because the presence of<br />
liquid water with<strong>in</strong> a snowpack <strong>in</strong>creases its emissivity, thus <strong>in</strong>creas<strong>in</strong>g Tb which is a function of<br />
the surface temperature (Ts) <strong>and</strong> emissivity (E) of the material (Tb =ETs). Therefore there is a significant<br />
difference <strong>in</strong> Tb <strong>between</strong> wet (emits close to that of a blackbody) <strong>and</strong> dry snow (Chang et<br />
al., 1975; Ulaby et al., 1986). The 36.5 GHz vertically polarized wavelength is used due to its high<br />
sensitivity to water <strong>in</strong> the snowpack (Ramage et al., 2006). AMSR-E has a 14 × 8 km 2 resolution<br />
at 36.5 GHz frequency <strong>and</strong> has overpass times of 3:30 <strong>and</strong> 13:30 PST, thus improv<strong>in</strong>g on the previously<br />
used SSM/I with a higher spatial resolution. SSM/I data <strong>and</strong> the technique for detect<strong>in</strong>g<br />
snowmelt tim<strong>in</strong>g has been previously established <strong>in</strong> the upper Yukon River bas<strong>in</strong> us<strong>in</strong>g 37GHz<br />
vertically polarized (Ramage et al., 2006) <strong>and</strong> has been found to correlate well with AMSR-E derived<br />
snowmelt onset (Apgar et al., 2007).<br />
AMSR-E generally has more than two observations per day <strong>in</strong> arctic <strong>and</strong> subarctic regions, <strong>and</strong><br />
up to eight observations near the poles, allow<strong>in</strong>g diurnal variations to be detected. After averag<strong>in</strong>g<br />
Tb 36.5V GHz values that are less than 2.5 h apart, the runn<strong>in</strong>g difference <strong>between</strong> two daily (ascend<strong>in</strong>g<br />
<strong>and</strong> descend<strong>in</strong>g) observations is used to calculate the diurnal amplitude variations (DAV)<br />
(Apgar et al., 2007). High DAV values, especially for 37 GHz sensitive to the top centimeter of<br />
snowpack, <strong>in</strong>dicate when the snowpack is melt<strong>in</strong>g dur<strong>in</strong>g the day <strong>and</strong> re-freez<strong>in</strong>g at night (Ramage<br />
et al., 2006). Previous studies have shown that snow cover distribution <strong>and</strong> snowmelt tim<strong>in</strong>g can<br />
be adequately measured by passive microwave sensors daily, <strong>in</strong> all weather conditions (e.g. Hall et<br />
al., 1991; Ramage et al., 2006). <strong>Snowmelt</strong> onset is determ<strong>in</strong>ed from AMSR-E data (36.5 GHz<br />
vertically polarized) when Tb is greater than 252 K <strong>and</strong> DAV are above ±18 K, thresholds previously<br />
developed <strong>and</strong> validated (Apgar et al., 2007).<br />
For this analysis, melt onset (<strong>and</strong> end high DAV) are def<strong>in</strong>ed as the first (<strong>and</strong> last) date when at<br />
least three of five consecutive days meet the Tb <strong>and</strong> DAV thresholds described above. This three<br />
of five day algorithm has proven accurate <strong>in</strong> prelim<strong>in</strong>ary results thus far based on manual cross<br />
check<strong>in</strong>g of observations <strong>and</strong> correspondence with estimates from earlier work, but further ref<strong>in</strong>ement<br />
may be necessary. Previous use of the Tb methods described assumed no significant w<strong>in</strong>ter<br />
melt periods (Ramage et al., 2006). However, early snowmelt events (EMEs), short-lived melt<br />
occurrences before melt onset, may be a factor <strong>in</strong> melt dynamics. These early events are def<strong>in</strong>ed<br />
here as short melt periods where Tb <strong>and</strong> DAV are above their thresholds for less than three out of<br />
five consecutive days, mean<strong>in</strong>g that melt occurs but is not susta<strong>in</strong>ed. The algorithm is constra<strong>in</strong>ed<br />
to before the melt onset date previously determ<strong>in</strong>ed. Once melt recurs for more than three successive<br />
days, it is deemed melt onset. All derived data are gridded as 12.5 km pixels <strong>in</strong> NSIDC Ease-<br />
Grid.<br />
It is important to note that there are some limitations <strong>and</strong> sources of error for this approach <strong>in</strong>clud<strong>in</strong>g<br />
the coarse resolution of the AMSR-E data which make it difficult to precisely estimate<br />
snow distribution. Additionally, these methods assume the terra<strong>in</strong> is relatively homogeneous <strong>and</strong><br />
the snowmelt signal is not distorted by l<strong>and</strong> cover <strong>and</strong> topography.<br />
RESULTS<br />
Differences <strong>between</strong> fire years for an area that was burned are apparent <strong>in</strong> Figure 2, show<strong>in</strong>g Tb<br />
<strong>and</strong> DAV values for pixel 3 (see p<strong>in</strong>k boxes <strong>in</strong> Figure 1) which burned <strong>in</strong> 2005 but not 2006. The<br />
fire year (2005) has a higher brightness temperature signal <strong>in</strong> the w<strong>in</strong>ter months, an earlier melt<br />
onset <strong>and</strong> earlier end of high DAV/melt-refreeze period, <strong>and</strong> a slightly longer melt duration (23<br />
days versus 16 days <strong>in</strong> 2006). The non-fire year (2006) also has higher susta<strong>in</strong>ed DAV variations<br />
8