Investigating Correlations between Snowmelt and Forest Fires in a ...
Investigating Correlations between Snowmelt and Forest Fires in a ...
Investigating Correlations between Snowmelt and Forest Fires in a ...

Create successful ePaper yourself
Turn your PDF publications into a flip-book with our unique Google optimized e-Paper software.
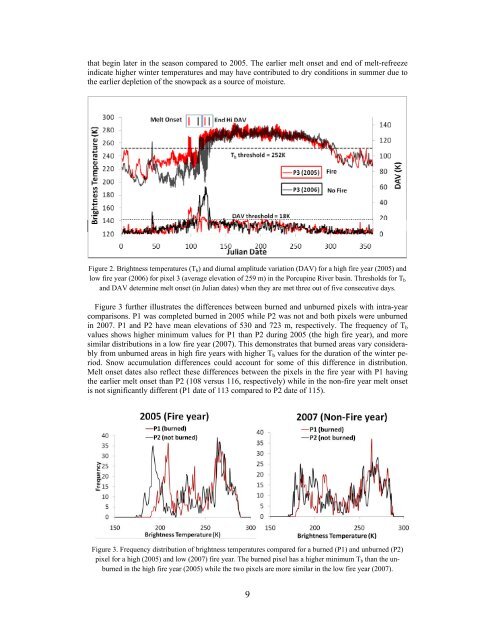
that beg<strong>in</strong> later <strong>in</strong> the season compared to 2005. The earlier melt onset <strong>and</strong> end of melt-refreeze<br />
<strong>in</strong>dicate higher w<strong>in</strong>ter temperatures <strong>and</strong> may have contributed to dry conditions <strong>in</strong> summer due to<br />
the earlier depletion of the snowpack as a source of moisture.<br />
Figure 2. Brightness temperatures (T b) <strong>and</strong> diurnal amplitude variation (DAV) for a high fire year (2005) <strong>and</strong><br />
low fire year (2006) for pixel 3 (average elevation of 259 m) <strong>in</strong> the Porcup<strong>in</strong>e River bas<strong>in</strong>. Thresholds for T b<br />
<strong>and</strong> DAV determ<strong>in</strong>e melt onset (<strong>in</strong> Julian dates) when they are met three out of five consecutive days.<br />
Figure 3 further illustrates the differences <strong>between</strong> burned <strong>and</strong> unburned pixels with <strong>in</strong>tra-year<br />
comparisons. P1 was completed burned <strong>in</strong> 2005 while P2 was not <strong>and</strong> both pixels were unburned<br />
<strong>in</strong> 2007. P1 <strong>and</strong> P2 have mean elevations of 530 <strong>and</strong> 723 m, respectively. The frequency of Tb<br />
values shows higher m<strong>in</strong>imum values for P1 than P2 dur<strong>in</strong>g 2005 (the high fire year), <strong>and</strong> more<br />
similar distributions <strong>in</strong> a low fire year (2007). This demonstrates that burned areas vary considerably<br />
from unburned areas <strong>in</strong> high fire years with higher Tb values for the duration of the w<strong>in</strong>ter period.<br />
Snow accumulation differences could account for some of this difference <strong>in</strong> distribution.<br />
Melt onset dates also reflect these differences <strong>between</strong> the pixels <strong>in</strong> the fire year with P1 hav<strong>in</strong>g<br />
the earlier melt onset than P2 (108 versus 116, respectively) while <strong>in</strong> the non-fire year melt onset<br />
is not significantly different (P1 date of 113 compared to P2 date of 115).<br />
Figure 3. Frequency distribution of brightness temperatures compared for a burned (P1) <strong>and</strong> unburned (P2)<br />
pixel for a high (2005) <strong>and</strong> low (2007) fire year. The burned pixel has a higher m<strong>in</strong>imum T b than the unburned<br />
<strong>in</strong> the high fire year (2005) while the two pixels are more similar <strong>in</strong> the low fire year (2007).<br />
9