Annual - Aramex
Annual - Aramex
Annual - Aramex

You also want an ePaper? Increase the reach of your titles
YUMPU automatically turns print PDFs into web optimized ePapers that Google loves.
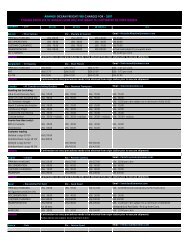
Year 2007<br />
Description International Express<br />
29%<br />
Freight Forwarding<br />
46%<br />
Domestic & Others<br />
25%<br />
<strong>Annual</strong><br />
Report 2008<br />
VIII<br />
Total Company<br />
100%<br />
Middle east 578.3 76.7% 537.4 56.3% 356.4 78.2% 1,472.2 68.1%<br />
Europe 65.1 9.4% 342.9 35.9% 72.6 14.0% 480.6 22.2%<br />
North America 36.7 3.1% 29.5 3.1% 2.4 3.4% 68.6 3.2%<br />
Asia & Indian Subcontinent 73.4 10.8% 45.1 4.7% 23.0 4.4% 141.6 6.5%<br />
Elimination (234.4) 0.0% (131.0) 0.0% (13.8) 0.0% (379.2)<br />
Total 519.1 100% 824.0 100% 440.7 100% 1,783.8 100%<br />
Seasonality<br />
The company’s business is seasonal in nature. Historically, the company experiences a decrease in demand for its services during the first<br />
and third quarters, the post-winter holiday and summer vacation seasons. The company traditionally experiences its highest volume in the<br />
fourth quarter due to the holiday season. The seasonality of the company’s sales may cause a variation in its quarterly operating results, and<br />
a significant decrease in second or fourth quarter revenues may have an adverse effect on the company’s results of operations for that fiscal<br />
year. However, local Middle East and Islamic holidays vary from year-to-year, as a result, the Company’s seasonality may shift over time.<br />
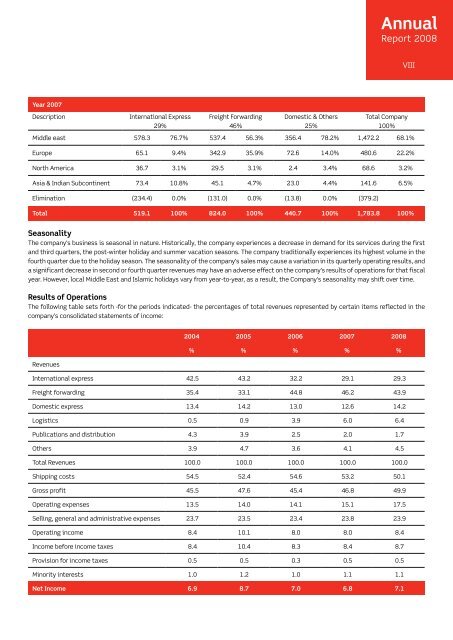
Results of Operations<br />
The following table sets forth -for the periods indicated- the percentages of total revenues represented by certain items reflected in the<br />
company’s consolidated statements of income:<br />
Revenues<br />
2004 2005 2006 2007 2008<br />
% % % % %<br />
International express 42.5 43.2 32.2 29.1 29.3<br />
Freight forwarding 35.4 33.1 44.8 46.2 43.9<br />
Domestic express 13.4 14.2 13.0 12.6 14.2<br />
Logistics 0.5 0.9 3.9 6.0 6.4<br />
Publications and distribution 4.3 3.9 2.5 2.0 1.7<br />
Others 3.9 4.7 3.6 4.1 4.5<br />
Total Revenues 100.0 100.0 100.0 100.0 100.0<br />
Shipping costs 54.5 52.4 54.6 53.2 50.1<br />
Gross profit 45.5 47.6 45.4 46.8 49.9<br />
Operating expenses 13.5 14.0 14.1 15.1 17.5<br />
Selling, general and administrative expenses 23.7 23.5 23.4 23.8 23.9<br />
Operating income 8.4 10.1 8.0 8.0 8.4<br />
Income before income taxes 8.4 10.4 8.3 8.4 8.7<br />
Provision for income taxes 0.5 0.5 0.3 0.5 0.5<br />
Minority interests 1.0 1.2 1.0 1.1 1.1<br />
Net Income 6.9 8.7 7.0 6.8 7.1