3D Processing and Analysis with ImageJ
3D Processing and Analysis with ImageJ
3D Processing and Analysis with ImageJ

You also want an ePaper? Increase the reach of your titles
YUMPU automatically turns print PDFs into web optimized ePapers that Google loves.
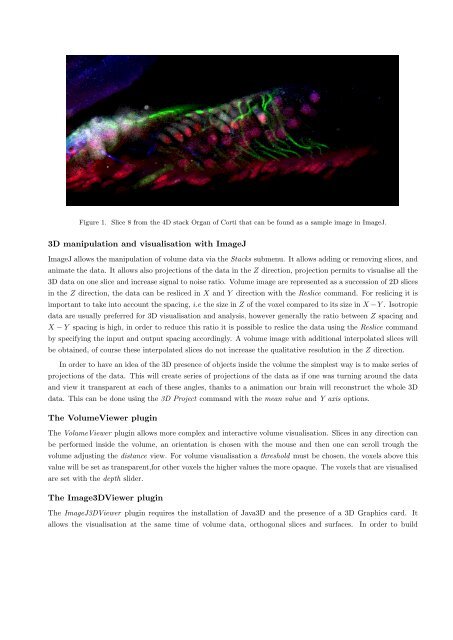
Figure 1. Slice 8 from the 4D stack Organ of Corti that can be found as a sample image in <strong>ImageJ</strong>.<br />
<strong>3D</strong> manipulation <strong>and</strong> visualisation <strong>with</strong> <strong>ImageJ</strong><br />
<strong>ImageJ</strong> allows the manipulation of volume data via the Stacks submenu. It allows adding or removing slices, <strong>and</strong><br />
animate the data. It allows also projections of the data in the Z direction, projection permits to visualise all the<br />
<strong>3D</strong> data on one slice <strong>and</strong> increase signal to noise ratio. Volume image are represented as a succession of 2D slices<br />
in the Z direction, the data can be resliced in X <strong>and</strong> Y direction <strong>with</strong> the Reslice comm<strong>and</strong>. For reslicing it is<br />
important to take into account the spacing, i.e the size in Z of the voxel compared to its size in X − Y . Isotropic<br />
data are usually preferred for <strong>3D</strong> visualisation <strong>and</strong> analysis, however generally the ratio between Z spacing <strong>and</strong><br />
X − Y spacing is high, in order to reduce this ratio it is possible to reslice the data using the Reslice comm<strong>and</strong><br />
by specifying the input <strong>and</strong> output spacing accordingly. A volume image <strong>with</strong> additional interpolated slices will<br />
be obtained, of course these interpolated slices do not increase the qualitative resolution in the Z direction.<br />
In order to have an idea of the <strong>3D</strong> presence of objects inside the volume the simplest way is to make series of<br />
projections of the data. This will create series of projections of the data as if one was turning around the data<br />
<strong>and</strong> view it transparent at each of these angles, thanks to a animation our brain will reconstruct the whole <strong>3D</strong><br />
data. This can be done using the <strong>3D</strong> Project comm<strong>and</strong> <strong>with</strong> the mean value <strong>and</strong> Y axis options.<br />
The VolumeViewer plugin<br />
The VolumeViewer plugin allows more complex <strong>and</strong> interactive volume visualisation. Slices in any direction can<br />
be performed inside the volume, an orientation is chosen <strong>with</strong> the mouse <strong>and</strong> then one can scroll trough the<br />
volume adjusting the distance view. For volume visualisation a threshold must be chosen, the voxels above this<br />
value will be set as transparent,for other voxels the higher values the more opaque. The voxels that are visualised<br />
are set <strong>with</strong> the depth slider.<br />
The Image<strong>3D</strong>Viewer plugin<br />
The <strong>ImageJ</strong><strong>3D</strong>Viewer plugin requires the installation of Java<strong>3D</strong> <strong>and</strong> the presence of a <strong>3D</strong> Graphics card. It<br />
allows the visualisation at the same time of volume data, orthogonal slices <strong>and</strong> surfaces. In order to build