Inside this Issue - Lincoln International
Inside this Issue - Lincoln International
Inside this Issue - Lincoln International

You also want an ePaper? Increase the reach of your titles
YUMPU automatically turns print PDFs into web optimized ePapers that Google loves.
<strong>Inside</strong> <strong>this</strong> <strong>Issue</strong><br />
Welcome to the third quarter 2008 issue of<br />
our Refrigerated and Frozen Foods Deal-<br />
Reader newsletter.<br />
With <strong>this</strong> issue, we plan to offer insight into<br />
the favorable trends impacting the private<br />
label food industry, provide statistics regarding<br />
trends and developments in the<br />
global consumer sector and provide an<br />
Overview<br />
The private label food industry is exhibiting<br />
strong growth characteristics as<br />
changing consumer preferences, compelling<br />
retailer economics and industry<br />
consolidation are driving long-term market<br />
share gains. In the United States, store<br />
brand sales grew from $30.5 billion to<br />
$34.9 billion for a CAGR of 3.4% over the<br />
four years ended 2006, significantly outperforming<br />
the overall food industry growth<br />
rate of 1.4% in the United States over the<br />
same period. Analysts project store<br />
branded food products to continue their<br />
strong growth with a projected CAGR of<br />
3.4% through 2011 (Packaged Facts, Private<br />
Label Food & Beverage in the U.S.<br />
February 2007).<br />
Changing Consumer<br />
Preferences<br />
Private label food products are capturing<br />
market share from their nationally branded<br />
counterparts as consumers are<br />
increasingly selecting quality store brand<br />
products over national brands. Historically,<br />
store branded products were viewed as a<br />
product for customers focused primarily on<br />
price and less concerned about quality.<br />
Price is certainly an important consideration<br />
for consumers of private label products, as<br />
evidenced by the resurgence of consumer<br />
interest in private labels during <strong>this</strong> current<br />
period of economic turbulence. Indeed, AC<br />
Nielsen reports private label brands have<br />
grown 10% in 2008 (year-to-date), due in<br />
part to increases in commodity costs, but<br />
also to increases in unit sales, as consumers<br />
switch to less expensive store brands in<br />
order to trim expenses.<br />
update on <strong>Lincoln</strong> <strong>International</strong>’s Consumer<br />
Group activities to date in 2008.<br />
Key topics covered in <strong>this</strong> issue include:<br />
• Spotlight article: Positive Dynamics in<br />
Private Label Food (pages 1-2)<br />
• Recent Transaction Overview<br />
(page 3)<br />
Positive Dynamics in Private Label Food<br />
However, other non-price factors are also<br />
responsible for the strong long-term growth<br />
in the private label category. Since the<br />
early 2000’s there has been a noticeable<br />
broadening of the targeted markets for<br />
store branded items as retailers have<br />
focused on providing store branded<br />
products of a comparable or higher quality<br />
to popular national brands. A good example<br />
of <strong>this</strong> is Target’s “Archer Farms” label,<br />
which often is priced at a premium to national<br />
brand equivalents.<br />
According to Nielsen, private label products<br />
penetrated 100% of households in 2005,<br />
with the average United States household<br />
purchasing private label products on 45%<br />
of their shopping trips. And according to a<br />
Gallup pole for the Private Label<br />
Manufacturers Association, 90% of<br />
consumers reported being familiar with<br />
store brands and 83% stated that they<br />
regularly purchase these<br />
products.<br />
Compelling<br />
Economics for<br />
Retailers<br />
Retailers are allocating more<br />
shelf space for private label<br />
brands due to significant<br />
direct and indirect economic<br />
benefits. In general, store<br />
brands average a gross profit<br />
margin for retailers of about<br />
35%, while national brands<br />
provide retailers with an<br />
average gross margin of 25%.<br />
This difference can make a<br />
substantial impact on the<br />
profitability of a retail store,<br />
1 <strong>Lincoln</strong> <strong>International</strong> DEALREADER Refrigerated and Frozen Foods<br />
Refrigerated and Frozen<br />
Foods<br />
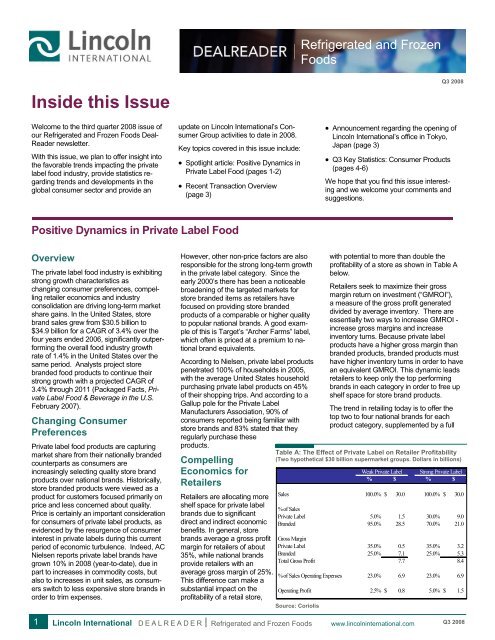
with potential to more than double the<br />
profitability of a store as shown in Table A<br />
below.<br />
Retailers seek to maximize their gross<br />
margin return on investment (“GMROI”),<br />
a measure of the gross profit generated<br />
divided by average inventory. There are<br />
essentially two ways to increase GMROI -<br />
increase gross margins and increase<br />
inventory turns. Because private label<br />
products have a higher gross margin than<br />
branded products, branded products must<br />
have higher inventory turns in order to have<br />
an equivalent GMROI. This dynamic leads<br />
retailers to keep only the top performing<br />
brands in each category in order to free up<br />
shelf space for store brand products.<br />
The trend in retailing today is to offer the<br />
top two to four national brands for each<br />
product category, supplemented by a full<br />
www.lincolninternational.com<br />
Q3 2008<br />
• Announcement regarding the opening of<br />
<strong>Lincoln</strong> <strong>International</strong>’s office in Tokyo,<br />
Japan (page 3)<br />
• Q3 Key Statistics: Consumer Products<br />
(pages 4-6)<br />
We hope that you find <strong>this</strong> issue interesting<br />
and we welcome your comments and<br />
suggestions.<br />
Table A: The Effect of Private Label on Retailer Profitability<br />
(Two hypothetical $30 billion supermarket groups. Dollars in billions)<br />
Weak Private Label Strong Private Label<br />
% $ % $<br />
Sales 100.0% $ 30.0 100.0% $ 30.0<br />
% of Sales<br />
Private Label 5.0% 1.5<br />
Branded 95.0% 28.5<br />
Gross Margin<br />
Private Label 35.0% 0.5<br />
Branded 25.0% 7.1<br />
Total Gross Profit 7.7<br />
% of Sales Operating Expenses 23.0% 6.9<br />
30.0% 9.0<br />
70.0% 21.0<br />
35.0% 3.2<br />
25.0% 5.3<br />
8.4<br />
23.0% 6.9<br />
Operating Profit 2.5% $ 0.8 5.0% $ 1.5<br />
Source: Coriolis<br />
Q3 2008
Private Label (cont’d)<br />
offering of store branded products. Many<br />
retailers provide multiple store branded<br />
products for each category at various price<br />
and quality levels. Along with the more<br />
traditional private label offerings, retailers<br />
have introduced premium store brands that<br />
compete<br />
directly with<br />
national<br />
brands.<br />
These<br />
products<br />
either have<br />
the store’s<br />
name or a unique brand name such as<br />
Costco’s “Kirkland.” Often, retailers seek to<br />
develop premium brands that offer taste<br />
and quality characteristics that are better<br />
than their nationally branded counterparts.<br />
Retailers support these store brands with<br />
promotions, advertising and often prime<br />
shelf-space. As customers recognize the<br />
value provided by the store labeled<br />
product, they shift their brand loyalty from<br />
the nationally branded products to the<br />
retailer’s store brand. Accordingly, a report<br />
from Private Label Buyer stated that retail<br />
chains see incremental increases in private<br />
label quality alone as the means to drive an<br />
additional 3% to 6% market share, which<br />
begins to bring retailer projections in line<br />
with analyst expectations that private label<br />
will account for 27% of North American<br />
grocery sales by the end of the decade. By<br />
using private label products to drive store<br />
loyalty, retailers are repositioning<br />
themselves to more effectively compete in<br />
the rapidly consolidating grocery store<br />
industry.<br />
“The trend in retailing today is to<br />
offer the top two to four national<br />
brands for each product category,<br />
supplemented by a full offering of<br />
store branded products.”<br />
Consolidating Retail<br />
Industry Will Increase Store<br />
Brand Penetration<br />
While store brands are rapidly taking<br />
market share from national brand products,<br />
the United States private label food market<br />
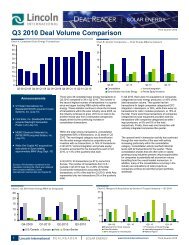
has room for substantial growth. According<br />
to Information Resources, Inc. (IRI), the<br />
market share for store branded food<br />
products in the United States was 16.1% in<br />
2006, up from 15.6% in 2002 (IRI does not<br />
account for Wal-Mart, which has been<br />
gaining market share through a strong<br />
private label strategy). In other developed<br />
nations, private label brands have a much<br />
higher penetration. As shown in Chart B<br />
below, private label products have a 31%<br />
market share in Canada, 38% market<br />
share in Switzerland, 31% market share in<br />
Great Britain and 23% share in Europe as<br />
a whole.<br />
These developed nations are similar to the<br />
United States in their exposure to many of<br />
the same major brands and mass media<br />
promotion. The main difference in retail<br />
between these countries is the level of<br />
consolidation of major retailers. In Canada,<br />
for example, the top five grocery retailers<br />
account for 82% of total retail food sales,<br />
compared with the United<br />
States in which the top five<br />
retailers represent only around<br />
one-third of national sales,<br />
according to Deloitte<br />
Consulting.<br />
Major United States grocery<br />
stores have been consolidating significantly<br />
as an increasingly competitive industry is<br />
encouraging<br />
companies to<br />
seek greater<br />
economies of<br />
scale through<br />
acquisitions,<br />
resulting in a<br />
increasing<br />
share of the<br />
market being<br />
controlled by<br />
the largest<br />
grocery chains.<br />
According to a<br />
report issued<br />
by the USDA,<br />
the top 20<br />
Chart C: Store Brand Penetration by Food Category<br />
grocery retailers accounted for 39% of total<br />
US grocery sales in 1992. By 2005 the top<br />
20 companies expanded their share of the<br />
market to 62%. This was due primarily to a<br />
major wave of consolidation that took place<br />
between 1997 and 2000, when over 4,100<br />
supermarkets were acquired by top chains,<br />
representing $61 billion in sales. Recent<br />
activity in retail consolidation suggests that<br />
large stores will continue to grow through<br />
mergers and acquisitions leading to even<br />
fewer retailers controlling the majority of<br />
grocery sales in the US. We expect <strong>this</strong><br />
trend to contribute to increased penetration<br />
of private label food products.<br />
Chart B: Store Brand Penetration by Country<br />
2 <strong>Lincoln</strong> <strong>International</strong> DEALREADER Refrigerated and Frozen Foods<br />
40%<br />
35%<br />
30%<br />
25%<br />
20%<br />
15%<br />
10%<br />
5%<br />
0%<br />
Latin America<br />
2%<br />
Asia Pacific<br />
4%<br />
35%<br />
30%<br />
25%<br />
20%<br />
15%<br />
10 %<br />
5%<br />
0%<br />
Emerging Markets<br />
30% 27% 25%<br />
6%<br />
North America<br />
16%<br />
Global<br />
17%<br />
Europe (Average)<br />
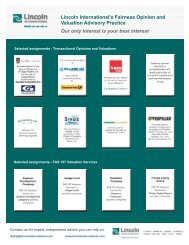
Underpenetrated Categories<br />
Staged for Strong Growth<br />
The penetration rate of private label<br />
products varies significantly by product line.<br />
For example, store brand products<br />
represent 29.7% of all dairy products sold<br />
in the United States, while private label<br />
baby food accounts for only 1.6% of its<br />
respective market. As consumers continue<br />
to change buying habits to include a<br />
broader range of store brand products,<br />
many categories that currently have below<br />
average penetration are likely to grow even<br />
faster than the overall category. Chart C<br />
below shows various categories of store<br />
19 % 17% 16 %<br />
brand food products along with their<br />
relative total market penetration.<br />
Private Label Investing<br />
The private label food industry is an<br />
attractive opportunity for investors. The<br />
long term growth rate of the food industry is<br />
stable and resistant to significant cyclicality.<br />
Private label foods are positioned to<br />
continue outperforming the overall food<br />
category driven by compelling economics<br />
for retailers and the general trend toward<br />
retailer consolidation. Well positioned<br />
companies in <strong>this</strong> industry, with established<br />
competitive advantages serving<br />
underpenetrated categories represent<br />
attractive<br />
investment<br />
opportunities<br />
38% which drive<br />
premium<br />
31%<br />
valuations even in<br />
23%<br />
the current<br />
financial markets.<br />
Great Britain<br />
12 % 9% 8% 8% 8%<br />
Dairy<br />
Fruits<br />
Vegetables<br />
Cond. & Sauces<br />
Meats<br />
Grains<br />
Sweets<br />
Snacks<br />
Ethnic Foods<br />
Appetizers<br />
Pizza<br />
Baby Food<br />
Switzerland<br />
www.lincolninternational.com<br />
2%<br />
Q3 2008
Recent Private Label Food Transaction<br />
A majority interest in<br />
Ann’s House of Nuts has<br />
been sold to Olympus<br />
Partners<br />
In the third quarter<br />
of 2008, <strong>Lincoln</strong><br />
<strong>International</strong><br />
announced the<br />
sale of a majority<br />
interest in Ann’s<br />
House of Nuts<br />
(“Ann’s” or “the<br />
Company”) to<br />
Olympus Partners,<br />
a private<br />
equity firm based in Stamford, CT. <strong>Lincoln</strong><br />
<strong>International</strong> acted as the exclusive financial<br />
advisor to Ann’s. Terms of the transaction<br />
were not disclosed.<br />
Ann’s, founded in 1973, is the largest privately-held<br />
provider of trail mixes and<br />
snack nuts in the world. With a leadership<br />
position in the private label healthy snack<br />
foods market, the Company formulates,<br />
imports and processes a comprehensive<br />
array of trail mixes, snack nuts, dried fruits<br />
and other products for global distribution.<br />
Ann’s is a primary private label supplier in<br />
its categories to customers in the mass<br />
merchandise, supercenter, wholesale club,<br />
grocery, military and other channels. The<br />
Company also provides products under<br />
leading brands such as Ann’s House® and<br />
Ann’s House of Nuts®. In addition to its<br />
<strong>Lincoln</strong> <strong>International</strong> Opens Office in Tokyo, Japan<br />
On July 25, 2008, <strong>Lincoln</strong> <strong>International</strong><br />
opened an office in Tokyo, Japan. <strong>Lincoln</strong><br />
also has three offices in North America<br />
(Chicago, Los Angeles and New York) and<br />
five offices in Europe (Frankfurt, London,<br />
Madrid, Paris and Vienna). Tetsuya Fujii<br />
has been hired as a Managing Director to<br />
lead the new office.<br />
<strong>Lincoln</strong> <strong>International</strong>’s Tokyo team will provide<br />
merger and acquisition advisory services<br />
to Japanese corporations that are<br />
focused on cross-border business development,<br />
primarily acquisitions. The Tokyobased<br />
team will also identify and contact<br />
potential Japanese acquirers for North<br />
American and European sell-side assignments<br />
being executed by <strong>Lincoln</strong> <strong>International</strong>’s<br />
North American and European offices.<br />
On a case-by-case basis the Tokyo<br />
team will work on out-in (foreign company<br />
buying or investing in a Japanese company)<br />
as well as in-in (domestic) transactions.<br />
About <strong>Lincoln</strong> <strong>International</strong><br />
<strong>Lincoln</strong> <strong>International</strong> specializes in merger and acquisition services<br />
and private capital raising for leading organizations involved<br />
in mid-market transactions. With offices in Chicago,<br />
Frankfurt, London, Los Angeles, Madrid, New York, Paris, Tokyo<br />
and Vienna, and strategic partnerships with China Everbright<br />
and other partner firms in Asia, <strong>Lincoln</strong> <strong>International</strong> has<br />
strong local knowledge and contacts in the key global economies.<br />
The organization provides clients with senior-level attention,<br />
in-depth industry expertise, and integrated resources. By<br />
being focused and independent, <strong>Lincoln</strong> <strong>International</strong> serves its<br />
clients without conflicts of interest. More information about <strong>Lincoln</strong><br />
<strong>International</strong> can be obtained at<br />
www.lincolninternational.com<br />
<strong>Lincoln</strong> <strong>International</strong> offers a unique, differentiated<br />
service to Japanese clients. The<br />
Tokyo office of <strong>Lincoln</strong> <strong>International</strong> provides<br />
an enthusiastic and intense focus on<br />
completing mid-market transactions in combination<br />
with very active M&A practices in<br />
both North America and Europe. <strong>International</strong><br />
investment banks lack enthusiasm<br />
and focus for mid-market transactions and<br />
virtually all mid-market firms lack the global<br />
resources and industry expertise of <strong>Lincoln</strong><br />
<strong>International</strong>. Because close to 90% of<br />
Japanese M&A transactions are midmarket<br />
in size, <strong>Lincoln</strong> <strong>International</strong> is positioned<br />
to provide significant value added<br />
assistance to Japanese companies.<br />
<strong>Lincoln</strong> <strong>International</strong>’s founders and senior<br />
management have had significant prior<br />
association with prestigious Japanese institutions<br />
in the 1990's, and have developed<br />
an understanding of the Japanese market<br />
and culture as a result. This history will help<br />
to facilitate the smooth integration of the<br />
3 <strong>Lincoln</strong> <strong>International</strong> DEALREADER Refrigerated and Frozen Foods<br />
headquarters and production facility in Jessup,<br />
MD, the Company also has a production<br />
facility in Robersonville, NC.<br />
Edward Zinke, Founder and former Chief<br />
Executive Officer of Ann’s, added “We are<br />
very pleased to partner with Olympus Partners<br />
as we continue to build upon the<br />
strong entrepreneurial history of Ann’s.<br />
<strong>Lincoln</strong> <strong>International</strong>’s involvement and<br />
counsel ensured the best outcome for<br />
Ann’s and its shareholders.”<br />
Officer Contacts - North America<br />
Brad Akason<br />
Managing Director<br />
bakason@lincolninternational.com<br />
+1-312-580-8351<br />
Federico G.M. Mennella CFA<br />
Managing Director<br />
fmennella@lincolninternational.com<br />
+1-212-277-8103<br />
Tokyo office into the <strong>Lincoln</strong> <strong>International</strong><br />
platform.<br />
Fujii will be also be joined by Tokyo-based<br />
senior M&A bankers from major international<br />
investment banks, as well as additional<br />
bankers seconded from <strong>Lincoln</strong> <strong>International</strong>’s<br />
U.S. and European offices. Currently,<br />
<strong>Lincoln</strong> <strong>International</strong> has more than<br />
100 M&A bankers, with almost 50 in<br />
Europe and more than 60 in North America,<br />
as well as strong strategic partners in China<br />
and India.<br />
“<strong>Lincoln</strong> <strong>International</strong>’s fully-integrated<br />
global platform is unique to the mid-market<br />
and exactly what Japanese firms need as<br />
they increase focus on cross-border M&A<br />
business development,” said Fujii. “<strong>Lincoln</strong><br />
not only has impressive global reach, but<br />
many of their investment bankers have<br />
deep expertise within specific industry sectors.”<br />
David Houser<br />
Managing Director<br />
dhouser@lincolninternational.com<br />
+1-312-580-5805<br />
Chris Stradling<br />
Vice President<br />
cstradling@lincolninternational.com<br />
+1-312-580-8325<br />
For contact information in each of our nine global offices, please visit<br />
www.lincolninternational.com<br />
Contributors<br />
Jeffrey Treichel, Associate, jtreichel@lincolninternational.com<br />
Hannah Montzka, Associate, hmontzka@lincolninternational.com<br />
Claire Burke, Analyst, cburke@lincolninternational.com<br />
www.lincolninternational.com<br />
© 2008 <strong>Lincoln</strong> <strong>International</strong> LLC<br />
Q3 2008
Index Value<br />
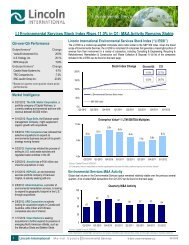
Q3 Key Statistics — Consumer Products<br />
United States Consumer Confidence Levels 1<br />
Enterprise Value /<br />
LTM EBTIDA<br />
115<br />
105<br />
95<br />
85<br />
75<br />
65<br />
55<br />
45<br />
Jan-03 Jul-03 Jan-04 Jul-04 Jan-05 Jul-05 Jan-06 Jul-06 Jan-07 Jul-07 Jan-08 Jul-08<br />
Valuations of Consumer Product Companies 2 Consumer Industry Stock Performance 3<br />
13.0x<br />
12.0x<br />
11.0x<br />
10.0x<br />
9.0x<br />
8.0x<br />
12.2x<br />
9.7x<br />
1. Source: Capital IQ<br />
2. Source: <strong>Lincoln</strong> <strong>International</strong> indices<br />
3. U.S. Consumer Services Index comprised of the Dow Jones U.S. Consumer Services Index and U.S. Consumer Goods Index comprised of the Dow Jones U.S. Consumer<br />
Goods Index. Note: Indices are stock price weighted.<br />
Retail Sales Performance (LTM) 4<br />
9.4x<br />
9.3x<br />
4 <strong>Lincoln</strong> <strong>International</strong> DEALREADER Refrigerated and Frozen Foods<br />
8.9x<br />
8.8x<br />
Consumer Products Food Products Household Products<br />
Q2 2008 Q3 2008<br />
Relative Performance<br />
Year-Over-Year Same Store Sales Growth<br />
110%<br />
105%<br />
100%<br />
95%<br />
90%<br />
85%<br />
80%<br />
75%<br />
Aug-07 Oct-07 Dec-07 Feb-08 Apr-08 Jun-08 Aug-08<br />
U.S. Consumer Services U.S. Consumer Goods S&P 500<br />
Sep-07 Oct-07 Nov-07 Dec-07 Jan-08 Feb-08 Mar-08 Apr-08 May-08 Jun-08 Jul-08 Aug-08<br />
Club Stores 4.7% 5.3% 7.9% 4.5% 6.6% 6.0% 5.0% 11.8% 9.6% 11.3% 11.3% 10.6%<br />
Department Stores 5.6% 5.3% 13.4% (0.1%) 0.3% (3.2%) (3.9%) 6.1% 0.8% (6.4%) (4.4%) (4.8%)<br />
Dollar Stores 0.5% 0.0% (3.4%) (0.7%) (0.1%) 1.3% (4.4%) 4.3% 1.8% 8.0% 4.6% 3.6%<br />
Drug Stores (0.5%) 1.9% 1.5% 0.3% 2.6% 5.3% 3.5% 1.1% 2.6% 1.5% 2.7% 1.0%<br />
Mass Merchants 1.0% 2.1% 5.9% (1.2%) (0.5%) 1.8% (1.7%) 3.5% 1.9% 3.4% 0.9% 0.7%<br />
Specialty Apparel (6.0%) (4.6%) (1.7%) (5.2%) (1.4%) (1.1%) (11.3%) 0.8% (3.6%) (3.1%) (5.1%) (3.9%)<br />
Average 0.9% 1.7% 3.9% (0.4%) 1.2% 1.7% (2.1%) 4.6% 2.2% 2.5% 1.7% 1.2%<br />
4. Club Stores comprised of Costco, Sam’s Club and BJ’s; Department Stores comprised of Federated, Neiman Marcus and Nordstrom; Dollar Stores comprised of<br />
Family Dollar; Drug Stores comprised of non-pharmaceutical sales of Rite-Aid, Walgreen Co. and CVS; Mass Merchants comprised of Wal-Mart and Target; Specialty<br />
Apparel comprised of Abercrombie & Fitch, Gap, Limited Brands and Ann Taylor Loft. Note: Growth rates consist of an average of aforementioned components.<br />
www.lincolninternational.com<br />
Q3 2008
Q3 Key Statistics — Publicly Traded Food Company Metrics<br />
Large Capitalization Food Company Profitability Metrics 1<br />
($ in billions, except for share data)<br />
52 Week Market P/E Multiples Enterprise EV/LTM<br />
Selected Companies Last Price High Low Cap LTM 2007 2008 Value Revenue EBIT EBITDA<br />
Procter & Gamble Co. $ 71.44 $ 75.2 $ 60.1 $ 214.3 19.6x 19.6x 17.2x $ 248.8<br />
3.0x 14.6x 12.3x<br />
Nestle SA 42.17 50.6 38.6 158.7 16.6x 16.6x 16.0x 185.6 1.9x 12.4x 10.4x<br />
Pepsico, Inc. 70.91 79.8 63.3 111.0 19.8x 19.8x 19.2x 116.1 2.7x 14.0x 11.9x<br />
Unilever NV 27.37 37.1 24.6 76.8 14.7x 14.7x 14.9x 93.1 1.7x 11.9x 10.1x<br />
Kraft Foods Inc. 33.54 35.3 28.0 50.9 20.6x 20.6x 17.4x 71.6 1.8x 13.6x 11.5x<br />
Groupe DANONE 67.36 92.2 58.4 32.2 26.4x 26.4x 17.7x 49.0 2.7x 19.5x 15.8x<br />
General Mills Inc. 69.50 72.0 51.0 23.2 18.8x 18.8x 18.0x 30.2 2.1x 12.9x 10.8x<br />
Kellogg Co. 57.02 58.5 46.3 21.6 20.2x 20.2x 18.8x 26.9 2.2x 13.4x 11.3x<br />
HJ Heinz Co. 50.42 53.0 41.4 15.7 18.5x 18.5x 17.1x 20.7 2.0x 12.8x 10.8x<br />
George Weston Limited 50.19 69.3 40.3 6.5 13.3x 13.3x 13.1x 14.7 0.5x 12.7x 8.1x<br />
Campbell Soup Co. 39.47 40.1 30.2 14.2 22.4x 22.4x 17.9x 16.5 2.1x 13.0x 10.7x<br />
ConAgra Foods, Inc. 19.92 26.3 18.9 8.9 19.5x 19.5x 13.6x 12.0 1.0x 11.7x 9.1x<br />
Hershey Co. 38.96 47.4 32.3 8.8 40.3x 40.3x 21.8x 11.3 2.2x 13.7x 10.0x<br />
Associated British Foods plc 12.78 17.0 12.8 10.1 13.7x 13.7x n/a 12.1 0.9x 11.6x 7.8x<br />
Median 19.6x 19.6x 17.4x 2.0x 12.9x 10.7x<br />
Mean 20.3x 20.3x 17.1x 1.9x 13.4x 10.8x<br />
($ in billions, except for share data)<br />
LTM EBITDA/Rev EBIT/Rev NI/Rev<br />
Selected Companies Revenue EBIT EBITDA NI LTM Avg LTM Avg LTM Avg<br />
Procter & Gamble Co. $ 83.5 $ 17.1 $ 20.2 $ 12.1 24.2% 24.0% 20.5% 20.1% 14.5% 13.6%<br />
Nestle SA 107.2 15.1 18.3 10.7 17.0% 16.6% 14.1% 13.6% 10.0% 9.4%<br />
Pepsico, Inc. 41.8 7.6 9.1 5.9 21.8% 22.4% 18.3% 18.6% 14.0% 14.3%<br />
Unilever NV 63.1 8.6 10.1 6.3 16.0% 16.4% 13.6% 14.0% 9.9% 10.5%<br />
Kraft Foods Inc. 41.0 5.3 6.3 2.5 15.4% 17.0% 13.0% 14.5% 6.1% 7.8%<br />
Groupe DANONE 22.0 3.1 3.8 6.9 17.3% 16.9% 14.0% 13.4% 31.5% 19.2%<br />
General Mills Inc. 14.1 2.2 2.7 1.3 19.0% 20.2% 15.7% 16.8% 9.1% 9.3%<br />
Kellogg Co. 12.4 2.0 2.4 1.1 19.1% 20.6% 16.1% 17.2% 8.9% 9.4%<br />
HJ Heinz Co. 10.4 1.6 1.9 0.9 18.2% 18.7% 15.3% 15.8% 8.3% 8.2%<br />
George Weston Limited 32.1 1.2 1.9 0.6 5.8% 6.8% 3.7% 4.6% 1.8% 1.5%<br />
Campbell Soup Co. 8.0 1.3 1.6 1.2 19.6% 19.5% 16.2% 15.9% 14.6% 12.0%<br />
ConAgra Foods, Inc. 12.1 1.0 1.3 1.2 10.6% 12.0% 8.2% 9.1% 9.9% 6.9%<br />
Hershey Co. 5.0 0.8 1.1 0.2 21.6% 24.3% 15.8% 19.4% 4.4% 8.6%<br />
Associated British Foods plc 14.5 1.1 1.7 0.8 11.7% 12.3% 7.8% 8.5% 5.8% 5.7%<br />
Median 17.7% 17.9% 14.7% 15.1% 9.5% 9.4%<br />
Mean 17.0% 17.7% 13.7% 14.4% 10.6% 9.7%<br />
Mid Capitalization Food Company Profitability Metrics 1<br />
($ in billions, except for share data)<br />
52 Week Market P/E Multiples Enterprise EV/LTM<br />
Selected Companies Last Price High Low Cap LTM 2007 2008 Value Revenue EBIT EBITDA<br />
Hormel Foods Corp. $ 36.84 $ 42.8 $ 33.4 $ 5.0 15.9x 15.9x 16.5x $ 5.3<br />
0.8x 10.1x 8.1x<br />
Grupo Bimbo SA de CV 6.15 6.6 5.0 7.2 21.1x 21.1x 18.2x 7.6 1.1x 12.9x 9.5x<br />
Del Monte Foods Co. 7.74 10.8 6.4 1.5 12.6x 12.6x 13.2x 3.5 0.9x 10.0x 7.6x<br />
The J. M. Smucker Company 51.10 56.7 40.2 2.8 16.7x 16.7x 15.0x 3.5 1.3x 11.6x 9.5x<br />
Maple Leaf Foods Inc. 8.04 14.9 7.3 1.0 NM NM 118.7x 2.3 0.4x 15.5x 7.8x<br />
Flowers Foods, Inc. 29.19 32.7 20.1 2.7 26.0x 26.0x 24.1x 2.7 1.3x 18.0x 12.5x<br />
Chiquita Brands <strong>International</strong> Inc. 14.83 25.8 12.5 0.7 17.2x 17.2x 10.0x 1.4 0.3x 9.6x 5.9x<br />
Fresh Del Monte Produce Inc. 21.22 39.8 19.3 1.3 7.7x 7.7x 8.7x 2.0 0.5x 10.5x 7.0x<br />
Ralcorp Holdings Inc. 68.85 74.1 48.1 1.8 13.0x 13.0x 19.2x 2.3 0.9x 13.6x 9.0x<br />
Treehouse Foods Inc. 31.23 30.3 19.2 1.0 27.8x 27.8x 19.4x 1.5 1.1x 16.9x 11.5x<br />
Median 16.7x 16.7x 17.4x 0.9x 12.2x 8.5x<br />
Mean 17.6x 17.6x 26.3x 0.9x 12.9x 8.8x<br />
($ in billions, except for share data)<br />
LTM EBITDA/Rev EBIT/Rev NI/Rev<br />
Selected Companies Revenue EBIT EBITDA NI LTM Avg LTM Avg LTM Avg<br />
Hormel Foods Corp. $ 6.6 $ 0.5 $ 0.6 $ 0.3 9.9% 9.9% 7.9% 7.8% 4.9% 4.9%<br />
Grupo Bimbo SA de CV 7.4 0.6 0.9 0.4 11.6% 11.8% 8.6% 8.7% 5.0% 5.3%<br />
Del Monte Foods Co. 3.8 0.3 0.5 0.1 11.9% 13.3% 9.0% 10.4% 3.1% 4.1%<br />
The J. M. Smucker Company 2.6 0.3 0.4 0.2 13.8% 14.7% 11.3% 12.0% 6.5% 6.9%<br />
Maple Leaf Foods Inc. 5.0 0.1 0.3 0.2 5.7% 6.3% 2.9% 3.8% 3.7% 1.9%<br />
Flowers Foods, Inc. 2.2 0.2 0.2 0.1 10.3% 9.6% 7.1% 6.2% 4.8% 4.2%<br />
Chiquita Brands <strong>International</strong> Inc. 4.8 0.1 0.2 0.0 4.7% 4.0% 2.9% 2.2% 0.8% -0.1%<br />
Fresh Del Monte Produce Inc. 3.5 0.2 0.3 0.2 7.4% 5.9% 5.0% 3.3% 4.9% 1.5%<br />
Ralcorp Holdings Inc. 2.6 0.2 0.3 0.1 9.9% 10.7% 6.4% 7.1% 5.4% 3.0%<br />
Treehouse Foods Inc. 1.4 0.1 0.1 0.0 9.9% 9.5% 6.8% 6.7% 2.6% 3.5%<br />
Median 9.9% 9.7% 6.9% 6.9% 4.8% 3.8%<br />
Mean 9.5% 9.6% 6.8% 6.8% 4.2% 3.5%<br />
1) Source:Capital IQ<br />
Note: All stock prices and LTM calculations are as of October 3, 2008; NM = Not Meaningful<br />
5 <strong>Lincoln</strong> <strong>International</strong> DEALREADER Refrigerated and Frozen Foods<br />
www.lincolninternational.com<br />
Q3 2008
Commodity Report<br />
Corn<br />
300<br />
250<br />
200<br />
150<br />
100<br />
50<br />
0<br />
Soybeans<br />
300<br />
250<br />
200<br />
150<br />
100<br />
50<br />
0<br />
Wheat<br />
Cattle<br />
Poultry Fluid Milk<br />
250<br />
200<br />
150<br />
100<br />
50<br />
0<br />
Source: Bureau of Labor Statistics, US Department of Labor<br />
Note: For all prices indices, average of 1990 - 1992 = 100. Charts are updated through August 15, 2008<br />
6 <strong>Lincoln</strong> <strong>International</strong> DEALREADER Refrigerated and Frozen Foods<br />
400<br />
350<br />
300<br />
250<br />
200<br />
150<br />
100<br />
50<br />
0<br />
150<br />
140<br />
130<br />
120<br />
110<br />
100<br />
90<br />
80<br />
70<br />
Aug-03<br />
Dec-03<br />
Apr-04<br />
Aug-04<br />
Dec-04<br />
Apr-05<br />
Aug-05<br />
Dec-05<br />
Apr-06<br />
Aug-06<br />
Dec-06<br />
Apr-07<br />
Aug-07<br />
Dec-07<br />
Aug-03<br />
Apr-08<br />
Dec-03<br />
Aug-08<br />
Apr-04<br />
Aug-04<br />
Dec-04<br />
Aug-03<br />
Apr-05<br />
Dec-03<br />
Aug-05<br />
Apr-04<br />
Aug-04<br />
Dec-05<br />
Apr-06<br />
Dec-04<br />
Aug-06<br />
Apr-05<br />
Dec-06<br />
Aug-05<br />
Apr-07<br />
Dec-05<br />
Apr-06<br />
Aug-07<br />
Aug-03<br />
Dec-07<br />
Aug-06<br />
Dec-03<br />
Apr-08<br />
Dec-06<br />
Apr-04<br />
Aug-08<br />
Apr-07<br />
Aug-04<br />
Aug-07<br />
Dec-04<br />
Dec-07<br />
Apr-05<br />
Aug-03<br />
Apr-08<br />
Aug-05<br />
Dec-03<br />
Aug-08<br />
Dec-05<br />
Apr-04<br />
Apr-06<br />
Aug-04<br />
Aug-06<br />
Dec-04<br />
Dec-06<br />
Apr-05<br />
Apr-07<br />
Aug-05<br />
Aug-07<br />
Dec-05<br />
Dec-07<br />
Apr-06<br />
Apr-08<br />
Aug-06<br />
Aug-08<br />
Dec-06<br />
Apr-07<br />
Aug-07<br />
Dec-07<br />
Aug-03<br />
Apr-08<br />
Dec-03<br />
Aug-08<br />
Apr-04<br />
Aug-04<br />
Dec-04<br />
Apr-05<br />
Aug-05<br />
Dec-05<br />
Apr-06<br />
Aug-06<br />
Dec-06<br />
Apr-07<br />
Aug-07<br />
Dec-07<br />
Apr-08<br />
Aug-08<br />
180<br />
160<br />
140<br />
120<br />
100<br />
80<br />
60<br />
40<br />
20<br />
0<br />
www.lincolninternational.com<br />
© 2008 <strong>Lincoln</strong> <strong>International</strong> LLC<br />
Q3 2008