Q3 2010 Deal Volume Comparison - Lincoln International
Q3 2010 Deal Volume Comparison - Lincoln International
Q3 2010 Deal Volume Comparison - Lincoln International

Create successful ePaper yourself
Turn your PDF publications into a flip-book with our unique Google optimized e-Paper software.
<strong>Q3</strong> <strong>2010</strong> <strong>Deal</strong> <strong>Volume</strong> <strong>Comparison</strong><br />
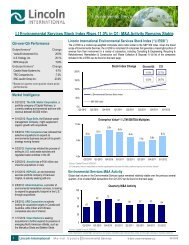
Chart A: Completed Solar Energy Transactions<br />
45<br />
40<br />
35<br />
30<br />
25<br />
20<br />
15<br />
10<br />
5<br />
0<br />
Q2-08 <strong>Q3</strong>-08 Q4-08 Q1-09 Q2-09 <strong>Q3</strong>-09 Q4-09 Q1-10 Q2-10 <strong>Q3</strong>-10<br />
Announcements<br />
GT Solar <strong>International</strong>, Inc.<br />
(NasdaqGS:SOLR) acquired Crystal<br />
Systems, Inc. (July-10)<br />
First Solar, Inc. (NasdaqGS:FSLR)<br />
acquired NextLight Renewable<br />
Power, LLC (July-10)<br />
MEMC Electronic Materials Inc.<br />
(NYSE:WFR) acquired Solaicx, Inc.<br />
(July-10)<br />
White Owl Capital AG acquired two<br />
solar plants in Spain totaling<br />
approximately 8MW (Aug./Sept.-10)<br />
Sources: All information contained in this<br />
newsletter including the charts was obtained<br />
from company websites, <strong>Lincoln</strong><br />
<strong>International</strong>’s internal data and Capital IQ.<br />
There were 38 completed solar energy transactions in<br />
<strong>Q3</strong> <strong>2010</strong> compared to 39 in Q2 <strong>2010</strong>. This number is<br />
the second highest number of transactions in a quarter<br />
since we began tracking M&A activity within solar<br />
energy. These statistics continue to show the increase<br />
of transactions within the solar industry since 2005, as<br />
the industry continues to grow. <strong>2010</strong> is on track to be<br />
another record year from a transaction perspective,<br />
largely driven by the continuing increase in<br />
consolidation transactions.<br />
Within the solar energy transactions, consolidation<br />
represented 58% of transactions, or 22 deals in <strong>Q3</strong><br />
<strong>2010</strong>. The next largest category was diversification<br />
into the solar energy industry by corporations and<br />
investors with six transactions, or 16% of transactions<br />
in <strong>Q3</strong> <strong>2010</strong>. Vertical integration and private equity/<br />
investors accounted for five transactions each in <strong>Q3</strong><br />
<strong>2010</strong>, or 13% of the quarterly total each.<br />
In <strong>Q3</strong> <strong>2010</strong>, 23 transactions (or 61%) came from<br />
Europe. The number of transactions from U.S./<br />
Canada in <strong>Q3</strong> <strong>2010</strong> was 10, or 26% of the total.<br />
Cross-border transactions accounted for three<br />
transactions, or 8% of the total for <strong>Q3</strong> <strong>2010</strong>, while Asia<br />
represented only two transactions (5% of the quarterly<br />
total).<br />
SOLAR ENERGY<br />
Chart B: Quarter <strong>Comparison</strong> — Solar Energy M&A by Category<br />
25<br />
Third Quarter <strong>2010</strong><br />
Q4-09 Q1-10 Q2-10 <strong>Q3</strong>-10<br />
Consolidation<br />
Vertical Integration<br />
Diversification into Solar Energy<br />
Diversification into Solar Energy<br />
Vertical Integration<br />
Private Equity/Investors<br />
In <strong>Q3</strong> <strong>2010</strong>, there were 16 acquisitions of companies<br />
categorized as solar energy producers, or 42% of the<br />
total transaction volume. This quarter had ten<br />
transactions for target companies categorized EPC<br />
integrators / developers, or 26%, while there were six<br />
transactions for cells / modules producers, or 16% of<br />
the total. There were three transactions of companies<br />
categorized as solar equipment providers and two<br />
transactions with companies categorized as wafer /<br />
ingot producers, or 8% and 5% of the total,<br />
respectively. Finally, there was one transaction with<br />
vertically integrated companies this quarter.<br />
The upward trend in transaction activity has continued<br />
through the nine months of the year with activity<br />
increasing particularly within the consolidation<br />
category. Consolidation activity reached historical<br />
levels with 22 transactions for the quarter. These<br />
consolidation phases that are often seen in rapidly<br />
growing young industries present unique opportunities<br />
for companies to potentially sell at premium values<br />
benefiting from the overall market momentum. In<br />
addition, many of the consolidations occurring in the<br />
industry are acquisitions of solar projects as<br />
companies continue to build their project portfolios<br />
worldwide.<br />
Chart C: <strong>Q3</strong> <strong>2010</strong> Solar Energy M&A by Geography Chart D: Mergers & Acquisition by Sector of Target Company — <strong>Q3</strong> <strong>2010</strong><br />
25<br />
20<br />
15<br />
10<br />
5<br />
0<br />
Q4-2009 Q1-<strong>2010</strong> Q2-<strong>2010</strong> <strong>Q3</strong>-<strong>2010</strong><br />
U.S./Canada Europe Asia Cross-Border<br />
1 <strong>Lincoln</strong> <strong>International</strong> DEALREADER SOLAR ENERGY www.lincolninternational.com Third Quarter <strong>2010</strong><br />
20<br />
15<br />
10<br />
5<br />
0<br />
25<br />
20<br />
15<br />
10<br />
5<br />
0<br />
Q4-09 Q1-10 Q2-10 <strong>Q3</strong>-10<br />
Equipment for Solar Industry Producers of Solar Energy<br />
Cells/Modules Vertically Integrated Companies<br />
EPC Integrators / Developers Wafers/Ingots
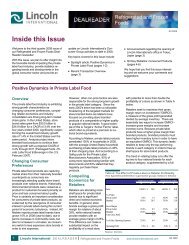
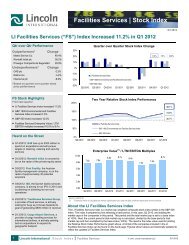
An Analysis of Growth Trends Affecting the Solar Energy Industry<br />
The Solar Energy industry had its highest<br />
revenue total in 2008, more than any year<br />
since we began tracking this data.<br />
However, 2009 was a difficult year for the<br />
35 solar energy companies tracked in<br />
<strong>Lincoln</strong>’s Solar Stock Index due to the<br />
global economic downturn. Year-over-year<br />
Chart E: Year-over-Year Revenue Growth by Category<br />
% Change<br />
-25%<br />
-50%<br />
0%<br />
150%<br />
125%<br />
100%<br />
75%<br />
50%<br />
25%<br />
Contact<br />
<strong>Lincoln</strong> <strong>International</strong>’s Renewable Energy Group is led by a former CEO of a public<br />
company. The firm’s Renewable Energy team provides transactional, financial and<br />
strategic advisory services to renewable energy companies and private equity<br />
groups with an interest in the renewable energy space.<br />
For more information, please contact:<br />
Jack Calderon, Managing Director<br />
(Chicago)<br />
jcalderon@lincolninternational.com<br />
Iván Marina, Managing Director<br />
(Madrid)<br />
i.marina@lincolninternational.es<br />
Eric Wijs, Managing Director<br />
(Amsterdam)<br />
e.wijs@lincolninternational.nl<br />
Hideyuki Fujisawa, Director (Tokyo)<br />
hfujisawa@lincolninternational.com<br />
Christoph Ulrich, Director (Frankfurt)<br />
c.ulrich@lincolninternational.de<br />
Géraud Estrangin, Director (Paris)<br />
g.estrangin@lincolninternational.fr<br />
Chaim Lubin, Associate (Chicago)<br />
clubin@lincolninternational.com<br />
revenue was down in all categories except<br />
vertically integrated companies, who<br />
showed a modest increase in sales in<br />
2009. On an LTM basis as of September<br />
<strong>2010</strong>, all categories produced a sales<br />
increase of over 35% compared to the<br />
same period a year ago. As shown in<br />
52%48% 39%39%<br />
2007 2008 2009 LTM <strong>2010</strong><br />
Wafers / Ingots Cells / Modules<br />
Vertically Integrated EPC Integrators / Developers<br />
Chart F: Global Annual PV Market Outlook, Policy-Driven Scenario<br />
MW<br />
35,000<br />
30,000<br />
25,000<br />
20,000<br />
15,000<br />
10,000<br />
5,000<br />
0<br />
15,515<br />
29,975<br />
24,595<br />
19,090<br />
15,405<br />
278 334 477<br />
6,090 7,203<br />
583 1,122 1,422 1,596 2,594<br />
2000<br />
2001<br />
2002<br />
2003<br />
2004<br />
2005<br />
2006<br />
2007<br />
2008<br />
2009<br />
<strong>2010</strong>F<br />
2011F<br />
2012F<br />
Chart G: Global Annual PV Installed by Region<br />
Annual PV Installed MW by Region Year-over-Year<br />
2008 2009 % Growth<br />
Spain 2,605 MW 69 MW -97.4%<br />
Germany 1,809 MW 3,806 MW 110.4%<br />
USA 342 MW 477 MW 39.5%<br />
Japan 230 MW 484 MW 110.4%<br />
Rest of Europe 646 MW 1,730 MW 167.8%<br />
Rest of World 458 MW 637 MW 39.1%<br />
Total 6,090 MW 7,203 MW<br />
Source: European Photovoltaic Industry Association, Global Market Outlook for Photovoltaics Until 2014<br />
2013F<br />
2014F<br />
About <strong>Lincoln</strong> <strong>International</strong><br />
<strong>Lincoln</strong> <strong>International</strong> specializes in merger and acquisition advisory services, private<br />
capital raising and restructuring advice on mid-market transactions. <strong>Lincoln</strong><br />
<strong>International</strong> also provides fairness opinions, valuations and pension advisory services<br />
on a wide range of transaction sizes. With ten offices in Asia, Europe and North<br />
America, and strategic partnerships with leading institutions in China and India, <strong>Lincoln</strong><br />
<strong>International</strong> has strong local knowledge and contacts in the key global economies. The<br />
organization provides clients with senior-level attention, in-depth industry expertise and<br />
integrated resources. By being focused and independent, <strong>Lincoln</strong> <strong>International</strong> serves<br />
its clients without conflicts of interest. More information about <strong>Lincoln</strong> <strong>International</strong> can<br />
be obtained at www.lincolninternational.com.<br />
<strong>Lincoln</strong> <strong>International</strong> LLC<br />
500 West Madison, Suite 3900<br />
Chicago, IL 60661<br />
(312) 580-8339<br />
© <strong>2010</strong> <strong>Lincoln</strong> <strong>International</strong> LLC<br />
Chart E, overall Solar Energy revenue<br />
during the last 12 months (LTM) has<br />
increased across all categories, perhaps<br />
not surprisingly in light of the recent overall<br />
market recovery. Wafers/Ingots providers’<br />
revenue increased 52.5% on an LTM<strong>2010</strong><br />
basis versus a decrease of 13.2% for the<br />
same period a year ago. Revenue<br />
increased for Cells/Modules manufacturers<br />
by 47.9% compared to a revenue decrease<br />
of 13.6% for the same period a year ago.<br />
Vertically integrated companies’ LTM<strong>2010</strong><br />
revenue increased by 38.5% versus an<br />
increase of 3.7% in LTM2009. The EPC<br />
Integrators/Developers’ revenue increased<br />
by 39.3% in LTM<strong>2010</strong>, this compares to a<br />
31.8% decline the same period a year ago.<br />
According to the European Photovoltaic<br />
Industry Association, growth in the PV<br />
industry is expected to exhibit a five year<br />
CAGR of 33.0% from 2009 to 2014. This<br />
assumes that countries continue to followup<br />
on existing and further introduce<br />
support mechanisms, namely Feed-in-<br />
Tariffs, in a large number of countries.<br />
Even under a moderate scenario, the<br />
CAGR is expected to be approximately<br />
13.8% for the same period.<br />
The largest installations during 2009 were<br />
in Germany with 3,806 MW, Italy with 711<br />
MW, Japan with 484 MW and the U.S. with<br />
477 MW. Due to the policy changes in<br />
Spain, installations in 2009 dropped<br />
sharply to only 69 MW, a 97.4% decrease<br />
for the year. Overall the top four markets<br />
had cumulative year-over-year growth in<br />
terms of annual installations of 101.5%,<br />
clearly highlighting the worldwide demand<br />
for additional solar PV.<br />
Contributors<br />
Cynthya Goulet, Associate: cgoulet@lincolninternational.com<br />
2 <strong>Lincoln</strong> <strong>International</strong> DEALREADER SOLAR ENERGY www.lincolninternational.com Third Quarter <strong>2010</strong>