Migration in the Russian Federation: A Country Profile 2008 - EU ...
Migration in the Russian Federation: A Country Profile 2008 - EU ...
Migration in the Russian Federation: A Country Profile 2008 - EU ...

Create successful ePaper yourself
Turn your PDF publications into a flip-book with our unique Google optimized e-Paper software.
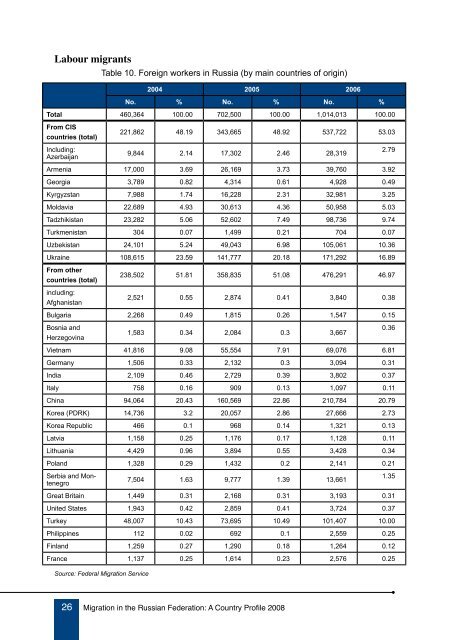
Labour migrants<br />
Table 10. Foreign workers <strong>in</strong> Russia (by ma<strong>in</strong> countries of orig<strong>in</strong>)<br />
2004 2005 2006<br />
no. % no. % no. %<br />
total 460,364 100.00 702,500 100.00 1,014,013 100.00<br />
from Cis<br />
countries (total)<br />
Includ<strong>in</strong>g:<br />
Azerbaijan<br />
221,862 48.19 343,665 48.92 537,722 53.03<br />
9,844 2.14 17,302 2.46 28,319<br />
Armenia 17,000 3.69 26,169 3.73 39,760 3.92<br />
Georgia 3,789 0.82 4,314 0.61 4,928 0.49<br />
Kyrgyzstan 7,988 1.74 16,228 2.31 32,981 3.25<br />
Moldavia 22,689 4.93 30,613 4.36 50,958 5.03<br />
Tadzhikistan 23,282 5.06 52,602 7.49 98,736 9.74<br />
Turkmenistan 304 0.07 1,499 0.21 704 0.07<br />
Uzbekistan 24,101 5.24 49,043 6.98 105,061 10.36<br />
Ukra<strong>in</strong>e 108,615 23.59 141,777 20.18 171,292 16.89<br />
from o<strong>the</strong>r<br />
countries (total)<br />
<strong>in</strong>clud<strong>in</strong>g:<br />
Afghanistan<br />
238,502 51.81 358,835 51.08 476,291 46.97<br />
2,521 0.55 2,874 0.41 3,840 0.38<br />
Bulgaria 2,268 0.49 1,815 0.26 1,547 0.15<br />
Bosnia and<br />
Herzegov<strong>in</strong>a<br />
1,583 0.34 2,084 0.3 3,667<br />
Vietnam 41,816 9.08 55,554 7.91 69,076 6.81<br />
Germany 1,506 0.33 2,132 0.3 3,094 0.31<br />
India 2,109 0.46 2,729 0.39 3,802 0.37<br />
Italy 758 0.16 909 0.13 1,097 0.11<br />
Ch<strong>in</strong>a 94,064 20.43 160,569 22.86 210,784 20.79<br />
Korea (PDRK) 14,736 3.2 20,057 2.86 27,666 2.73<br />
Korea Republic 466 0.1 968 0.14 1,321 0.13<br />
Latvia 1,158 0.25 1,176 0.17 1,128 0.11<br />
Lithuania 4,429 0.96 3,894 0.55 3,428 0.34<br />
Poland 1,328 0.29 1,432 0.2 2,141 0.21<br />
Serbia and Montenegro<br />
7,504 1.63 9,777 1.39 13,661<br />
Great Brita<strong>in</strong> 1,449 0.31 2,168 0.31 3,193 0.31<br />
United States 1,943 0.42 2,859 0.41 3,724 0.37<br />
Turkey 48,007 10.43 73,695 10.49 101,407 10.00<br />
Philipp<strong>in</strong>es 112 0.02 692 0.1 2,559 0.25<br />
F<strong>in</strong>land 1,259 0.27 1,290 0.18 1,264 0.12<br />
France 1,137 0.25 1,614 0.23 2,576 0.25<br />
Source: Federal <strong>Migration</strong> Service<br />
26 <strong>Migration</strong> <strong>in</strong> <strong>the</strong> <strong>Russian</strong> <strong>Federation</strong>: A <strong>Country</strong> <strong>Profile</strong> <strong>2008</strong><br />
2.79<br />
0.36<br />
1.35