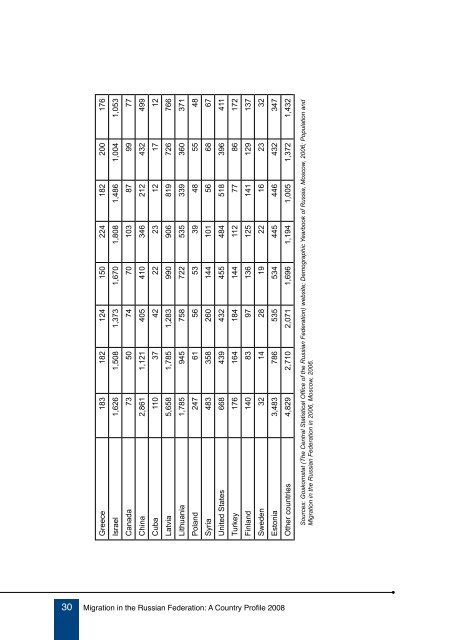
Greece 183 182 124 150 224 182 200 176 Israel 1,626 1,508 1,373 1,670 1,808 1,486 1,004 1,053 Canada 73 50 74 70 103 87 99 77 Ch<strong>in</strong>a 2,861 1,121 405 410 346 212 432 499 Cuba 110 37 42 22 23 12 17 12 Latvia 5,658 1,785 1,283 990 906 819 726 766 30 <strong>Migration</strong> <strong>in</strong> <strong>the</strong> <strong>Russian</strong> <strong>Federation</strong>: A <strong>Country</strong> <strong>Profile</strong> <strong>2008</strong> Lithuania 1,785 945 758 722 535 339 360 371 Poland 247 61 56 53 39 48 55 48 Syria 483 358 260 144 101 56 68 67 United States 668 439 432 455 484 518 396 411 Turkey 176 164 184 144 112 77 86 172 F<strong>in</strong>land 140 83 97 136 125 141 129 137 Sweden 32 14 28 19 22 16 23 32 Estonia 3,483 786 535 534 445 446 432 347 O<strong>the</strong>r countries 4,829 2,710 2,071 1,696 1,194 1,005 1,372 1,432 Sources: Goskomstat (The Central Statistical Office of <strong>the</strong> <strong>Russian</strong> <strong>Federation</strong>) website; Demographic Yearbook of Russia, Moscow, 2006; Population and <strong>Migration</strong> <strong>in</strong> <strong>the</strong> <strong>Russian</strong> <strong>Federation</strong> <strong>in</strong> 2006, Moscow, 2006.
A significant part of migrants mov<strong>in</strong>g for permanent (primary) residence to Russia are <strong>Russian</strong>s (ethnic <strong>Russian</strong>s from o<strong>the</strong>r regions of <strong>the</strong> Former Soviet Republic who are entitled to <strong>Russian</strong> citizenship) arriv<strong>in</strong>g from o<strong>the</strong>r CIS countries or who belong to ethnic m<strong>in</strong>orities of <strong>the</strong> <strong>Russian</strong> <strong>Federation</strong>. The majority of <strong>the</strong>m have <strong>Russian</strong> citizenship. The follow<strong>in</strong>g table describes <strong>the</strong> ethnic orig<strong>in</strong> of those immigrants. Table 14. Immigrants <strong>in</strong> Russia by ethnic orig<strong>in</strong> <strong>in</strong> 2002-2006 2002 2003 2004 2005 2006 Total 184,612 129,144 119,157 177,230 186,380 <strong>Russian</strong>s 99,683 66,076 65,831 92,576 82,647 Tatars 7,708 5,782 4,039 6,330 8,171 O<strong>the</strong>r nations and ethnic groups of <strong>the</strong> <strong>Russian</strong> <strong>Federation</strong> 5,567 3,768 3,382 3,763 4,068 Azerbaijanis 2,921 1,884 1,196 2,489 5,345 Armenians 7,491 5,757 3,547 7,157 11,358 Belarusians 2,819 1,833 1,820 2,544 2,028 Georgians 1,451 968 609 811 1,055 Kazakhs 1,946 1,304 1,452 2,022 1,862 Kirghiz 428 276 403 1,332 2,394 Moldovans 1,263 981 807 1,385 2,033 Tadjiks 1,481 1,004 639 1,305 2,550 Turkmen 218 311 219 231 285 Uzbeks 2,020 1,597 1,130 2,069 3,880 Ukra<strong>in</strong>ian 17,699 11,225 8,886 13,623 13,564 Koreans 1,577 1,295 985 2,162 2,870 Germans 2,523 1,913 2,342 2,974 2,438 O<strong>the</strong>r nationalities, liv<strong>in</strong>g ma<strong>in</strong>ly outside of <strong>the</strong> <strong>Russian</strong> <strong>Federation</strong> Nationalities have not been specified 4,077 2,986 2,148 3,565 3,546 23,740 20,184 19,767 30,892 36,286 Source: Population and migration <strong>in</strong> <strong>the</strong> <strong>Russian</strong> <strong>Federation</strong>. Moscow, <strong>the</strong> Rosstat, 2004-2006 <strong>Migration</strong> <strong>in</strong> <strong>the</strong> <strong>Russian</strong> <strong>Federation</strong>: A <strong>Country</strong> <strong>Profile</strong> <strong>2008</strong> 1
- Page 1 and 2: Migration in the Russian Federation
- Page 3: Migration in the Russian Federation
- Page 6 and 7: list of tables Table 1. Population
- Page 9: aCronYM list BSEC Organization of t
- Page 12 and 13: concept and has since implemented i
- Page 15 and 16: exeCutive suMMarY: general assessMe
- Page 17 and 18: publics in the same period was 6.8
- Page 19 and 20: 1. iMMigrants 1.1. Number of immigr
- Page 21 and 22: Table 2. Foreign citizens and state
- Page 23 and 24: Table 4. Residence permits issued i
- Page 25 and 26: Table 7. Refugees and forced resett
- Page 27 and 28: Table 9. Distribution of foreign wo
- Page 29 and 30: Table 11. Distribution of foreign w
- Page 31: Table 13. Immigration flows to the
- Page 35 and 36: 2. eMigrants 2.1. Total number of e
- Page 37 and 38: Labour migrants Suspended licenses
- Page 39 and 40: Marshall Islands 897 1,121 632 Neth
- Page 41 and 42: Table 26. Russian emigration by cou
- Page 43 and 44: 3. reMittanCes 3.1. Quantitative as
- Page 45 and 46: Destination country Table 30. Remit
- Page 47 and 48: Several factors have contributed to
- Page 49 and 50: 4. Migrant CoMMunities/Diasporas Wi
- Page 51 and 52: • Russian Center of the Internati
- Page 53 and 54: 26, Bolshaya Dmitrovka Street, 1034
- Page 55: 4.2. Migrant communities/diasporas
- Page 58 and 59: vious estimates of the Russian Mini
- Page 60 and 61: Outflows Based on the records of th
- Page 62 and 63: the former Yugoslav Republic of Mac
- Page 64 and 65: China-bound human trafficking is di
- Page 67 and 68: 6. assessMent anD analYsis of Migra
- Page 69 and 70: • Ministry of Interior 119049, Mo
- Page 71 and 72: • Agreement between the Republic
- Page 73 and 74: • Agreement between the Russian F
- Page 75 and 76: The Federal Migration Service, firs
- Page 77 and 78: • building up of conditions for v
- Page 79 and 80: wherein they are given the right to
- Page 81 and 82: Table 35. Average annual employment
- Page 83 and 84:
Table 37. Unemployment by age and e
- Page 85 and 86:
1998, the Agreement on cooperation
- Page 87 and 88:
The Law creates normative and legal
- Page 89 and 90:
The law enforcement authorities of
- Page 91 and 92:
Since July 1992, more than 1,623,00
- Page 93 and 94:
St. Petersburg Fontanka St. 21, 191
- Page 95 and 96:
Kazan- “Fatima” Contact person
- Page 97 and 98:
7. annex: soMe aDDitional Migration
- Page 99 and 100:
North-western Federal District the
- Page 101:
Annex Table 5. Immigrants at age 14