Migration in the Russian Federation: A Country Profile 2008 - EU ...
Migration in the Russian Federation: A Country Profile 2008 - EU ...
Migration in the Russian Federation: A Country Profile 2008 - EU ...

Create successful ePaper yourself
Turn your PDF publications into a flip-book with our unique Google optimized e-Paper software.
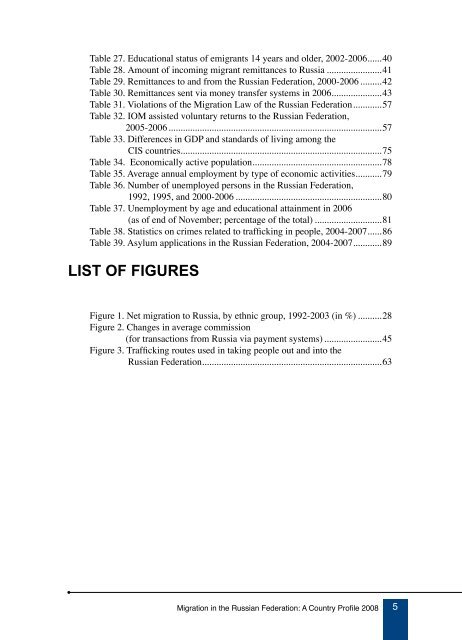
Table 27. Educational status of emigrants 14 years and older, 2002-2006 ......40<br />
Table 28..Amount of <strong>in</strong>com<strong>in</strong>g migrant remittances to Russia .......................41<br />
Table 29. Remittances to and from <strong>the</strong> <strong>Russian</strong> <strong>Federation</strong>, 2000-2006 .........42<br />
Table 30. Remittances sent via money transfer systems <strong>in</strong> 2006 .....................43<br />
Table 31. Violations of <strong>the</strong> <strong>Migration</strong> Law of <strong>the</strong> <strong>Russian</strong> <strong>Federation</strong> ............57<br />
Table 32. IOM assisted voluntary returns to <strong>the</strong> <strong>Russian</strong> <strong>Federation</strong>,<br />
2005-2006 .........................................................................................57<br />
Table 33. Differences <strong>in</strong> GDP and standards of liv<strong>in</strong>g among <strong>the</strong><br />
CIS countries ....................................................................................75<br />
Table 34. Economically active population ......................................................78<br />
Table 35. Average annual employment by type of economic activities ...........79<br />
Table 36. Number of unemployed persons <strong>in</strong> <strong>the</strong> <strong>Russian</strong> <strong>Federation</strong>,<br />
1992, 1995, and 2000-2006 .............................................................80<br />
Table 37. Unemployment by age and educational atta<strong>in</strong>ment <strong>in</strong> 2006<br />
(as of end of November; percentage of <strong>the</strong> total) ............................81<br />
Table 38. Statistics on crimes related to traffick<strong>in</strong>g <strong>in</strong> people, 2004-2007 ......86<br />
Table 39. Asylum applications <strong>in</strong> <strong>the</strong> <strong>Russian</strong> <strong>Federation</strong>, 2004-2007 ............89<br />
list of figures<br />
Figure 1. Net migration to Russia, by ethnic group, 1992-2003 (<strong>in</strong> %) ..........28<br />
Figure 2. Changes <strong>in</strong> average commission<br />
(for transactions from Russia via payment systems) ........................45<br />
Figure 3. Traffick<strong>in</strong>g routes used <strong>in</strong> tak<strong>in</strong>g people out and <strong>in</strong>to <strong>the</strong><br />
<strong>Russian</strong> <strong>Federation</strong> ...........................................................................63<br />
<strong>Migration</strong> <strong>in</strong> <strong>the</strong> <strong>Russian</strong> <strong>Federation</strong>: A <strong>Country</strong> <strong>Profile</strong> <strong>2008</strong>