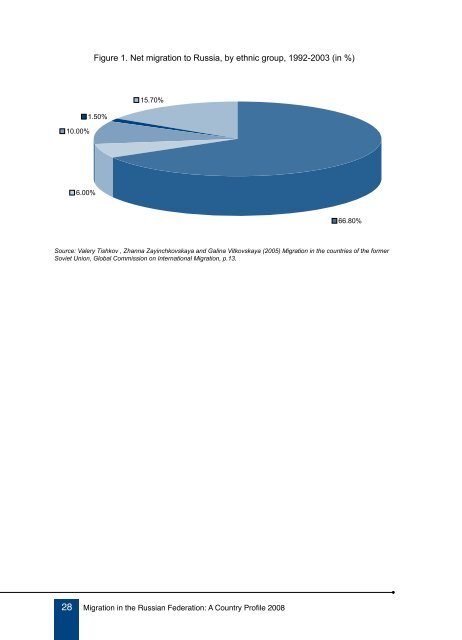
10.00% 6.00% Figure 1. Net migration to Russia, by ethnic group, 1992-2003 (<strong>in</strong> %) 1.50% 15.70% Source: Valery Tishkov , Zhanna Zay<strong>in</strong>chkovskaya and Gal<strong>in</strong>a Vitkovskaya (2005) <strong>Migration</strong> <strong>in</strong> <strong>the</strong> countries of <strong>the</strong> former Soviet Union, Global Commission on International <strong>Migration</strong>, p.13. 28 <strong>Migration</strong> <strong>in</strong> <strong>the</strong> <strong>Russian</strong> <strong>Federation</strong>: A <strong>Country</strong> <strong>Profile</strong> <strong>2008</strong> 66.80%
Table 13. Immigration flows to <strong>the</strong> <strong>Russian</strong> <strong>Federation</strong> by country of departure, 1997-2006 1997 2000 2001 2002 2003 2004 2005 2006 597,651 359,330 193,450 184,612 129,144 119,157 177,230 186,380 Arrivals to <strong>the</strong> <strong>Russian</strong> <strong>Federation</strong>, Total of which from: CIS countries 571,903 346,774 183,650 175,068 119,661 110,374 168,598 177,657 Azerbaijan 29,878 14,906 5,587 5,635 4,277 2,584 4,600 8,900 Armenia 19,123 15,951 5,814 6,802 5,124 3,057 7,581 12,949 Belarus 17,575 10,274 6,520 6,841 5,309 5,650 6,797 5,619 Georgia 24,517 20,213 9,674 7,128 5,540 4,886 5,497 6,806 Kazakhstan 235,903 124,903 65,226 55,706 29,552 40,150 51,945 38,606 Kyrgyzstan 13,752 15,536 10,740 13,139 6,948 9,511 15,592 15,669 Moldova 13,750 11,652 7,569 7,562 6,391 4,816 6,569 8,649 Tajikistan 23,053 11,043 6,742 5,967 5,346 3,339 4,717 6,523 Turkmenistan 16,501 6,738 4,402 4,531 6,299 3,734 4,104 4,089 Uzbekistan 39,620 40,810 24,873 24,951 21,457 14,948 30,436 37,126 Ukra<strong>in</strong>e 138,231 74,748 36,503 36,806 23,418 17,699 30,760 32,721 from non-CIS countries 25,748 12,556 9,800 9,544 9,483 8,783 8,632 8,723 Australia 57 27 25 22 30 42 30 28 Afghanistan 208 288 171 107 82 55 60 86 Bulgaria 750 245 255 238 212 125 118 109 Germany 2,379 1,753 1,627 1,962 2,692 3,117 3,025 2,900 <strong>Migration</strong> <strong>in</strong> <strong>the</strong> <strong>Russian</strong> <strong>Federation</strong>: A <strong>Country</strong> <strong>Profile</strong> <strong>2008</strong> 29
- Page 1 and 2: Migration in the Russian Federation
- Page 3: Migration in the Russian Federation
- Page 6 and 7: list of tables Table 1. Population
- Page 9: aCronYM list BSEC Organization of t
- Page 12 and 13: concept and has since implemented i
- Page 15 and 16: exeCutive suMMarY: general assessMe
- Page 17 and 18: publics in the same period was 6.8
- Page 19 and 20: 1. iMMigrants 1.1. Number of immigr
- Page 21 and 22: Table 2. Foreign citizens and state
- Page 23 and 24: Table 4. Residence permits issued i
- Page 25 and 26: Table 7. Refugees and forced resett
- Page 27 and 28: Table 9. Distribution of foreign wo
- Page 29: Table 11. Distribution of foreign w
- Page 33 and 34: A significant part of migrants movi
- Page 35 and 36: 2. eMigrants 2.1. Total number of e
- Page 37 and 38: Labour migrants Suspended licenses
- Page 39 and 40: Marshall Islands 897 1,121 632 Neth
- Page 41 and 42: Table 26. Russian emigration by cou
- Page 43 and 44: 3. reMittanCes 3.1. Quantitative as
- Page 45 and 46: Destination country Table 30. Remit
- Page 47 and 48: Several factors have contributed to
- Page 49 and 50: 4. Migrant CoMMunities/Diasporas Wi
- Page 51 and 52: • Russian Center of the Internati
- Page 53 and 54: 26, Bolshaya Dmitrovka Street, 1034
- Page 55: 4.2. Migrant communities/diasporas
- Page 58 and 59: vious estimates of the Russian Mini
- Page 60 and 61: Outflows Based on the records of th
- Page 62 and 63: the former Yugoslav Republic of Mac
- Page 64 and 65: China-bound human trafficking is di
- Page 67 and 68: 6. assessMent anD analYsis of Migra
- Page 69 and 70: • Ministry of Interior 119049, Mo
- Page 71 and 72: • Agreement between the Republic
- Page 73 and 74: • Agreement between the Russian F
- Page 75 and 76: The Federal Migration Service, firs
- Page 77 and 78: • building up of conditions for v
- Page 79 and 80: wherein they are given the right to
- Page 81 and 82:
Table 35. Average annual employment
- Page 83 and 84:
Table 37. Unemployment by age and e
- Page 85 and 86:
1998, the Agreement on cooperation
- Page 87 and 88:
The Law creates normative and legal
- Page 89 and 90:
The law enforcement authorities of
- Page 91 and 92:
Since July 1992, more than 1,623,00
- Page 93 and 94:
St. Petersburg Fontanka St. 21, 191
- Page 95 and 96:
Kazan- “Fatima” Contact person
- Page 97 and 98:
7. annex: soMe aDDitional Migration
- Page 99 and 100:
North-western Federal District the
- Page 101:
Annex Table 5. Immigrants at age 14