Molecular Devices Image Express Brochure_rev_B_LR.pdf
Molecular Devices Image Express Brochure_rev_B_LR.pdf
Molecular Devices Image Express Brochure_rev_B_LR.pdf

You also want an ePaper? Increase the reach of your titles
YUMPU automatically turns print PDFs into web optimized ePapers that Google loves.
A<br />
B<br />
C<br />
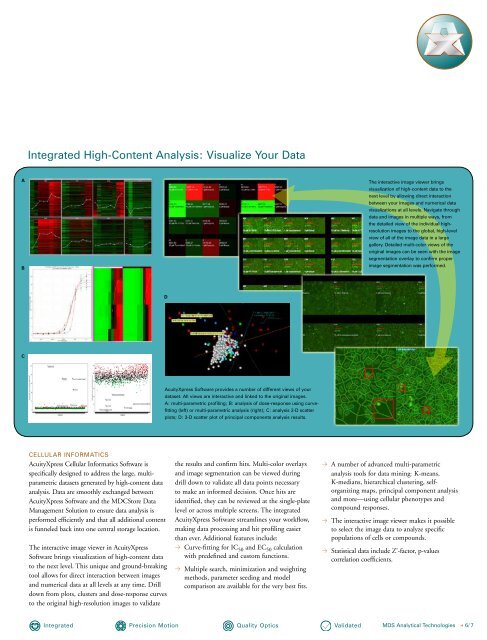
Integrated high-Content analysis: visualize Your Data<br />
CellUlaR InFoRmatICS<br />
AcuityXpress Cellular Informatics Software is<br />
specifically designed to address the large, multiparametric<br />
datasets generated by high-content data<br />
analysis. Data are smoothly exchanged between<br />
AcuityXpress Software and the MDCStore Data<br />
Corporate<br />
Corporate<br />
8222<br />
8222<br />
Management Solution to ensure data analysis is<br />
performed efficiently and that all additional content<br />
ephys<br />
ephys<br />
is funneled 8181 back into one central 8181 storage location.<br />
analyst<br />
analyst<br />
The 8243 interactive image viewer in 8243AcuityXpress<br />
Software brings visualization of high-content data<br />
to the Flex next level. This unique Flex and ground-breaking<br />
8303<br />
8303<br />
tool allows for direct interaction between images<br />
and FlIpR numerical data at all levels FlIpR at any time. Drill<br />
8303<br />
8303<br />
down from plots, clusters and dose-response curves<br />
to the original high-resolution images to validate<br />
lifeSci<br />
8142<br />
Imaging<br />
8263<br />
Integrated<br />
lifeSci<br />
8142<br />
Imaging<br />
8263<br />
D<br />
precision motion<br />
acuityXpress Software provides a number of different views of your<br />
dataset. all views are interactive and linked to the original images.<br />
a: multi-parametric profiling; B: analysis of dose-response using curvefitting<br />
(left) or multi-parametric analysis (right); C: analysis 2-D scatter<br />
plots; D: 3-D scatter plot of principal components analysis results.<br />
the results and confirm hits. Multi-color overlays<br />
and image segmentation can be viewed during<br />
drill down to validate all data points necessary<br />
to make an informed decision. Once hits are<br />
identified, they can be <strong>rev</strong>iewed at the single-plate<br />
Corporate<br />
8222<br />
level or across multiple screens. The integrated<br />
AcuityXpress Software streamlines your workflow,<br />
ephys<br />
making data processing and hit profiling easier 8181<br />
than ever. Additional features include:<br />
analyst<br />
> Curve-fitting for IC50 and EC50 calculation 8243<br />
with predefined and custom functions.<br />
Flex<br />
> Multiple search, minimization and weighting<br />
8303<br />
methods, parameter seeding and model<br />
comparison are available for the very best FlIpRfits.<br />
Quality optics<br />
8303<br />
lifeSci<br />
8142<br />
Imaging<br />
8263<br />
the interactive image viewer brings<br />
visualization of high-content data to the<br />
next level by allowing direct interaction<br />
between your images and numerical data<br />
visualizations at all levels. navigate through<br />
data and images in multiple ways, from<br />
the detailed view of the individual highresolution<br />
images to the global, high-level<br />
view of all of the image data in a large<br />
gallery. Detailed multi-color views of the<br />
original images can be seen with the image<br />
segmentation overlay to confirm proper<br />
image segmentation was performed.<br />
> A number of advanced multi-parametric<br />
analysis tools for data mining: K-means,<br />
K-medians, hierarchical clustering, selforganizing<br />
maps, principal component analysis<br />
and more—using cellular phenotypes and<br />
compound responses.<br />
> The interactive image viewer makes it possible<br />
to select the image data to analyze specific<br />
populations of cells or compounds.<br />
> Statistical data include Z'-factor, p-values<br />
correlation coefficients.<br />
validated<br />
mDS analytical technologies > 6/ 7