ptdist - Nanyang Technological University
ptdist - Nanyang Technological University
ptdist - Nanyang Technological University

Create successful ePaper yourself
Turn your PDF publications into a flip-book with our unique Google optimized e-Paper software.
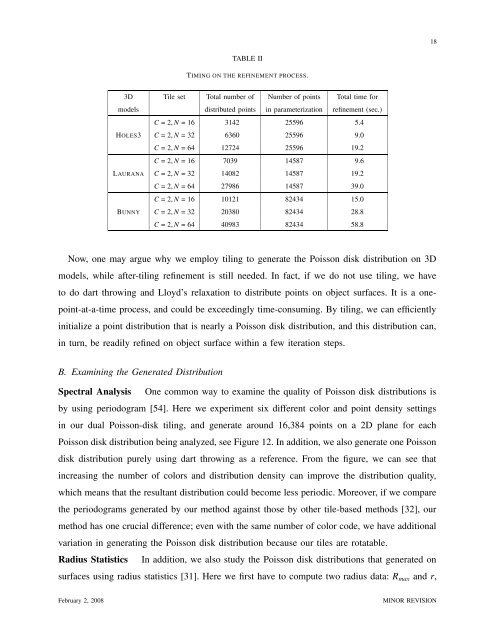
TABLE II<br />
TIMING ON THE REFINEMENT PROCESS.<br />
3D Tile set Total number of Number of points Total time for<br />
models distributed points in parameterization refinement (sec.)<br />
C = 2, N = 16 3142 25596 5.4<br />
HOLES3 C = 2, N = 32 6360 25596 9.0<br />
C = 2, N = 64 12724 25596 19.2<br />
C = 2, N = 16 7039 14587 9.6<br />
LAURANA C = 2, N = 32 14082 14587 19.2<br />
C = 2, N = 64 27986 14587 39.0<br />
C = 2, N = 16 10121 82434 15.0<br />
BUNNY C = 2, N = 32 20380 82434 28.8<br />
C = 2, N = 64 40983 82434 58.8<br />
Now, one may argue why we employ tiling to generate the Poisson disk distribution on 3D<br />
models, while after-tiling refinement is still needed. In fact, if we do not use tiling, we have<br />
to do dart throwing and Lloyd’s relaxation to distribute points on object surfaces. It is a one-<br />
point-at-a-time process, and could be exceedingly time-consuming. By tiling, we can efficiently<br />
initialize a point distribution that is nearly a Poisson disk distribution, and this distribution can,<br />
in turn, be readily refined on object surface within a few iteration steps.<br />
B. Examining the Generated Distribution<br />
Spectral Analysis One common way to examine the quality of Poisson disk distributions is<br />
by using periodogram [54]. Here we experiment six different color and point density settings<br />
in our dual Poisson-disk tiling, and generate around 16,384 points on a 2D plane for each<br />
Poisson disk distribution being analyzed, see Figure 12. In addition, we also generate one Poisson<br />
disk distribution purely using dart throwing as a reference. From the figure, we can see that<br />
increasing the number of colors and distribution density can improve the distribution quality,<br />
which means that the resultant distribution could become less periodic. Moreover, if we compare<br />
the periodograms generated by our method against those by other tile-based methods [32], our<br />
method has one crucial difference; even with the same number of color code, we have additional<br />
variation in generating the Poisson disk distribution because our tiles are rotatable.<br />
Radius Statistics In addition, we also study the Poisson disk distributions that generated on<br />
surfaces using radius statistics [31]. Here we first have to compute two radius data: Rmax and r,<br />
February 2, 2008 MINOR REVISION<br />
18