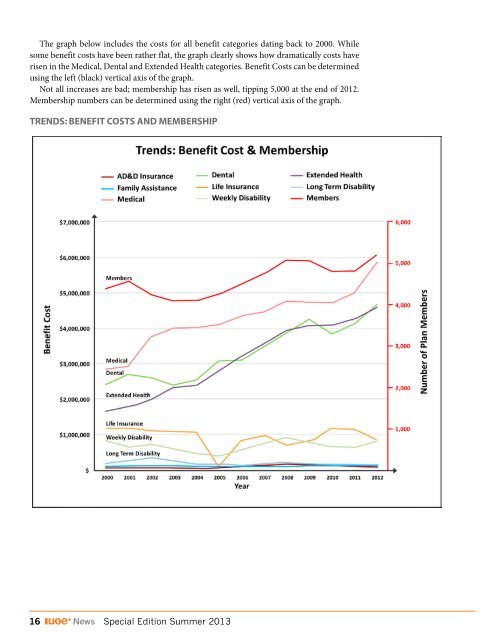
The graph below includes the costs for all benefit categories dating back to 2000. While some benefit costs have been rather flat, the graph clearly shows how dramatically costs have risen in the Medical, Dental and Extended Health categories. Benefit Costs can be determined using the left (black) vertical axis of the graph. Not all increases are bad; membership has risen as well, tipping 5,000 at the end of 2012. Membership numbers can be determined using the right (red) vertical axis of the graph. trenDs: Benefit cOsts anD memBershiP 16 <strong>News</strong> <strong>Special</strong> <strong>Edition</strong> Summer <strong>2013</strong>
aDministratiOn exPenses The following tables give a breakdown of administrative disbursements for the period commencing in 2000. OPerating engineers’ PensiOn Plan Year Ending Assets Contributions Expenses Expenses as a % of Assets Expenses as a % of Contributions Total Plan Participants Expenses per Plan Participant, per year April 30, 2000 $412,784,657 $18,644,501 $702,151 0.170% 3.77% 12,447 $56.41 April 30, 2001 $416,350,954 $22,790,835 $678,916 0.163% 2.98% 12,654 $53.65 April 30, 2002 $485,414,220 $17,144,904 $660,816 0.136% 3.85% 12,739 $51.87 April 30, 2003 $490,087,308 $17,889,602 $811,192 0.166% 4.53% 12,836 $63.20 April 30, 2004 $531,062,657 $18,511,783 $698,680 0.132% 3.77% 12,836 $54.43 April 30, 2005 $611,447,912 $21,344,139 $685,298 0.112% 3.21% 12,836 $53.39 April 30, 2006 $661,907,384 $26,948,233 $1,146,822 0.173% 4.26% 12,611 $90.94 April 30, 2007 $727,512,372 $28,377,553 $980,418 0.135% 3.45% 12,870 $76.18 April 30, 2008 $732,913,398 $31,418,564 $810,319 0.111% 2.58% 13,322 $60.83 April 30, 2009 $713,473,674 $30,060,633 $1,065,027 0.149% 3.54% 13,450 $79.18 April 30, 2010 $782,235,346 $26,235,516 $935,082 0.120% 3.56% 13,290 $70.36 April 30, 2011 $844,956,804 $28,509,186 $1,015,967 0.120% 3.56% 13,274 $76.54 April 30, 2012 $1,013,752,735 $35,479,577 $1,141,079 0.113% 3.22% 13,523 $84.38 OPerating engineers’ Benefits Plan Year Ending Assets Contributions Expenses Expenses as a % of Assets Expenses as a % of Contributions Total Plan Participants Expenses per Plan Participant, per year Dec. 31, 2000 $25,930,085 $10,619,468 $723,469 2.790% 6.81% 11,406 $63.43 Dec. 31, 2001 $24,181,086 $8,521,071 $722,317 2.987% 8.48% 11,118 $64.97 Dec. 31, 2002 $24,494,360 $9,462,127 $604,709 2.469% 6.39% 10,448 $57.88 Dec. 31, 2003 $24,853,971 $10,274,224 $523,110 2.105% 5.09% 10,108 $51.75 Dec. 31, 2004 $26,374,356 $11,389,921 $593,624 2.251% 5.21% 10,249 $57.92 Dec. 31, 2005 $29,643,824 $13,038,803 $711,203 2.399% 5.45% 10,712 $66.39 Dec. 31, 2006 $32,057,915 $13,664,782 $799,280 2.493% 5.85% 11,116 $71.90 Dec. 31, 2007 $32,345,223 $15,118,433 $847,359 2.620% 5.60% 11,719 $72.31 Dec. 31, 2008 $31,073,300 $15,569,742 $772,521 2.486% 4.96% 11,994 $64.41 Dec. 31, 2009 $34,303,853 $13,712,670 $810,404 2.362% 5.91% 11,660 $69.50 Dec. 31, 2010 $34,216,220 $13,377,710 $837,022 2.446% 6.26% 11,016 $75.98 Dec. 31, 2011 $36,414,701 $15,442,009 $980,032 2.691% 6.35% 11,943 $82.06 <strong>Special</strong> <strong>Edition</strong> Summer <strong>2013</strong> <strong>News</strong> 17