Bayesian Risk Aggregation: Correlation ... - ERM Symposium
Bayesian Risk Aggregation: Correlation ... - ERM Symposium
Bayesian Risk Aggregation: Correlation ... - ERM Symposium

Create successful ePaper yourself
Turn your PDF publications into a flip-book with our unique Google optimized e-Paper software.
0.1 0.2 0.3 0.4 0.5 0.6 0.7 0.8 0.9 1<br />
0 0.1 0.2 0.3 0.4 0.5 0.6 0.7 0.8 0.9<br />
<strong>Correlation</strong> MRCR<br />
0.1 0.2 0.3 0.4 0.5 0.6 0.7 0.8 0.9 1<br />
0 0.1 0.2 0.3 0.4 0.5 0.6 0.7 0.8 0.9<br />
<strong>Correlation</strong> MRBR<br />
0.1 0.2 0.3 0.4 0.5 0.6 0.7 0.8 0.9 1<br />
0 0.1 0.2 0.3 0.4 0.5 0.6 0.7 0.8 0.9<br />
<strong>Correlation</strong> CRBR<br />
0.1 0.2 0.3 0.4 0.5 0.6 0.7 0.8 0.9 1<br />
0 0.1 0.2 0.3 0.4 0.5 0.6 0.7 0.8 0.9<br />
<strong>Correlation</strong> MROR<br />
0.1 0.2 0.3 0.4 0.5 0.6 0.7 0.8 0.9 1<br />
0 0.1 0.2 0.3 0.4 0.5 0.6 0.7 0.8 0.9<br />
<strong>Correlation</strong> CROR<br />
0.1 0.2 0.3 0.4 0.5 0.6 0.7 0.8 0.9 1<br />
0 0.1 0.2 0.3 0.4 0.5 0.6 0.7 0.8 0.9<br />
<strong>Correlation</strong> ORBR<br />
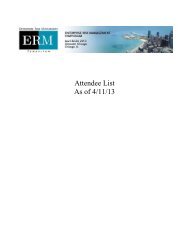
Figure 5: Histograms of the simulated marginal posterior distributions for the six pair correlations ri, i =<br />
1, . . . , 6, when the pairwise priors are triangular distributed according to Example 3.3. The solid graphs<br />
are the pairwise prior distributions and the dotted lines indicate the empirical correlations of (4.1).<br />
23