ESCONDIDO COMPREHENSIVE ECONOMIC ... - City of Escondido
ESCONDIDO COMPREHENSIVE ECONOMIC ... - City of Escondido
ESCONDIDO COMPREHENSIVE ECONOMIC ... - City of Escondido

You also want an ePaper? Increase the reach of your titles
YUMPU automatically turns print PDFs into web optimized ePapers that Google loves.
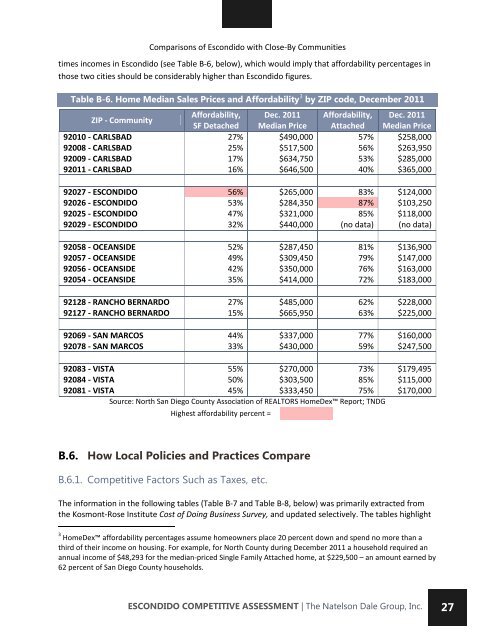
Comparisons <strong>of</strong> <strong>Escondido</strong> with Close-By Communities<br />
times incomes in <strong>Escondido</strong> (see Table B-6, below), which would imply that affordability percentages in<br />
those two cities should be considerably higher than <strong>Escondido</strong> figures.<br />
Table B-6. Home Median Sales Prices and Affordability 3 by ZIP code, December 2011<br />
ZIP - Community<br />
Affordability,<br />
SF Detached<br />
Dec. 2011<br />
Median Price<br />
Affordability,<br />
Attached<br />
Dec. 2011<br />
Median Price<br />
92010 - CARLSBAD 27% $490,000 57% $258,000<br />
92008 - CARLSBAD 25% $517,500 56% $263,950<br />
92009 - CARLSBAD 17% $634,750 53% $285,000<br />
92011 - CARLSBAD 16% $646,500 40% $365,000<br />
92027 - <strong>ESCONDIDO</strong> 56% $265,000 83% $124,000<br />
92026 - <strong>ESCONDIDO</strong> 53% $284,350 87% $103,250<br />
92025 - <strong>ESCONDIDO</strong> 47% $321,000 85% $118,000<br />
92029 - <strong>ESCONDIDO</strong> 32% $440,000 (no data) (no data)<br />
92058 - OCEANSIDE 52% $287,450 81% $136,900<br />
92057 - OCEANSIDE 49% $309,450 79% $147,000<br />
92056 - OCEANSIDE 42% $350,000 76% $163,000<br />
92054 - OCEANSIDE 35% $414,000 72% $183,000<br />
92128 - RANCHO BERNARDO 27% $485,000 62% $228,000<br />
92127 - RANCHO BERNARDO 15% $665,950 63% $225,000<br />
92069 - SAN MARCOS 44% $337,000 77% $160,000<br />
92078 - SAN MARCOS 33% $430,000 59% $247,500<br />
92083 - VISTA 55% $270,000 73% $179,495<br />
92084 - VISTA 50% $303,500 85% $115,000<br />
92081 - VISTA 45% $333,450 75% $170,000<br />
Source: North San Diego County Association <strong>of</strong> REALTORS HomeDex Report; TNDG<br />
Highest affordability percent =<br />
B.6. How Local Policies and Practices Compare<br />
B.6.1. Competitive Factors Such as Taxes, etc.<br />
The information in the following tables (Table B-7 and Table B-8, below) was primarily extracted from<br />
the Kosmont-Rose Institute Cost <strong>of</strong> Doing Business Survey, and updated selectively. The tables highlight<br />
3 HomeDex affordability percentages assume homeowners place 20 percent down and spend no more than a<br />
third <strong>of</strong> their income on housing. For example, for North County during December 2011 a household required an<br />
annual income <strong>of</strong> $48,293 for the median-priced Single Family Attached home, at $229,500 – an amount earned by<br />
62 percent <strong>of</strong> San Diego County households.<br />
<strong>ESCONDIDO</strong> COMPETITIVE ASSESSMENT | The Natelson Dale Group, Inc.<br />
27