Structural Investigation of Size Effects in Plasticity using Indentation ...
Structural Investigation of Size Effects in Plasticity using Indentation ...
Structural Investigation of Size Effects in Plasticity using Indentation ...

Create successful ePaper yourself
Turn your PDF publications into a flip-book with our unique Google optimized e-Paper software.
A Microstructural <strong>in</strong>vestigation <strong>of</strong> the volume beneath nano<strong>in</strong>dentations<br />
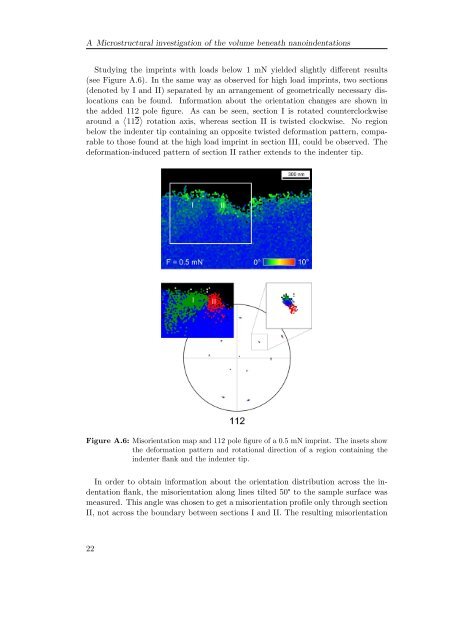
Study<strong>in</strong>g the impr<strong>in</strong>ts with loads below 1 mN yielded slightly different results<br />
(see Figure A.6). In the same way as observed for high load impr<strong>in</strong>ts, two sections<br />
(denoted by I and II) separated by an arrangement <strong>of</strong> geometrically necessary dislocations<br />
can be found. Information about the orientation changes are shown <strong>in</strong><br />
the added 112 pole figure. As can be seen, section I is rotated counterclockwise<br />
around a 112 rotation axis, whereas section II is twisted clockwise. No region<br />
below the <strong>in</strong>denter tip conta<strong>in</strong><strong>in</strong>g an opposite twisted deformation pattern, comparable<br />
to those found at the high load impr<strong>in</strong>t <strong>in</strong> section III, could be observed. The<br />
deformation-<strong>in</strong>duced pattern <strong>of</strong> section II rather extends to the <strong>in</strong>denter tip.<br />
Figure A.6: Misorientation map and 112 pole figure <strong>of</strong> a 0.5 mN impr<strong>in</strong>t. The <strong>in</strong>sets show<br />
the deformation pattern and rotational direction <strong>of</strong> a region conta<strong>in</strong><strong>in</strong>g the<br />
<strong>in</strong>denter flank and the <strong>in</strong>denter tip.<br />
In order to obta<strong>in</strong> <strong>in</strong>formation about the orientation distribution across the <strong>in</strong>dentation<br />
flank, the misorientation along l<strong>in</strong>es tilted 50 to the sample surface was<br />
measured. This angle was chosen to get a misorientation pr<strong>of</strong>ile only through section<br />
II, not across the boundary between sections I and II. The result<strong>in</strong>g misorientation<br />
22