Real Time On-Site Odor and VOC Emission Measurements Using a ...
Real Time On-Site Odor and VOC Emission Measurements Using a ...
Real Time On-Site Odor and VOC Emission Measurements Using a ...

You also want an ePaper? Increase the reach of your titles
YUMPU automatically turns print PDFs into web optimized ePapers that Google loves.
http://www.estcal.com/TechPapers/<strong>Site</strong><strong>Odor</strong><strong>Measurements</strong>.doc<br />
<strong>Real</strong> <strong>Time</strong> <strong>On</strong>-<strong>Site</strong> <strong>Odor</strong> <strong>and</strong> <strong>VOC</strong> <strong>Emission</strong><br />
<strong>Measurements</strong> <strong>Using</strong> a zNose<br />
Edward J. Staples, Electronic Sensor Technology, EST@ESTCAL.COM<br />
Remediation <strong>Site</strong> Description<br />
Remediation of contaminated soil from where coalfired<br />
power generators dating back to the mid-1800s once<br />
operated is a environmental priority for present day utility<br />
companies. Contaminated soil is excavated <strong>and</strong> removed to<br />
a remote location where hydrocarbons are removed <strong>and</strong> the<br />
clean soil returned for use as l<strong>and</strong>fill. As a result of on-site<br />
excavation, hydrocarbons from coal tars are released into<br />
the air. Some are toxic <strong>and</strong> their concentration is regulated<br />
by the US EPA while others are just perceived by humans<br />
as noxious odors. Because of the negative impact of these<br />
emissions on the surrounding community, site managers<br />
need to monitor <strong>and</strong> minimize the release of volatile organic<br />
compounds <strong>and</strong> odors.<br />
<strong>Odor</strong> Chemistry<br />
<strong>Odor</strong> chemistry can be estimated<br />
from an analysis of soil samples<br />
by an independent laboratory.<br />
The names <strong>and</strong> concentration of the<br />
individual compounds contaminating<br />
the soil are then known. Physical<br />
properties of each compound,<br />
such as molecular weight or boiling<br />
point provide an estimate of the<br />
odor chemical signature. For a site<br />
contaminated with coal tar, the<br />
major <strong>VOC</strong> is naphthalene which<br />
has an odor threshold of 27 ppbv.<br />
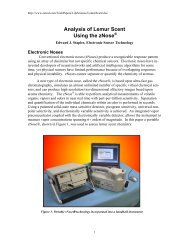
<strong>Odor</strong> Measurement Method<br />
A new type of portable electronic nose, called the<br />
zNose , can now perform on-site chemical measurements of<br />
<strong>VOC</strong> emissions <strong>and</strong> odors in near real time. This electronic<br />
nose separates <strong>and</strong> quantifies the hydrocarbon chemistry of<br />
odors in 10 seconds. <strong>Using</strong> a new solid-state detector, part<br />
per trillion sensitivity <strong>and</strong> universal selectivity is achieved.<br />
Performance of the technology has been validated by<br />
the US EPA’s Environmental Technology Verification (ETV)<br />
program. Quality control of odor measurement methods is the<br />
same as used in laboratory testing. The instrument also uses<br />
an optional GPS receiver allowing an odor measurement to be<br />
linked to a specific time <strong>and</strong> location. <strong>On</strong>-site <strong>and</strong> off-site<br />
measurements of <strong>VOC</strong> emissions <strong>and</strong> odors provides real-time<br />
1<br />
Figure 1- Excavation at remediation site involves<br />
removal of coal tar contaminated soil<br />
Figure 2- Laboratory analysis of contaminated soil provides a first<br />
order approximation of odor signature based upon molecular weight.<br />
Figure 3-Model 4100 zNose ultra-high<br />
speed gas chromatograph<br />
information to site managers <strong>and</strong> is a useful tool for monitoring <strong>and</strong> controlling the impact of such<br />
emissions on the surrounding community.
http://www.estcal.com/TechPapers/<strong>Site</strong><strong>Odor</strong><strong>Measurements</strong>.doc<br />
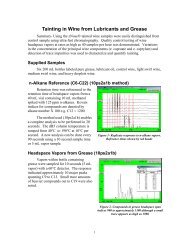
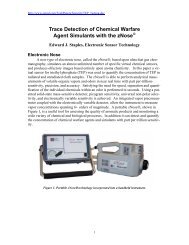
To characterize only the odors from the soil,<br />
a 10 gallon bucket was half filled with soil <strong>and</strong> covered<br />
with aluminum foil. After waiting 5 minutes,<br />
headspace vapors were sampled <strong>and</strong> measured. A<br />
side-ported GC needle was attached to the inlet of<br />
the zNose <strong>and</strong> inserted through the aluminum<br />
foil. <strong>On</strong>e milliliter of headspace vapor was removed<br />
in 2 seconds <strong>and</strong> the concentrations of the<br />
individual chemicals within the odor measured in<br />
10 seconds. Although 27 different compounds were<br />
separated, the major hydrocarbons <strong>and</strong> their concentrations<br />
were Benzene ( 9.5 ppm), Toluene (5.7<br />
ppm), m,p-Xylene (12.6 ppm), Naphthalene (17<br />
ppm) <strong>and</strong> methyl-naphthalene (2.5 ppm). Interference<br />
or background odors were not a problem due<br />
to the high concentration of <strong>VOC</strong>s in the soil headspace<br />
vapors.<br />
<strong>On</strong>-<strong>Site</strong> <strong>Odor</strong> <strong>Measurements</strong><br />
2<br />
Figure 4- Soil odors were tested in foil covered<br />
buckets. A characteristic odor signature for the site<br />
was obtained by measuring the headspace vapors.<br />
A patented solid-state detector directly measured odor intensity Vs elution time from a GC column<br />
which was temperature programmed from 40 o C to 200 o C at rates as high as 20 o C per second. Sensitivity<br />
was controlled by (1) the temperature of the detector <strong>and</strong> (2) the amount of the vapor sampled. The<br />
concentration of chemical vapors from contaminated soil in a closed environment was high <strong>and</strong> odors could<br />
easily be evaluated using only a 1-milliliter vapor sample <strong>and</strong> a relatively hot 80 o C detector. Background<br />
odors from ambient air was not a factor at these high odor concentrations.<br />
Figure 5- Linear odor intensity (radial<br />
direction) vs elution time from GC column<br />
(angle) with start <strong>and</strong> stop time at 12 o’clock<br />
position.<br />
Figure 6- Logarithmic odor intensity (radial<br />
direction- 100 to 1 span) vs elution time from GC<br />
column (angle) with start <strong>and</strong> stop time at 12<br />
o’clock position<br />
Olfactory images, called VaporPrints, are high-resolution 2-dimensional images based entirely<br />
upon the relative concentrations of the individual chemicals making up an odor. The image is a polar plot<br />
of the odor intensity (radial direction = sensor signal) <strong>and</strong> retention time (volatility). Complex odors can be<br />
recognized by their characteristic shapes based upon the odor’s unique chemistry.. In effect the olfactory<br />
image allows the olfactory response to be transferred to a visual response. Humans <strong>and</strong> computers are well<br />
suited to the analysis <strong>and</strong> recognition of visual patterns. In addition, computer processing of olfactory<br />
images allows for identification, quantification <strong>and</strong> comparison of individual chemicals within the odor.
http://www.estcal.com/TechPapers/<strong>Site</strong><strong>Odor</strong><strong>Measurements</strong>.doc<br />
<strong>Odor</strong> Chemistry<br />
The solid-state detector measures<br />
the concentration of the odor<br />
chemicals directly <strong>and</strong> retention<br />
times for each of the chemicals detected<br />
are determined by identifying<br />
peaks in the GC column flux. Column<br />
flux is computed in real time by<br />
mathematically performing the time<br />
derivative of the detector signal.<br />
The result is a chromatogram spanning<br />
10 seconds <strong>and</strong> representing the<br />
rate of adsorption <strong>and</strong> de-sorption of<br />
vapors onto the detector. The compounds<br />
are separated <strong>and</strong> identified<br />
by their unique retention times.<br />
Tabulating the retention times together<br />
with the individual <strong>and</strong> total<br />
concentration counts (cts) provides a<br />
quantitative measure of the chemicals<br />
within an odor.<br />
Automatic quantification <strong>and</strong><br />
tabulation of individual chemicals<br />
within an odor is achieved by defining<br />
alarm b<strong>and</strong>s centered on the individual<br />
retention times of each chemical peak.<br />
A narrow range in time is defined for<br />
each compound to be measured. Defining<br />
b<strong>and</strong>s <strong>and</strong> alarm levels for specific<br />
chemicals within an odor results<br />
in a virtual array of chemical sensors<br />
specific to that odor. <strong>Using</strong> alarm<br />
b<strong>and</strong>s, each peak is automatically<br />
Figure 8- Peak identification table<br />
listing identified compounds in RED<br />
together with their retention time <strong>and</strong><br />
concentration counts.<br />
Figure 7- The derivative of odor intensity is a chromatogram<br />
used to determine chemical retention times. <strong>Using</strong> a 10-second<br />
analysis of the soil odor, 27 different compounds, their<br />
individual intensity, <strong>and</strong> the total of all intensities is tabulated.<br />
Figure 9- Top trace shows alarm b<strong>and</strong>s (in RED) which are<br />
used to identify individual chemicals <strong>and</strong> compare their<br />
concentration (lower trace) to a user defined alarm level.<br />
identified, measured, <strong>and</strong> compared with a user defined alarm<br />
concentration level. Identified peaks are displayed in a peak list<br />
in RED together with their retention time <strong>and</strong> concentration<br />
counts.<br />
3
http://www.estcal.com/TechPapers/<strong>Site</strong><strong>Odor</strong><strong>Measurements</strong>.doc<br />
Naphthalene Calibration<br />
A known vapor concentration of target chemicals (st<strong>and</strong>ard vapor) is used to calibrate the detector<br />
response. Injecting a container of a known volume with a known amount of a volatile chemicals creates a<br />
st<strong>and</strong>ard vapor. Calibration response factors can be single point or multi-point <strong>and</strong> are linked to specific<br />
instrument sensitivity settings. Variable sensitivity is achieved by changing the vapor sample size<br />
(sampling time) or the temperature of the detector. <strong>Using</strong> a one milliliter vapor sample of naphthalene<br />
st<strong>and</strong>ard vapor, the response factor is 0.5 counts per ppbv with an 80 o C detector. Cooling the detector to<br />
20 o C increases the response factor to 7.5 cts/ppbv. Increasing the sample size to 15 milliliters gave a<br />
response factor of 300 cts/ppbv <strong>and</strong> a minimum detection level of 100 parts per trillion.<br />
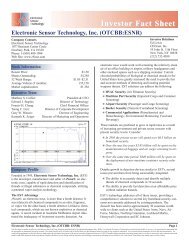
Figure 11- Calibrating with st<strong>and</strong>ard<br />
vapor concentration.<br />
N-Alkane Calibration<br />
Figure 10- Naphthalene sensitivity Vs detector temperature with a<br />
1-milliliter vapor sample.<br />
Often vapor st<strong>and</strong>ards for all chemicals at a site are not available. Many times too, the exact chemical<br />
name of a detected compound is unknown, yet it is still possible to identify the compound by indexing<br />
its retention time to that of a known<br />
chemical. Identification is most often<br />
done by indexing the unknown compound’s<br />
retention time to that of the nalkanes<br />
<strong>and</strong> then searching a library of<br />
indices for a match. An exp<strong>and</strong>able<br />
library of chemical smells <strong>and</strong> indices,<br />
called Kovats indices, is part of<br />
zNose software <strong>and</strong> is based upon the<br />
measured retention times from a n-alkane<br />
vapor st<strong>and</strong>ard. This is a convenient<br />
method of calibrating <strong>and</strong> tentatively<br />
identifying unknown odors in<br />
the field because it requires only one<br />
calibration st<strong>and</strong>ard for all compounds<br />
contained within the user library of<br />
smells <strong>and</strong> Kovats indices.<br />
Figure 12- System response to a vapor st<strong>and</strong>ard containing nalkane<br />
vapors C7 to C14. Indexed compound retention times<br />
relative to that of an n-alkane is called Kovats Indices.<br />
4
http://www.estcal.com/TechPapers/<strong>Site</strong><strong>Odor</strong><strong>Measurements</strong>.doc<br />
BTXX <strong>and</strong> BTEX Calibration<br />
Calibration vapor st<strong>and</strong>ards for benzene, toluene, ethylbenzene, <strong>and</strong> the m,p, <strong>and</strong> o-xylene were<br />
created by filling tedlar bags from gas canisters with certified concentrations of these compounds. <strong>On</strong>e<br />
st<strong>and</strong>ard vapor, BTEX, contained 1 ppm of benzene, toluene, ethylbenzene, <strong>and</strong> o-xylene. Another<br />
st<strong>and</strong>ard vapor (BTXX) contained 1 ppm benzene, toluene, <strong>and</strong> 1 ppm of each of the three xylenes.<br />
Figure 13- Tedlar bags make constant<br />
concentration vapor st<strong>and</strong>ards for<br />
calibration of the zNose.<br />
Figure 15- Response <strong>and</strong> alarm window settings<br />
for 1 ppm BTEX.<br />
Figure 16- Peak identification file for BTEX<br />
st<strong>and</strong>ard vapors. Retention times are listed as<br />
Kovats indices <strong>and</strong> response factors are per ppm.<br />
Figure 14- Exp<strong>and</strong>ed response to BTXX <strong>and</strong> BTX<br />
calibration vapors.<br />
Because m <strong>and</strong> p-xylene co-elute they cannot<br />
be separated easily from each other or from<br />
ethylbenzene. Two other compounds at this site,<br />
benzene <strong>and</strong> thiopene, also had identical retention<br />
times. However, because co-eluting compounds have<br />
similar response factors, total concentrations were<br />
measured <strong>and</strong> calibrated as total m- ,p-xylene.<br />
Software allows the user to graphically select alarm<br />
b<strong>and</strong>s, retention time, alarm levels or odor thresholds<br />
for selected chemicals within an odor. Peak<br />
identification <strong>and</strong> response factor data is stored in<br />
files containing all relevant calibration information<br />
for specific odors.<br />
Sensitivity to the BTXX <strong>and</strong> BTEX st<strong>and</strong>ard<br />
vapors was characterized by response factors in<br />
counts (cts) per ppm. For the lightest compound,<br />
benzene, the response factor was approximately 100<br />
cts/ppm using a 15 milliliter vapor sample (30<br />
second sample time) <strong>and</strong> a 20 o C detector. <strong>Using</strong><br />
replicate measurement methods, the minimum<br />
detection level was approximately 300 ppb.<br />
Lowering the detector temperature to 0 o C increased<br />
sensitivity <strong>and</strong> lowered the minimum detection level<br />
for benzene to 40 ppbv. Response factors were<br />
proportionally larger for higher molecular weight<br />
compounds such as 3000 Cts/ppm for o-Xylene <strong>and</strong><br />
30,000 cts/ppm for naphthalene. Retention times<br />
were expressed in seconds or as Kovats indices<br />
referenced to a file containing the system response to<br />
n-alkane vapors.<br />
5
http://www.estcal.com/TechPapers/<strong>Site</strong><strong>Odor</strong><strong>Measurements</strong>.doc<br />
Outside Air <strong>Measurements</strong><br />
<strong>Odor</strong>s <strong>and</strong> their intensity within <strong>and</strong> surrounding the remediation site were measured in real time at<br />
several locations. <strong>On</strong>e location, downwind from the site, was next to an entrance gate approximately 100<br />
feet from where active excavation was being carried out. Ambient air was sampled by placing the<br />
zNose on top of a 3 foot high concrete wall facing into the site.<br />
Figure 18- Downwind location (arrow) near active<br />
excavation of contaminated soil.<br />
Repetitive measurements of the site odors were taken every 80 seconds using a 30 second vapor<br />
preconcentration (15 milliliters) followed by a 10 second analysis time <strong>and</strong> 30 second recovery. Offset<br />
chromatograms in Figure 19 show a sequence of 10 analysis runs which began at approximately 9 am,<br />
shortly after active work on the site had started. Over a 50 minute period 35 measurements were taken.<br />
Figure 19- Consecutive measurements were taken every 80 seconds using a 30 second<br />
sample time, 10 second analysis, <strong>and</strong> 30 second recovery time. The prominent peak at<br />
5.7 seconds is naphthalene.<br />
6<br />
Figure 17- <strong>Real</strong> time monitoring of site odors<br />
located at street entrance (downwind).
http://www.estcal.com/TechPapers/<strong>Site</strong><strong>Odor</strong><strong>Measurements</strong>.doc<br />
Since site odor chemistry was dominated by<br />
naphthalene <strong>and</strong> methyl naphthalene these two compounds<br />
were used to monitor the odors being released<br />
from the site. Other, trace elements within the<br />
odor, are expected to vary in proportion to the concentration<br />
of these compounds.<br />
The intensity of site odors showed considerable<br />
short term variation in odor concentration <strong>and</strong><br />
in the warm afternoon concentrations were higher<br />
than during the cooler morning hours. During a one<br />
hour period in the morning the concentration of<br />
naphthalene varied from 15 to 10 ppbv with an<br />
average of 11.4 ppbv. The varability of the odor<br />
concentration was reflected in a st<strong>and</strong>ard deviation<br />
of 43% for 35 consecutive measurements. Since the<br />
odor threshold for naphthalene is 27 ppbv, morning<br />
odors at this time <strong>and</strong> location might be undetectable.<br />
<strong>Measurements</strong> taken at the same downwind<br />
location over a 10 minute period in the late afternoon<br />
indicated a substantial increase in the concentration<br />
of naphthalene odors. Following an upward trend,<br />
naphthalene concentrations as high as 60 ppbv, well<br />
above the odor threshold of 27 ppb, were measured.<br />
Ambient air within 10 feet of contaminated<br />
soil showed high odor concentration as expected.<br />
Soil piles arranged into open bins <strong>and</strong> awaiting<br />
treatment with chemical <strong>and</strong> biochemical odor<br />
reducing agents was tested over a 1 hour period in<br />
the late morning. Although the location was<br />
somewhat sheltered from winds, the concentration<br />
of naphthalene <strong>and</strong> methyl naphthalene still showed<br />
large short term variations <strong>and</strong> routinely exceeded<br />
the odor threshold.<br />
Figure 22- Ambient odors were measured near<br />
soil being treated to reduce odors.<br />
7<br />
Concentration (ppbv)<br />
Concentration (ppbv)<br />
Concentration (ppbv)<br />
40.0<br />
35.0<br />
30.0<br />
25.0<br />
20.0<br />
15.0<br />
10.0<br />
25.0<br />
20.0<br />
15.0<br />
10.0<br />
5.0<br />
0.0<br />
5.0<br />
0.0<br />
0 10 20 30 40 50<br />
70.0<br />
60.0<br />
50.0<br />
40.0<br />
30.0<br />
20.0<br />
10.0<br />
Naphthalene<br />
Methylnaphthalene<br />
Naphthalene<br />
0.0<br />
0.00 2.00 4.00 6.00 8.00 10.00<br />
<strong>Time</strong> (minutes-start 3:33 pm)<br />
Methylnaphthalene<br />
<strong>Time</strong> (minutes-start 8:27 AM)<br />
Figure 20- Concentration of Naphthalene <strong>and</strong><br />
Methyl Naphthalene at downwind location.<br />
Figure 21-Concentration of Naphthalene at<br />
downwind location in afternoon<br />
Naphthalene<br />
Methylnaphthalene<br />
0 10 20 30 40 50<br />
<strong>Time</strong> (minutes-start 9:25AM)<br />
Figure 23- Naphthalene odor concentration near soil bins.
http://www.estcal.com/TechPapers/<strong>Site</strong><strong>Odor</strong><strong>Measurements</strong>.doc<br />
Summary of Results<br />
A new type of electronic nose based upon ultra high-speed gas chromatography now allows the<br />
chemistry of odors to be qluantified in near real time with laboratory precision <strong>and</strong> accuracy. Over a 3 day<br />
period more than 800 odor measurements were performed at different locations in <strong>and</strong> around a soil<br />
remediation site contaminated with coal tar. A visual olfactory image based upon chemical measurements<br />
clearly indicated naphthalene was the dominant chemical compound in the site odor, although many other<br />
hydrocarbon elements were also present at lower concentrations. The sensitivity of the instrument<br />
allowed odor chemical concentrations at low ppt levels to be measured quickly <strong>and</strong> easily.<br />
Headspace vapors in foil-covered bucket samples of contaminated soil showed vapor concentrations<br />
at part per million levels. Chemical vapor concentrations of benzene (9.5 ppm ), toluene ( 5.7 ppm), m,p-<br />
Xylene ( 12.6 ppm ), naphthalene ( 17 ppm ), methyl naphthalene ( 2.5 ppm ), <strong>and</strong> numerous trace<br />
elements were measured <strong>and</strong> their relative concentrations defined the odor signature (VaporPrint) of the<br />
site.<br />
Ambient air vapor concentrations in close proximity to contaminated soil (less than 1 foot) were in<br />
the low 1-10 ppm concentration range. <strong>Odor</strong> concentrations at a downwind location next to the site<br />
(approximately 200 feet from active excavation) were in the 10 to 50 ppb range. Upwind odor<br />
concentrations were much lower, typically in the part per trillion range. Replicate odor samples (30<br />
second) taken at 80 second intervals showed considerable short term variability e.g. 43% st<strong>and</strong>ard deviation<br />
for 35 samples. Morning levels of naphthalene were slightly below odor threshold levels (27 ppbv) while<br />
afternoon levels were substantially higher , typically 60 ppbv downwind adjacent to the site.<br />
Because the electronic nose is based upon the science of gas chromatography, odor measurements<br />
can be easily confirmed <strong>and</strong> validated by independent laboratory measurements taken on quality control<br />
samples collected at the site. The ability to rapidly perform analytical measurements on-site in real time<br />
provides site managers with a cost effective new tool for monitoring volatile organic compounds <strong>and</strong><br />
minimizing the impact of site odors on the surrounding community.<br />
8