Detection of Dioxin/Furan Isomers in Flyash - Electronic Sensor ...
Detection of Dioxin/Furan Isomers in Flyash - Electronic Sensor ...
Detection of Dioxin/Furan Isomers in Flyash - Electronic Sensor ...

Create successful ePaper yourself
Turn your PDF publications into a flip-book with our unique Google optimized e-Paper software.
<strong>Electronic</strong> <strong>Sensor</strong> Technology GC/SAW Performance<br />
Evaluation Report<br />
For<br />
<strong>Detection</strong> <strong>of</strong> <strong>Diox<strong>in</strong></strong>/<strong>Furan</strong> <strong>Isomers</strong> <strong>in</strong> <strong>Flyash</strong><br />
Prepared for:<br />
A Japanese Company<br />
December 12, 1998
<strong>Detection</strong> <strong>of</strong> <strong>Diox<strong>in</strong></strong>/<strong>Furan</strong> <strong>Isomers</strong> <strong>in</strong> <strong>Flyash</strong><br />
Report Summary<br />
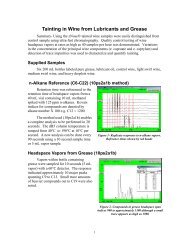
There is a worldwide need to measure diox<strong>in</strong>/furans <strong>in</strong> real or near real time <strong>in</strong><br />
flyash matrices from <strong>in</strong>c<strong>in</strong>erators to meet the Environmental Standards. This report describes<br />
the performance <strong>of</strong> a fast GC/SAW measurement system, which was successfully<br />
used to analyze flyash samples supplied by A Japanese Company. Although a GC by<br />
itself cannot positively identify diox<strong>in</strong>s/furans, it can provide a near real time field measurement<br />
and is a cost effective screen<strong>in</strong>g tool which can m<strong>in</strong>imize expensive laboratory<br />
GC/MS test<strong>in</strong>g.<br />
A simple field extraction method, calibration procedure, and the <strong>in</strong>strument’s associated<br />
m<strong>in</strong>imum detection level (10 picograms) were determ<strong>in</strong>ed before extracts from<br />
flyash samples were tested. The total flyash diox<strong>in</strong>/furan concentration was typically<br />
100-1000 nanograms/gram <strong>of</strong> flyash. The Japanese Company laboratory test results were<br />
compared with prelim<strong>in</strong>ary GC/SAW f<strong>in</strong>d<strong>in</strong>gs and recovery and accuracy evaluated. In<br />
general, the recovery achieved with the simple field extraction was with<strong>in</strong> 50% <strong>of</strong> that <strong>of</strong><br />
laboratory results. Quantification <strong>of</strong> <strong>in</strong>dividual isomer concentrations was done at several<br />
screen<strong>in</strong>g speeds. Although screen<strong>in</strong>g times as short as 10 seconds gave acceptable levels<br />
<strong>of</strong> detection, longer analysis times <strong>of</strong> 20 seconds or even 150 seconds gave improved<br />
peak separation.<br />
Because the field extraction did not utilize acid wash<strong>in</strong>g or filter<strong>in</strong>g there was a<br />
substantial background level <strong>of</strong> compounds which might <strong>in</strong>terfere and cause false alarms<br />
at low levels. Recommendations for future work <strong>in</strong>clude detailed analysis <strong>of</strong> recovery,<br />
method detection limits, and filter<strong>in</strong>g us<strong>in</strong>g solid phase micro-extraction.<br />
Edward J. Staples, Ph.D.<br />
Manag<strong>in</strong>g Director<br />
<strong>Electronic</strong> <strong>Sensor</strong> Technology<br />
2
Performance Evaluation Report:<br />
<strong>Detection</strong> <strong>of</strong> <strong>Diox<strong>in</strong></strong>/<strong>Furan</strong> <strong>Isomers</strong> <strong>in</strong> <strong>Flyash</strong><br />
Edward J. Staples, Ph.D.<br />
<strong>Electronic</strong> <strong>Sensor</strong> Technology<br />
Email: <br />
December 12, 1998<br />
Purpose and Scope:<br />
A Japanese Company has identified the need to measure diox<strong>in</strong>/furans <strong>in</strong> real or<br />
near real time <strong>in</strong> flyash matrices from <strong>in</strong>c<strong>in</strong>erators to meet the Environmental Agency’s<br />
(EA) Standards. As part <strong>of</strong> a prelim<strong>in</strong>ary evaluation <strong>of</strong> promis<strong>in</strong>g technologies such as<br />
fast chromatography flyash samples were sent to <strong>Electronic</strong> <strong>Sensor</strong> Technology for<br />
evaluation us<strong>in</strong>g a GC/SAW. This report <strong>in</strong>cludes a description <strong>of</strong> the GC/SAW measurement<br />
system, sample analysis procedures, calibration procedures, values obta<strong>in</strong>ed and<br />
m<strong>in</strong>imum detection levels.<br />
Evaluation Protocol:<br />
The flyash samples conta<strong>in</strong>ed unknown concentrations <strong>of</strong> diox<strong>in</strong>s and furans.<br />
<strong>Flyash</strong> samples were first extracted us<strong>in</strong>g a solvent mixture <strong>of</strong> hexane and methanol. After<br />
centrifug<strong>in</strong>g to separate solids samples <strong>of</strong> the hexane were extracted <strong>in</strong>to vials.<br />
Evaluation was performed by <strong>in</strong>ject<strong>in</strong>g microliter quantities <strong>of</strong> the sample extract <strong>in</strong>to an<br />
open-tubular desorber attached to the <strong>in</strong>let <strong>of</strong> a GC/SAW vapor analyzer. For each sample<br />
the concentration <strong>of</strong> <strong>in</strong>dividual diox<strong>in</strong>s and furans were recorded and referenced to<br />
calibration standards <strong>of</strong> similar concentration.<br />
3
The basic steps <strong>of</strong> the extraction procedure are shown <strong>in</strong> the follow<strong>in</strong>g pictures. It<br />
should be noted that no special attempt was made to perform any type <strong>of</strong> clean up<br />
procedures such as acid wash<strong>in</strong>g or silica column filter<strong>in</strong>g <strong>in</strong> this prelim<strong>in</strong>ary evaluation.<br />
Step 1- Weigh vial conta<strong>in</strong><strong>in</strong>g<br />
1 mL methanol<br />
and 0.5 mL hexane.<br />
Step 4- re-weigh vial.<br />
Subtract previous solvent<br />
weight to obta<strong>in</strong><br />
weight <strong>of</strong> flyash added.<br />
Step 2- add approximately<br />
1 gram <strong>of</strong> flyash<br />
to vial.<br />
Step 5- Centrifuge for 2<br />
m<strong>in</strong>utes at 5000 rpm.<br />
4<br />
Step 3- Shake for 1 m<strong>in</strong>ute.<br />
Step 6- Pipette extraction<br />
sample from top<br />
layer <strong>of</strong> hexane <strong>in</strong> vial.<br />
Figure 1- Steps used <strong>in</strong> solvent extraction <strong>of</strong> flyash samples.
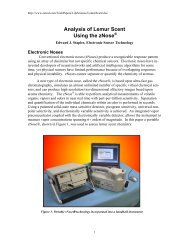
Description <strong>of</strong> GC/SAW Technology<br />
<strong>Electronic</strong> <strong>Sensor</strong> Technology currently manufactures fast chromatographs <strong>in</strong> two<br />
different models. Both models use surface acoustic wave (SAW) <strong>in</strong>tegrat<strong>in</strong>g detectors.<br />
One system, the model 4100, features a handheld GC and sampl<strong>in</strong>g preconcentrator attached<br />
to a support case by means <strong>of</strong> a 6 foot umbilical cable. The second, a model 7100,<br />
is designed for laboratory or portable use and the chromatograph and vapor preconcentrator<br />
are <strong>in</strong>tegrated <strong>in</strong>to a benchtop case. Both systems <strong>in</strong>terface with a Pentium laptop<br />
runn<strong>in</strong>g proprietary control s<strong>of</strong>tware us<strong>in</strong>g an RS232 connection. A full range <strong>of</strong> post<br />
process<strong>in</strong>g analysis and communications s<strong>of</strong>tware is provided by l<strong>in</strong>ks to features <strong>in</strong>herent<br />
<strong>in</strong> W<strong>in</strong>dows 95 and Micros<strong>of</strong>t Office.<br />
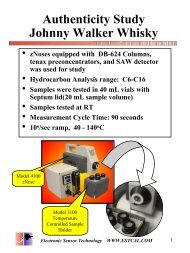
Figure 3- Benchtop Model 7100<br />
GC/SAW Vapor Analyzer.<br />
These <strong>in</strong>struments can be configured to quickly analyze a wide range <strong>of</strong> volatile<br />
and semi-volatile compounds us<strong>in</strong>g the patented <strong>in</strong>tegrat<strong>in</strong>g SAW detector. Us<strong>in</strong>g a temperature<br />
ramped DB-5 column the GC/SAW typically can speciate and quantify diox<strong>in</strong>s<br />
and furans at the picogram level with<strong>in</strong> a 10 second chromatogram. For the evaluation <strong>of</strong><br />
the Japanese Company samples a 4100 system was used together with a model 3100<br />
open-tubular desorber attached to the <strong>in</strong>let <strong>of</strong> the system This accessory thermally vaporizes<br />
liquid <strong>in</strong>jections and these vapors are then sampled by the GC/SAW measurement<br />
system.<br />
Figure 4- block diagram <strong>of</strong> GC/SAW vapor measurement system.<br />
5<br />
Figure 2- Handheld Model 4100<br />
GC/SAW vapor Analyzer.
Sample Preparation and Injection<br />
Standard calibration solutions were used and two additional dilutions were carried<br />
out <strong>in</strong> hexane. A 50 to 1 dilution was prepared by <strong>in</strong>ject<strong>in</strong>g 20 µliters <strong>of</strong> stock solution<br />
<strong>in</strong>to 1 milliliter <strong>of</strong> hexane. A 1000 to 1 dilution was prepared by <strong>in</strong>ject<strong>in</strong>g 1 µliter <strong>of</strong><br />
stock <strong>in</strong>to 1 milliliter <strong>of</strong> hexane.<br />
Figure 5- Attachment <strong>of</strong> Open-Tubular sample desorber attached <strong>in</strong> <strong>in</strong>let <strong>of</strong><br />
GC/SAW Vapor Analyzer.<br />
All samples extracts and calibration standards were <strong>in</strong>jected us<strong>in</strong>g a 10 µliter glass<br />
syr<strong>in</strong>ge. The sample <strong>in</strong>jection and measurement was carried out <strong>in</strong> two steps:<br />
Step 1 - 1-10 µliters <strong>of</strong> sample is <strong>in</strong>jected <strong>in</strong>to middle <strong>of</strong> glass wool wick with<strong>in</strong> a<br />
six <strong>in</strong>ch long desorbtion tube attached to the <strong>in</strong>let <strong>of</strong> the GC/SAW vapor analyzer.<br />
Step 2- A desorbtion tube heater (280 o C) is placed over the glass desorbtion tube<br />
and vapor sampl<strong>in</strong>g (measurement cycle) by the GC/SAW is <strong>in</strong>itiated by the operator.<br />
The rema<strong>in</strong>der <strong>of</strong> the measurement process was automatic and required no further<br />
operator actions other than to annotate notes which identified the actions be<strong>in</strong>g taken or<br />
other relevant sample identification <strong>in</strong>formation.<br />
6
Calibration Standards<br />
Two calibration standards were purchased from AccuStandard Inc. (25 Science<br />
Park, New Haven CT 06511). Each kit conta<strong>in</strong>ed five diox<strong>in</strong>s (M8280A) and five furans<br />
(M8280B) as required by EPA 8280 Method. The concentration <strong>of</strong> each analyte<br />
with<strong>in</strong> the mixture was 5.0 nanograms per µliter <strong>of</strong> toluene. A 10-to-1 dilution was used<br />
as a calibration level <strong>of</strong> 0.5 ng/µliter. The follow<strong>in</strong>g table provides the full analyte<br />
specifications as well as their TEQ rat<strong>in</strong>g.<br />
Analyte CAS No. TEQ*<br />
2,3,7,8-tetrachlorodibenzo-p-diox<strong>in</strong> 51207-31-9 1.00<br />
1,2,3,7,8-Pentachlorodibenzo-p-diox<strong>in</strong> 40321-76-4 0.50<br />
1,2,3,4,7,8-Hexachlorodibenzo-p-diox<strong>in</strong> 39227-28-6 0.10<br />
1,2,3,4,6,7,8-Heptachlorodibenzo-p-diox<strong>in</strong> 35822-46-9 0.01<br />
Octachlorodibenzodiox<strong>in</strong> 3268-87-9 0.001<br />
2,3,7,8-Tetrachlorodibenz<strong>of</strong>uran 1746-01-6 0.1<br />
1,2,3,7,8-Pentachlorodibenz<strong>of</strong>uran 40321-76-4 0.05<br />
1,2,3,4,7,8-Hexachlorodibenz<strong>of</strong>uran 55684-94-1 0.10<br />
1,2,3,4,6,7,8-Heptachlorodibenz<strong>of</strong>uran 35822-46-9 0.01<br />
Octachlorodibenz<strong>of</strong>uran 39001-01-0 0.001<br />
Figure 6- Analyte Standards Used <strong>in</strong> Sample Evaluation.<br />
No other standards were available for comparison with the Japanese Company<br />
samples. Hence <strong>in</strong> this study any quantification <strong>of</strong> isomers lower than tetra is based upon<br />
an estimated response factor and not upon a calibration standard.<br />
7
Selection <strong>of</strong> GC Method<br />
The GC/SAW vapor analyzer is capable <strong>of</strong> perform<strong>in</strong>g diox<strong>in</strong> analysis and quantification<br />
with<strong>in</strong> a 10 second chromatogram as well as at slower speeds such as 20, 50, or<br />
more seconds. There is a trade-<strong>of</strong>f <strong>in</strong> resolv<strong>in</strong>g power with better resolution be<strong>in</strong>g<br />
achieved at slower and longer chromatograms as shown <strong>in</strong> Figure 5.<br />
Figure 6- Resolution vs speed displayed for 18 o C/sec, 7 o C/sec, and<br />
3 o C/sec column ramp<strong>in</strong>g rates.<br />
For quantification <strong>of</strong> the Japanese Company sample, a 20 second chromatogram<br />
was achieved with a l<strong>in</strong>ear <strong>in</strong>crease <strong>of</strong> column temperature from 60 o C to 200 o C with<strong>in</strong> 20<br />
seconds. The complete GC method was constructed us<strong>in</strong>g a graphical method as shown<br />
<strong>in</strong> Figure 6. The GC method steps are created by dragg<strong>in</strong>g placeholders from the vertical<br />
8<br />
10 Seconds<br />
20 Seconds<br />
50 Seconds
toolbar <strong>in</strong>to a horizontal l<strong>in</strong>e at the bottom <strong>of</strong> the dialog screen <strong>of</strong> Figure 6. Each placeholder<br />
corresponds to a step or action with parameters set by the operator. This method<br />
beg<strong>in</strong>s with a 30 second sample (preconcentrate) time, move valve to <strong>in</strong>ject position,<br />
<strong>in</strong>ject sample, ramp<strong>in</strong>g <strong>of</strong> the column temperature, and tak<strong>in</strong>g <strong>of</strong> data for 20 seconds<br />
follow<strong>in</strong>g the <strong>in</strong>jection. At the end <strong>of</strong> the method is a 15 second bake cycle to ‘clean’ the<br />
crystal detector is activated and the column temperature is returned to 60 o C..<br />
Figure 7- GC Method dialog screen show<strong>in</strong>g method used to evaluate MSE samples.<br />
Analysis Time Requirements<br />
In automatic mode each analysis must conta<strong>in</strong> the follow<strong>in</strong>g basic steps with their<br />
m<strong>in</strong>imum values. The values used for the Japanese Company samples is shown for<br />
9<br />
M<strong>in</strong>imum<br />
(Sec)<br />
BHK Sample<br />
(Sec)<br />
Inject Sample <strong>in</strong>to Desorber 2 5<br />
Preconcentrate Vapor Sample 15 30<br />
GC Analyze 10 20<br />
Recovery <strong>of</strong> Column & Detector 15 30<br />
Total Cycle Time 42 85
comparison.<br />
10
Calibration Procedures<br />
Calibration <strong>of</strong> the <strong>in</strong>strument <strong>in</strong>volved <strong>in</strong>jection <strong>of</strong> standards <strong>of</strong> known concentration.<br />
Division <strong>of</strong> SAW detector ‘counts’ by the concentration produced a response factor<br />
specific to each analyte. The response factor (Hz/pg) , peak name, retention time, and<br />
Figure 9- Operator entry <strong>of</strong> retention time w<strong>in</strong>dows, peak labels, and<br />
response factors completes system s<strong>of</strong>tware calibration.<br />
percentage variation allowed <strong>in</strong> retention time (Percent spread) were entered <strong>in</strong>to a calibration<br />
table and this completed calibration (S<strong>in</strong>gle po<strong>in</strong>t). Multiple po<strong>in</strong>t calibration and<br />
<strong>in</strong>terpolation were also available features with<strong>in</strong> the s<strong>of</strong>tware. Proper calibration was<br />
rout<strong>in</strong>ely checked by <strong>in</strong>ject<strong>in</strong>g furan or diox<strong>in</strong> mixtures <strong>of</strong> known concentration.<br />
Figure 8- Chromatogram <strong>of</strong> furan standards after entry <strong>of</strong> proper<br />
response factors and retention times <strong>in</strong>to peak identification file.<br />
11
M<strong>in</strong>imum <strong>Detection</strong> Limit<br />
<strong>Detection</strong> limits for <strong>in</strong>struments the GC/SAW is determ<strong>in</strong>ed by signal to noise and<br />
the noise or detected peak amplitudes obta<strong>in</strong>ed with a blank <strong>in</strong>jection <strong>of</strong> pure hexane <strong>in</strong>to<br />
the GC/SAW are specified to be less than 1 picogram. Operat<strong>in</strong>g the system at a signal to<br />
noise ratio <strong>of</strong> 3 would then give a 3 picogram m<strong>in</strong>imum detection level while operat<strong>in</strong>g at<br />
a higher signal-to-noise ratio <strong>of</strong> 10 would give a m<strong>in</strong>imum detection level <strong>of</strong> 10 picograms.<br />
Figure 9- Blank <strong>in</strong>jection chromatogram <strong>of</strong> 10 uliters <strong>of</strong> hexane compared with 2<br />
uliter diox<strong>in</strong> standard (0.5 ng/uliter).<br />
EPA Method detection limits were evaluated by multiplication <strong>of</strong> the standard deviation<br />
<strong>of</strong> seven replicate measurements by 3.14. Method detection limits varied between<br />
10 and 30 picograms us<strong>in</strong>g this method with 10 picogram <strong>in</strong>jections. RSD values for<br />
manual <strong>in</strong>jections were typically 20% or less.<br />
12<br />
10 uliter<br />
blank hexane<strong>in</strong>jection
Quality Control/Assurance Procedures<br />
<strong>Electronic</strong> <strong>Sensor</strong> Technology utilizes ISO9000 procedures throughout the manufacture<br />
and test<strong>in</strong>g <strong>of</strong> all GC/SAW <strong>in</strong>struments. In addition the company ma<strong>in</strong>ta<strong>in</strong>s an<br />
on-site calibration laboratory where EPA quality control and quality assurance methods<br />
for all performance tests are practiced.<br />
Samples obta<strong>in</strong>ed from JAPANESE COMPANY were logged and ma<strong>in</strong>ta<strong>in</strong>ed by<br />
the laboratory director. In addition the quality <strong>of</strong> calibration standards were controlled by<br />
the laboratory operators throughout the test<strong>in</strong>g <strong>of</strong> the JAPANESE COMPANY samples.<br />
All GC data taken on the JAPANESE COMPANY samples was logged and archived on<br />
the company server. Each data record was labeled and time-stamped accord<strong>in</strong>g to the<br />
Quality Assurance procedures <strong>of</strong> the laboratory.<br />
Figure 10- The EST Quality team tests and certifies the performance<br />
<strong>of</strong> each and every system before it is delivered the customer<br />
13
Evaluation Results<br />
At this time a comprehensive evaluation <strong>of</strong> the extraction method has not been performed<br />
and only prelim<strong>in</strong>ary results on isolated samples has been done. Extract chromatograms<br />
were compared with chromatograms obta<strong>in</strong>ed from standard solutions. An example<br />
<strong>of</strong> a 4 microliter flyash extract chromatogram is shown <strong>in</strong> Figure 11. The three<br />
background traces correspond to (top to bottom) a standard mix <strong>of</strong> furans (1 nanogram<br />
per isomer), a mix <strong>of</strong> diox<strong>in</strong>s (1 nanogram per isomer) , and a standard mix <strong>of</strong> furans and<br />
diox<strong>in</strong>s (0.5 ng per isomer).<br />
Figure 11- Comparison with <strong>in</strong>dividual and mixed diox<strong>in</strong> furan standards<br />
The <strong>in</strong>set table displays the amount <strong>of</strong> each isomer detected as well as its recorded<br />
retention time. The follow<strong>in</strong>g table summarizes the measurement results as total di, tri,<br />
tetra, penta, hexa, hepta, and octa diox<strong>in</strong>s and furans detected. Quantification is based<br />
upon response factors as determ<strong>in</strong>ed from calibration standards and identification was<br />
based upon a retention time which matched the standard’s retention time with<strong>in</strong> 5%.<br />
Quantities <strong>of</strong> each isomer detected <strong>in</strong> this sample ranged from 500 pg to 1.3 ng.<br />
S<strong>in</strong>ce the 4 microliter sample represented only 1/80 <strong>of</strong> the total amount extracted, these<br />
results <strong>in</strong>dicate the sample conta<strong>in</strong>ed 40 to 104 ng/g <strong>of</strong> furan or diox<strong>in</strong> isomers.<br />
Measured<br />
pg<br />
14<br />
<strong>Flyash</strong><br />
ng/g<br />
Di/Tri DF 599 48<br />
Tetra DF 518 41<br />
Penta DF 482 39<br />
Hexa DF 947 76<br />
Hepta DF 871 70<br />
Octa DF 1227 98<br />
total DF 4644 372
Ten second chromatograms represent the fastest analysis time available. Although<br />
peak separation is not complete a useful detection <strong>of</strong> compounds can be still achieved.<br />
Improved resolution was achieved by slow<strong>in</strong>g the column temperature program <strong>of</strong> the GC<br />
method. An example performed on the same extract but with a slower temperature ramp<br />
is shown <strong>in</strong> Figure 12. For comparison a mixed furan/diox<strong>in</strong> standard (1 nanogram per<br />
isomer) is shown <strong>in</strong> the background <strong>of</strong> this figure. The peak separation is greatly improved<br />
expected <strong>in</strong> a 20 second chromatogram.<br />
Figure 12- Comparison with mixed standards<br />
Quantitatively the amount <strong>of</strong> furan/diox<strong>in</strong> isomers detected was quite similar. In<br />
this case the concentrations aga<strong>in</strong> ranged from 500 pg to 2 ng for the isomers detected.<br />
This then predicted a concentration <strong>of</strong> furans and diox<strong>in</strong>s <strong>in</strong> the flyash sample <strong>of</strong> from 40<br />
to 160 ng/g. The total amount <strong>of</strong> diox<strong>in</strong>s furans was approximately 500 ng/g.<br />
Measured<br />
pg<br />
15<br />
<strong>Flyash</strong><br />
ng/g<br />
Di/Tri DF 123 10<br />
Tetra DF 1352 108<br />
Penta DF 944 76<br />
Hexa DF 625 50<br />
Hepta DF 1700 136<br />
Octa DF 1290 103<br />
total DF 6034 483<br />
Not all flyash samples gave the same result as <strong>in</strong>dicated by the result shown <strong>in</strong> Figure<br />
13. A very slow temperature ramp was used to produce a 150 second analysis time<br />
and the resolution achieved illustrates perhaps the best separation which can be achieved
with the length <strong>of</strong> column used. In this flyash sample the amount <strong>of</strong> furan/diox<strong>in</strong> isomers<br />
detected was relatively low spann<strong>in</strong>g a range <strong>of</strong> 100 to 300 picograms. Thus this extract<br />
had a normalized concentration <strong>of</strong> from 8 to 24 ng/g. For comparison a mixed standard<br />
(1 nanogram per isomer) is shown <strong>in</strong> the background.<br />
Figure 13 Increased resolution with slower ramp and lower temperature.<br />
Measured<br />
pg<br />
16<br />
<strong>Flyash</strong><br />
ng/g<br />
Tetra DF 171 14<br />
Penta DF - -<br />
Hexa DF 282 23<br />
Hepta DF 123 10<br />
Octa DF - -<br />
total DF 576 46
Comparison with Laboratory Results<br />
Independent laboratory results <strong>of</strong> GC/MS analysis upon the flyash samples was<br />
supplied by JAPANESE COMPANY and a sample chromatogram as well as the analytical<br />
results are shown <strong>in</strong> Figure 14. The concentration <strong>of</strong> furan/diox<strong>in</strong> isomers detected<br />
ranged from 96 to as high as 1100 ng/g. These results are quite similar to that reported<br />
with the GC/SAW, however the analysis time is approximately 30 m<strong>in</strong>utes. In this case a<br />
much longer column was used and the resolution is greatly improved.<br />
Figure 14- Laboratory results supplied by BHK<br />
Compar<strong>in</strong>g the average <strong>of</strong> GC/SAW measurements with the JAPANESE COM-<br />
PANY laboratory results provides an estimate <strong>of</strong> the recovery <strong>of</strong> the simple extraction<br />
method as follows.<br />
Measured<br />
ng/g<br />
17<br />
Laboratory<br />
ng/g<br />
Estimated<br />
Recovery<br />
%<br />
Di/Tri DF 29 - -<br />
Tetra DF 75 96 78%<br />
Penta DF 57 182 31%<br />
Hexa DF 63 271 23%<br />
Hepta DF 103 210 49%<br />
Octa DF 101 217 46%<br />
total DF 427 1100 39%
Recommendations<br />
The simple extraction method used <strong>in</strong> these prelim<strong>in</strong>ary evaluations was designed<br />
to provide an <strong>in</strong>itial field method for quickly screen<strong>in</strong>g flyash samples. There is a need to<br />
perform accurate recovery and MDL test<strong>in</strong>g on this method. A Soxhlet extraction will be<br />
used as a basel<strong>in</strong>e measurement for comparison. To accomplish this the Soxhlet extraction<br />
apparatus pictured <strong>in</strong> Figure 15 was purchased and is available.<br />
Figure 15- Soxhlet extraction apparatus.<br />
The prelim<strong>in</strong>ary results demonstrated that there is significant amount <strong>of</strong> background<br />
compounds which might create false alarms. To reduce this probability there<br />
needs to be an application <strong>of</strong> some cleanup method. Also, an evaluation <strong>of</strong> solid phase<br />
extraction (SPE) and solid phase micro extraction SPME as a means for filter<strong>in</strong>g and reduc<strong>in</strong>g<br />
the number <strong>of</strong> compounds which might <strong>in</strong>terfere with diox<strong>in</strong>/furan detection will<br />
be tested <strong>in</strong> the future.<br />
18