Tainting in Wine from Lubricants and Grease
Tainting in Wine from Lubricants and Grease
Tainting in Wine from Lubricants and Grease

Create successful ePaper yourself
Turn your PDF publications into a flip-book with our unique Google optimized e-Paper software.
<strong>Ta<strong>in</strong>t<strong>in</strong>g</strong> <strong>in</strong> W<strong>in</strong>e <strong>from</strong> <strong>Lubricants</strong> <strong>and</strong> <strong>Grease</strong><br />
Summary- Us<strong>in</strong>g the zNose® ta<strong>in</strong>ted w<strong>in</strong>e samples were easily dist<strong>in</strong>guished <strong>from</strong><br />
control sample us<strong>in</strong>g ultra-fast chromatography. Quality control test<strong>in</strong>g of w<strong>in</strong>e<br />
headspace vapors at rates as high as 40 samples per hour was demonstrated. Variations<br />
<strong>in</strong> the concentration of the pr<strong>in</strong>cipal w<strong>in</strong>e components (e. caproate <strong>and</strong> e. caprylate) <strong>and</strong><br />
detection of trace impurities was used to characterize <strong>and</strong> quantify ta<strong>in</strong>t<strong>in</strong>g.<br />
Supplied Samples<br />
Six 200 mL bottles labeled pure grease, lubricant oil, control w<strong>in</strong>e, light swirl w<strong>in</strong>e,<br />
medium swirl w<strong>in</strong>e, <strong>and</strong> heavy droplets w<strong>in</strong>e.<br />
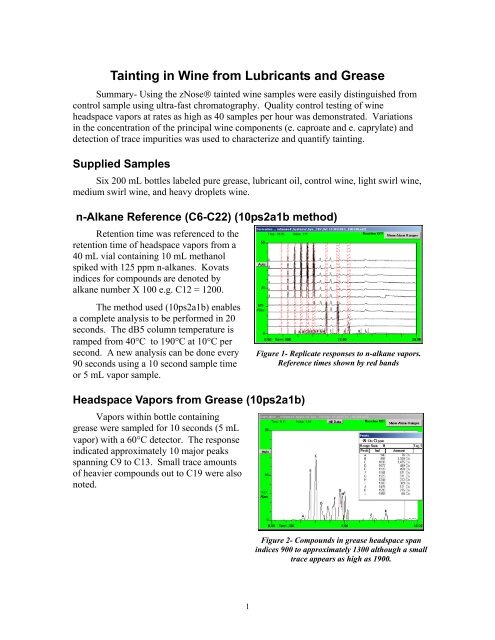
n-Alkane Reference (C6-C22) (10ps2a1b method)<br />
Retention time was referenced to the<br />
retention time of headspace vapors <strong>from</strong> a<br />
40 mL vial conta<strong>in</strong><strong>in</strong>g 10 mL methanol<br />
spiked with 125 ppm n-alkanes. Kovats<br />
<strong>in</strong>dices for compounds are denoted by<br />
alkane number X 100 e.g. C12 = 1200.<br />
The method used (10ps2a1b) enables<br />
a complete analysis to be performed <strong>in</strong> 20<br />
seconds. The dB5 column temperature is<br />
ramped <strong>from</strong> 40°C to 190°C at 10°C per<br />
second. A new analysis can be done every<br />
90 seconds us<strong>in</strong>g a 10 second sample time<br />
or 5 mL vapor sample.<br />
Headspace Vapors <strong>from</strong> <strong>Grease</strong> (10ps2a1b)<br />
Vapors with<strong>in</strong> bottle conta<strong>in</strong><strong>in</strong>g<br />
grease were sampled for 10 seconds (5 mL<br />
vapor) with a 60°C detector. The response<br />
<strong>in</strong>dicated approximately 10 major peaks<br />
spann<strong>in</strong>g C9 to C13. Small trace amounts<br />
of heavier compounds out to C19 were also<br />
noted.<br />
1<br />
Figure 1- Replicate responses to n-alkane vapors.<br />
Reference times shown by red b<strong>and</strong>s<br />
Figure 2- Compounds <strong>in</strong> grease headspace span<br />
<strong>in</strong>dices 900 to approximately 1300 although a small<br />
trace appears as high as 1900.
Headspace Vapors <strong>from</strong> Lubricant (10ps2a1b)<br />
Vapors with<strong>in</strong> bottle conta<strong>in</strong><strong>in</strong>g<br />
lubricant oil were sampled<br />
for 10 seconds (5 mL vapor) with a<br />
60°C detector. The response <strong>in</strong>dicated<br />
one major peak at 887 <strong>and</strong><br />
three m<strong>in</strong>or peaks 1000 to 1075.<br />
Only m<strong>in</strong>or trace amounts of heavier<br />
compounds were detected.<br />
Figure 3- One major compound (887) <strong>and</strong> three m<strong>in</strong>or<br />
compounds (1000, 1038, <strong>and</strong> 1075) were detected <strong>in</strong><br />
headspace vapors <strong>from</strong> lubricant.<br />
Creat<strong>in</strong>g Alarms for <strong>Grease</strong> & Lubricant Compounds<br />
Alarm b<strong>and</strong> for four major compounds which were present <strong>in</strong> both grease <strong>and</strong><br />
lubricant oil was done us<strong>in</strong>g graphical <strong>in</strong>terface. Alarm b<strong>and</strong>s allow quantification of<br />
peak areas (<strong>in</strong> counts) <strong>and</strong> b<strong>and</strong>s overlaid <strong>in</strong> red make it easier to locate these compounds<br />
<strong>in</strong> complex chromatograms.<br />
Figure 4- Vertically offset chromatograms <strong>from</strong> grease <strong>and</strong> lubricant oil. The area of the four major<br />
peaks are quantified <strong>in</strong> for each <strong>in</strong> the tables on the right of figure.<br />
2
Headspace of Control W<strong>in</strong>e (10ps2a1b)<br />
Headspace of Heavy Droplets <strong>in</strong> W<strong>in</strong>e (10ps2a1b)<br />
Headspace of Medium Swirl W<strong>in</strong>e (10ps2a1b)<br />
3
Headspace of Lite Swirl W<strong>in</strong>e (10ps2a1b)<br />
Headspace of Lite Swirl W<strong>in</strong>e (10ps2a1b)<br />
Offset plott<strong>in</strong>g of<br />
chromatograms <strong>from</strong> w<strong>in</strong>e<br />
headspace <strong>in</strong> w<strong>in</strong>e bottle<br />
samples did not reveal any<br />
major compound peaks <strong>from</strong><br />
the grease or lubricant oils as<br />
seen <strong>in</strong> the alarm b<strong>and</strong>s <strong>in</strong><br />
red.<br />
However, the pr<strong>in</strong>cipal<br />
compounds with<strong>in</strong> the w<strong>in</strong>e<br />
were greatly reduced <strong>in</strong> the<br />
medium <strong>and</strong> lite swirl<br />
samples <strong>in</strong>dicat<strong>in</strong>g alteration<br />
of their solubility <strong>in</strong> the w<strong>in</strong>e<br />
as well as partition<strong>in</strong>g <strong>in</strong>to<br />
the headspace (Henry’s<br />
constant).<br />
Increased concentration<br />
of heavy oil droplet sample<br />
was more due to the larger<br />
amount of w<strong>in</strong>e <strong>in</strong> this bottle<br />
relative to the control bottle.<br />
4
Offset Comparisons of Headspace <strong>in</strong> Sample bottles<br />
More detailed offset comparisons show clear contam<strong>in</strong>ation (denoted by red) of<br />
w<strong>in</strong>e samples compared with control sample bottle. Exp<strong>and</strong>ed traces also shows<br />
contam<strong>in</strong>ation <strong>from</strong> heavier compounds.<br />
VaporPr<strong>in</strong>t ® Comparisons of W<strong>in</strong>e Samples<br />
High resolution olfactory images<br />
depict<strong>in</strong>g logarithmic radial odor<br />
<strong>in</strong>tensity vs retention time (angle, top=0,<br />
Max) provide a visual representation of<br />
the entire odor. These images are<br />
directly measured by the SAW sensor<br />
<strong>and</strong> chromatograms are derived by<br />
derivatization of the sensor signal.<br />
Lite <strong>and</strong> medium swirl images are<br />
easily dist<strong>in</strong>guished <strong>from</strong> that of the<br />
control sample. However, only the<br />
previous trace analysis us<strong>in</strong>g exp<strong>and</strong>ed<br />
chromatograms can dist<strong>in</strong>guish between<br />
heavy droplets <strong>and</strong> the control sample.<br />
5