Urine Odors in an Urban Dwelling - Electronic Sensor Technology
Urine Odors in an Urban Dwelling - Electronic Sensor Technology
Urine Odors in an Urban Dwelling - Electronic Sensor Technology

Create successful ePaper yourself
Turn your PDF publications into a flip-book with our unique Google optimized e-Paper software.
APPLICATION NOTES<br />
Document Name: <strong>Ur<strong>in</strong>e</strong> <strong>Odors</strong> <strong>in</strong> <strong>an</strong> Urb<strong>an</strong> Dwell<strong>in</strong>g Doc #:<br />
Author: Edward Staples<br />
Application:<br />
Equipment: Model 4200<br />
Industry: Environmental<br />
Compounds Discussed:<br />
<strong>Ur<strong>in</strong>e</strong><br />
Method: Yes<br />
Summary:<br />
1077 Bus<strong>in</strong>ess Center Circle<br />
Newbury Park, CA 91320<br />
Tel 805-480-1994<br />
Fax 805-480-1984<br />
www.znose.com<br />
Results of test<strong>in</strong>g <strong>an</strong> urb<strong>an</strong> dwell<strong>in</strong>g for the presence of org<strong>an</strong>ic compounds associated<br />
with ur<strong>in</strong>e odors have shown that these odors exist with<strong>in</strong> the <strong>in</strong>door air of the dwell<strong>in</strong>g.<br />
Ambient air throughout the dwell<strong>in</strong>g was evaluated by test<strong>in</strong>g <strong>in</strong> multiple locations with<strong>in</strong><br />
each room as well as with<strong>in</strong> air ducts. Over 150 ambient air measurements were performed<br />
with<strong>in</strong> the house (on site) <strong>an</strong>d grab-samples were also tested at <strong>an</strong> off-site laboratory. In<br />
general the concentration of org<strong>an</strong>ic compounds found was extremely low (ppt to low ppb)<br />
concentrations <strong>an</strong>d chromatogram peaks also detected <strong>in</strong> ur<strong>in</strong>e vapors were detected <strong>in</strong><br />
ambient air with<strong>in</strong> the house. In bathrooms where toilets had been removed emissions from<br />
sewer pipes were tested as potential emission sources. The concentrations of targeted<br />
compounds with<strong>in</strong> the sewer pipes were low <strong>an</strong>d did not appear to be a source of odors<br />
with<strong>in</strong> the house. However, because of the large numbers of background peaks at these low<br />
concentration levels it is difficult to be certa<strong>in</strong> the peaks were actually metabolic compounds<br />
from ur<strong>in</strong>e without <strong>in</strong>dependent validation.
<strong>Ur<strong>in</strong>e</strong> <strong>Odors</strong> <strong>in</strong> <strong>an</strong> Urb<strong>an</strong> Dwell<strong>in</strong>g<br />
By Edward J. Staples, Ph.D.<br />
Odor Assessment with <strong>an</strong> <strong>Electronic</strong> Nose<br />
Conventional odor assessment methods use subjective hum<strong>an</strong> p<strong>an</strong>els to evaluate ambient air<br />
samples collected <strong>in</strong> tedlar bags. A summary report us<strong>in</strong>g common descriptors such as foul, sweet, pungent,<br />
etc. is produced. These reports are useful but difficult to <strong>in</strong>terpret <strong>an</strong>d are certa<strong>in</strong>ly not qu<strong>an</strong>titative.<br />
<strong>Electronic</strong> noses (eNoses) us<strong>in</strong>g <strong>an</strong> array of dissimilar but not specific chemical sensors c<strong>an</strong> also be used to<br />
evaluate odors by simulat<strong>in</strong>g the hum<strong>an</strong> olfactory system. However, physical sensors have limited<br />
perform<strong>an</strong>ce because of overlapp<strong>in</strong>g responses <strong>an</strong>d hence c<strong>an</strong>not separate or qu<strong>an</strong>tify odor chemistry.<br />
A new type of electronic nose, called the zNose®, is based upon ultra-fast gas chromatography,<br />
simulates <strong>an</strong> almost unlimited number of specific virtual chemical sensors, <strong>an</strong>d produces olfactory images<br />
based upon aroma chemistry. The zNose® is able to perform <strong>an</strong>alytical measurements of volatile org<strong>an</strong>ic<br />
vapors <strong>an</strong>d odors <strong>in</strong> near real time with part-per-trillion sensitivity. Separation <strong>an</strong>d qu<strong>an</strong>tification of the<br />
<strong>in</strong>dividual chemicals with<strong>in</strong> <strong>an</strong> odor is performed <strong>in</strong> seconds. An <strong>in</strong>tegrated vapor preconcentrator coupled<br />
with the electronically variable detector, allow the <strong>in</strong>strument to measure vapor concentrations sp<strong>an</strong>n<strong>in</strong>g 6+<br />
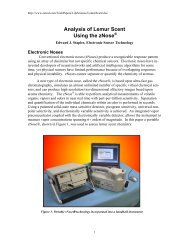
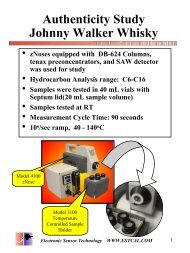
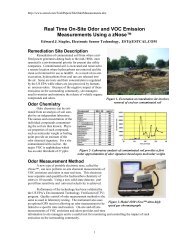
orders of magnitude. In this report a portable zNose®, shown <strong>in</strong> Figure 1, is used to assess ur<strong>in</strong>e odors<br />
found <strong>in</strong> <strong>an</strong> urb<strong>an</strong> dwell<strong>in</strong>g <strong>an</strong>d to qu<strong>an</strong>tify the concentration of chemicals <strong>in</strong> these odors.<br />
Figure 1- Portable zNose® gas chromatograph.
How the zNose Qu<strong>an</strong>tifies the Chemistry of <strong>Odors</strong><br />
A simplified diagram of the zNose system shown <strong>in</strong> Figure 2 consists of two parts. One section<br />
uses helium gas, a capillary tube (GC column) <strong>an</strong>d a solid-state detector. The other section consists of a<br />
heated <strong>in</strong>let <strong>an</strong>d pump, which samples ambient air. L<strong>in</strong>k<strong>in</strong>g the two sections is a “loop” trap, which acts as<br />
a preconcentrator when placed <strong>in</strong> the air section (sample position) <strong>an</strong>d as <strong>an</strong> <strong>in</strong>jector when placed <strong>in</strong> the<br />
helium section (<strong>in</strong>ject position). Operation is a two step process. Ambient air (aroma) is first sampled <strong>an</strong>d<br />
org<strong>an</strong>ic vapors collected (preconcentrated) on the trap.<br />
After sampl<strong>in</strong>g the trap is switched <strong>in</strong>to the helium section<br />
where the collected org<strong>an</strong>ic compounds are <strong>in</strong>jected <strong>in</strong>to the<br />
helium gas. The org<strong>an</strong>ic compounds pass through a<br />
capillary column with different velocities <strong>an</strong>d thus<br />
<strong>in</strong>dividual chemicals exit the column at characteristic<br />
times. As they exit the column they are detected <strong>an</strong>d<br />
qu<strong>an</strong>tified by a solid state detector.<br />
An <strong>in</strong>ternal high-speed gate array mi- croprocessor<br />
controls the tak<strong>in</strong>g of sensor data which is tr<strong>an</strong>sferred to a<br />
user <strong>in</strong>terface or computer us<strong>in</strong>g <strong>an</strong> RS-232 or USB connection.<br />
Calibration is accomplished us<strong>in</strong>g a s<strong>in</strong>gle n-alk<strong>an</strong>e<br />
vapor st<strong>an</strong>dard. A library of retention times of known<br />
chemicals <strong>in</strong>dexed to the n-alk<strong>an</strong>e response (Kovats <strong>in</strong>dices)<br />
allows for mach<strong>in</strong>e <strong>in</strong>dependent meascompound<br />
identification. The time<br />
sensor spectrum yields the spectrum of<br />
commonly referred to as a chromatogram.<br />
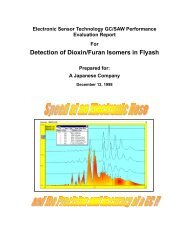
chromatogram response (Figure 3) of n-<br />
Figure 2- Simplified diagram of the zNose<br />
show<strong>in</strong>g <strong>an</strong> air section on the right <strong>an</strong>d a<br />
helium section on the left. A loop trap<br />
preconcentrates org<strong>an</strong>ics from ambient air <strong>in</strong><br />
the sample position <strong>an</strong>d <strong>in</strong>jects them <strong>in</strong>to the<br />
helium section when <strong>in</strong> the <strong>in</strong>ject position.<br />
urement <strong>an</strong>d<br />
derivative of the<br />
column flux,<br />
The<br />
alk<strong>an</strong>e vapors<br />
(C6 to C14) provides <strong>an</strong> accurate measure of retention<br />
times. Graphically def<strong>in</strong>ed regions shown as red b<strong>an</strong>ds calibrate the system <strong>an</strong>d provide a reference time<br />
base aga<strong>in</strong>st which subsequent chemical responses are compared or <strong>in</strong>dexed. As <strong>an</strong> example, a response<br />
midway between C10 <strong>an</strong>d C11 would have a retention time <strong>in</strong>dex of 1050.<br />
Figure 3 - Chromatogram of n-alk<strong>an</strong>e vapors C6 to C14).
<strong>Ur<strong>in</strong>e</strong> Odor St<strong>an</strong>dards<br />
<strong>Odors</strong> from fresh <strong>an</strong>d ‘old’ ur<strong>in</strong>e samples were measured <strong>an</strong>d compared. The ‘old’ ur<strong>in</strong>e was obta<strong>in</strong>ed<br />
from bottles left <strong>in</strong> the attic of the dwell<strong>in</strong>g <strong>an</strong>d was estimated to be over 1 year old. Approximately 10<br />
milliliters of ur<strong>in</strong>e was placed <strong>in</strong> a septa-sealed 40 milliliter vials <strong>an</strong>d allowed to equilibrate for 10 m<strong>in</strong>utes<br />
at room temperature before the headspace vapors were tested us<strong>in</strong>g the zNose®. Vertically offset<br />
chromatograms of headspace measurements are shown <strong>in</strong> Figure 3. Approximately 14 dist<strong>in</strong>ct chemicals<br />
were detected <strong>an</strong>d named accord<strong>in</strong>g to their Kovats <strong>in</strong>dices.<br />
Differences between old <strong>an</strong>d fresh ur<strong>in</strong>e odors c<strong>an</strong> be more easily seen <strong>in</strong> the overlaid chromatograms<br />
of Figure 4. Older ur<strong>in</strong>e loses m<strong>an</strong>y of the more volatile compounds with <strong>in</strong>dices below 650. In addition<br />
some of the mid r<strong>an</strong>ge compounds (ur<strong>in</strong>e 1057, ur<strong>in</strong>e 1081 <strong>an</strong>d ur<strong>in</strong>e 1196) are metabolized by bacteria <strong>an</strong>d<br />
no longer present <strong>in</strong> old ur<strong>in</strong>e. In spite of these differences m<strong>an</strong>y of the major chemicals <strong>in</strong> ur<strong>in</strong>e odors<br />
rema<strong>in</strong> unch<strong>an</strong>ged over long periods of time.<br />
Figure 4- Replicate chromatograms of headspace vapors from fresh <strong>an</strong>d old ur<strong>in</strong>e samples.<br />
Although not directly identified m<strong>an</strong>y of the volatile <strong>an</strong>d odoriferous compounds <strong>in</strong> ur<strong>in</strong>e are known<br />
to be am<strong>in</strong>o acids. This c<strong>an</strong> be deduced from the comparison headspace measurements of Figure 5 where<br />
headspace vapors from a s<strong>in</strong>gle drop of fresh blood are compared with headspace vapors from ur<strong>in</strong>e.
The graphically def<strong>in</strong>ed b<strong>an</strong>ds shown <strong>in</strong> Figures 3 <strong>an</strong>d 5 are used to def<strong>in</strong>e regions of retention time or<br />
retention <strong>in</strong>dices specific to ur<strong>in</strong>e odors. Once def<strong>in</strong>ed, each region will acts as a virtual chemical sensor<br />
Figure 5- Overlaid chromatograms <strong>an</strong>d peak area counts of headspace vapors from old <strong>an</strong>d fresh<br />
(shown <strong>in</strong> RED) ur<strong>in</strong>e.<br />
specific to <strong>an</strong> org<strong>an</strong>ic compound with a specific retention <strong>in</strong>dex. Alarm levels may be set for each virtual<br />
sensor <strong>in</strong> <strong>an</strong> array of sensors <strong>an</strong>d the array aggregate response then def<strong>in</strong>es the target odor of ur<strong>in</strong>e.<br />
Description of On-Site Test<strong>in</strong>g <strong>an</strong>d F<strong>in</strong>d<strong>in</strong>gs<br />
The objective was to test ambient air with<strong>in</strong> <strong>an</strong> un-<strong>in</strong>habited house us<strong>in</strong>g the target odor profile of<br />
ur<strong>in</strong>e. The house was a large s<strong>in</strong>gle story dwell<strong>in</strong>g with over 14,00 square feet <strong>an</strong>d conta<strong>in</strong>ed m<strong>an</strong>y rooms<br />
as shown <strong>in</strong> the floor pl<strong>an</strong> of Figure 6. No furnish<strong>in</strong>gs or personal belong<strong>in</strong>gs were present. Outside air <strong>an</strong>d<br />
ambient air with<strong>in</strong> the house was measured by a portable gas chromatograph (GC) <strong>an</strong>d air preconcentrator.<br />
Figure 7- Floor pl<strong>an</strong> of house <strong>in</strong> which ambient air was tested for traces of ur<strong>in</strong>e.<br />
Figure 6- Offset <strong>an</strong>d overlaid chromatograms of headspace vapors from blood <strong>an</strong>d ur<strong>in</strong>e (shown <strong>in</strong><br />
RED) show m<strong>an</strong>y of the same peaks s<strong>in</strong>ce both conta<strong>in</strong> am<strong>in</strong>o acids.
The preconcentrated air sample volume was 15 milliliters <strong>an</strong>d the m<strong>in</strong>imum detection level of the GC sensor<br />
was approximately 10 picograms. For all vapor samples tested the column (a db624) was temperature<br />
programmed to rise from 40 o C to 160 o C at 10 o C/second <strong>an</strong>d data acquisition (chromatogram) time was 20<br />
seconds. A detector temperature of 10 o C was used. With these <strong>in</strong>strument sett<strong>in</strong>gs, the result<strong>an</strong>t detection<br />
levels for volatile org<strong>an</strong>ic compounds (C4 to C18) <strong>in</strong> air were <strong>in</strong> the low ppb r<strong>an</strong>ge.<br />
Ambient air throughout the house was evaluated by test<strong>in</strong>g <strong>in</strong> several locations with<strong>in</strong> each room as<br />
well as with<strong>in</strong> air ducts where covers had been removed. Over 150 ambient air measurements were<br />
performed with<strong>in</strong> the house (on site) as well as grab-samples at <strong>an</strong> off-site laboratory. In general trace<br />
levels (ppt to low ppb) concentrations of org<strong>an</strong>ic compounds specific to ur<strong>in</strong>e were detected throughout the<br />
house. A portion of the more th<strong>an</strong> 150 measurements is shown us<strong>in</strong>g vertically offset chromatograms <strong>in</strong><br />
Figure 7. Hatched red b<strong>an</strong>ds del<strong>in</strong>eate compounds specific to ur<strong>in</strong>e odors <strong>an</strong>d numbered peaks <strong>in</strong>dicate<br />
ur<strong>in</strong>e compounds above <strong>an</strong> arbitrary threshold level of 20 counts.
In bathrooms where toilets had been removed emissions from sewer pipes were tested as potential<br />
emission sources. As <strong>an</strong> example, <strong>in</strong> Figure 8 sewer pipe odor (cover removed) is compared with<br />
surround<strong>in</strong>g room air. The concentrations of targeted compounds with<strong>in</strong> the sewer pipe were higher when<br />
Figure 9-Typical measurements vertically offset for view<strong>in</strong>g. 10 o detector, 30 second sample,<br />
10ps2a1b method, 140 o C valve, <strong>an</strong>d 200 o C <strong>in</strong>let<br />
the pipe cover was removed but did not appear to be a source of emissions when covered.<br />
Figure 8 -Sewer odors <strong>in</strong> bathroom by butler’s p<strong>an</strong>try 10 o detector, 30-second sample, 10ps2a1b<br />
method, 140 o C valve, <strong>an</strong>d 200 o C <strong>in</strong>let
In general, on-site test<strong>in</strong>g did not reveal or detect <strong>an</strong>y localized high concentration sources of odor<br />
emission <strong>in</strong> <strong>an</strong>y rooms of the house. Instead there appeared to a general presence of ur<strong>in</strong>e odor throughout<br />
the house. As <strong>an</strong> example, ambient air tested <strong>in</strong> the hallway lead<strong>in</strong>g to the master bedroom clearly shows<br />
the presence of the same org<strong>an</strong>ic compounds found <strong>in</strong> ur<strong>in</strong>e when compared with offset chromatograms.<br />
Other sources of org<strong>an</strong>ic compounds, which were <strong>in</strong>vestigated at the site, were fertilizers that had<br />
been used on the surround<strong>in</strong>g l<strong>an</strong>dscape <strong>an</strong>d shrubbery. <strong>Odors</strong> from Turf fertilizer <strong>an</strong>d Kelate powder,<br />
shown <strong>in</strong> Figures 10 <strong>an</strong>d 11, were compared with odor from ur<strong>in</strong>e as well as the outside air surround<strong>in</strong>g the<br />
house. These fertilizers did show trace amounts of the same org<strong>an</strong>ic compounds found <strong>in</strong> ur<strong>in</strong>e. However,<br />
Figure 10- <strong>Odors</strong> <strong>in</strong> hallway lead<strong>in</strong>g to master bedroom. 10 o detector, 30-second sample, 10ps2a1b<br />
method, 140 o C valve, <strong>an</strong>d 200 o C <strong>in</strong>let<br />
because their odor profile or signature was dom<strong>in</strong>ated by other high concentration org<strong>an</strong>ic compounds not<br />
detected <strong>in</strong> air outside or <strong>in</strong>side of the house, they were ruled out as the source of ur<strong>in</strong>e odors <strong>in</strong> the house.
Figure 11- Turf fertilizer odor compared with ur<strong>in</strong>e <strong>an</strong>d outside air measurements. 10 o detector, 30<br />
second sample, 10ps2a1b method, 140 o C valve, <strong>an</strong>d 200 o C <strong>in</strong>let<br />
Figure 12- Kelate powder compared with ur<strong>in</strong>e <strong>an</strong>d outside air measurements. 10 o detector, 30<br />
second sample, 10ps2a1b method, 140 o C valve, <strong>an</strong>d 200 o C <strong>in</strong>let
<strong>Odors</strong> from drywall <strong>an</strong>d <strong>in</strong>sulation collected at the site (liv<strong>in</strong>g room air duct) were <strong>in</strong>vestigated by<br />
plac<strong>in</strong>g samples <strong>in</strong> septa-sealed vials <strong>an</strong>d directly sampl<strong>in</strong>g vapors thru a side-ported needle. <strong>Odors</strong> from<br />
comparable <strong>in</strong>sulation <strong>an</strong>d drywall materials from a California build<strong>in</strong>g (EST) were also tested <strong>an</strong>d all were<br />
compared to ur<strong>in</strong>e odor, which is shown overlaid <strong>in</strong> red <strong>in</strong> Figure 12. Also shown <strong>in</strong> blue are odors from<br />
empty vials (bl<strong>an</strong>ks). The major peaks relev<strong>an</strong>t to ur<strong>in</strong>e odors are shown as hatched b<strong>an</strong>ds <strong>an</strong>d their <strong>in</strong>dices<br />
shown at the top of the figure. Background peaks c<strong>an</strong> be seen <strong>in</strong> the bl<strong>an</strong>k runs <strong>an</strong>d are believed due to<br />
ambient air or sample needle carryover. The concentration of vapors from these samples was very low (ppt<br />
Figure 13- Odor s from <strong>in</strong>sulation <strong>an</strong>d drywall taken from d<strong>in</strong><strong>in</strong>g room air duct. 10 o detector, 30<br />
second sample, 10ps2a1b method, 140 o C valve, <strong>an</strong>d 200 o C <strong>in</strong>let<br />
levels) <strong>an</strong>d carryover <strong>an</strong>d contam<strong>in</strong>ation made measurements difficult. Nevertheless, peaks 1220 <strong>an</strong>d 1498<br />
are of noteworthy because they only appeared <strong>in</strong> ur<strong>in</strong>e odors. Based upon this the <strong>in</strong>sulation <strong>an</strong>d drywall<br />
samples taken from the d<strong>in</strong><strong>in</strong>g room duct appears not to be contam<strong>in</strong>ated with ur<strong>in</strong>e.<br />
To improve signal to noise <strong>in</strong> sample <strong>an</strong>d ambient air vapor measurements a high flow vapor<br />
preconcentration step was implemented. In this technique vapors from samples are first preconcentrated <strong>in</strong><br />
a metal tube filled with tenax (SKC) us<strong>in</strong>g a high sampl<strong>in</strong>g airflow, typically 450 ccm. After<br />
preconcentration the metal tube is <strong>in</strong>serted <strong>in</strong>to the GC <strong>in</strong>let <strong>an</strong>d trapped vapors released <strong>in</strong>to the <strong>in</strong>strument<br />
by heat<strong>in</strong>g the tube to 220 o C. The zNose® is designed to accommodate metal desorbtion tubes <strong>an</strong>d by this<br />
technique is able to <strong>in</strong>crease the sensitivity of ambient air measurements by m<strong>an</strong>y orders of magnitude.
High airflow sampl<strong>in</strong>g vapors from ur<strong>in</strong>e contam<strong>in</strong>ated wood shav<strong>in</strong>gs (bagged samples <strong>in</strong> garage)<br />
were placed <strong>in</strong> a septa-sealed vial <strong>an</strong>d equilibrated for 10 m<strong>in</strong>utes before headspace vapors were tested.<br />
Headspace chromatogram results for sample No. 68332 are shown <strong>in</strong> the bottom trace of Figure 13. Four<br />
vertically offset chromatograms from ur<strong>in</strong>e are shown for comparison. The appear<strong>an</strong>ce of peaks at <strong>in</strong>dices<br />
of 1220 <strong>an</strong>d 1498 strongly suggest that this wood sample was contam<strong>in</strong>ated with ur<strong>in</strong>e.<br />
Although screen<strong>in</strong>g with a fast GC may <strong>in</strong>dicate ur<strong>in</strong>e contam<strong>in</strong>ation this conclusion should be<br />
supported by <strong>in</strong>dependent laboratory test<strong>in</strong>g with a GC/MS <strong>an</strong>d by identification of the target compounds.<br />
The large numbers of compounds detected at ppt concentration levels, make <strong>in</strong>dependent confirmation<br />
imperative. The peak with <strong>in</strong>dex of 1498 is postulated to be phenylacetic acid, which is a common<br />
Figure 14- <strong>Odors</strong> from wood sample No. 68332 compared with ur<strong>in</strong>e odor. 20 o detector, 2 m<strong>in</strong> sample 450<br />
ccm <strong>in</strong>to tenax preconcentrator, 220 o C desorber, 5ps2a1b method.<br />
metabolite released <strong>in</strong> ur<strong>in</strong>e, <strong>an</strong>d which has <strong>an</strong> odor described as sweet ur<strong>in</strong>e. Because of its high boil<strong>in</strong>g<br />
po<strong>in</strong>t, 265 o C, it would be difficult to remove by ventilation <strong>an</strong>d readily adhere to surfaces. M<strong>an</strong>y other<br />
metabolic compounds are present <strong>in</strong> ur<strong>in</strong>e <strong>an</strong>d even more may be created over time as a result of bacteria<br />
present <strong>in</strong> the ambient environment.
<strong>Odors</strong> from samples of <strong>in</strong>sulation taken from the d<strong>in</strong><strong>in</strong>g room air duct were re-tested us<strong>in</strong>g a high flow<br />
preconcentrator <strong>an</strong>d the results are shown <strong>in</strong> Figure 14 <strong>an</strong>d compared with EST <strong>in</strong>sulation samples <strong>an</strong>d ur<strong>in</strong>e<br />
odor. The <strong>in</strong>sulation does not appear to be contam<strong>in</strong>ated with ur<strong>in</strong>e s<strong>in</strong>ce the two peaks 1220 <strong>an</strong>d 1498 are<br />
not present.<br />
Figure 15- <strong>Odors</strong> from Wool Insulation compared with ur<strong>in</strong>e odor. 20 o detector, 2 m<strong>in</strong> sample 450 ccm<br />
<strong>in</strong>to tenax preconcentrator, 220 o C desorber, 5ps2a1b method.
<strong>Odors</strong> from samples of drywall taken from the d<strong>in</strong><strong>in</strong>g room air duct were also retested us<strong>in</strong>g a high<br />
flow preconcentrator <strong>an</strong>d the results are shown <strong>in</strong> Figure 15 <strong>an</strong>d compared with EST drywall samples <strong>an</strong>d<br />
ur<strong>in</strong>e odor. Interference from background is very low as seen <strong>in</strong> the bl<strong>an</strong>k chromatogram (<strong>in</strong> red) from<br />
preconcentration of vapors <strong>in</strong> <strong>an</strong> empty vial. The drywall does not appear to be contam<strong>in</strong>ated with ur<strong>in</strong>e<br />
s<strong>in</strong>ce the two peaks 1220 <strong>an</strong>d 1498 are not present.<br />
Figure 16- <strong>Odors</strong> from wallboard sample compared with ur<strong>in</strong>e odor.20 o detector, 2 m<strong>in</strong> sample 450 ccm<br />
<strong>in</strong>to tenax preconcentrator, 220 o C desorber, 5ps2a1b method.
Conclusions <strong>an</strong>d Recommendations<br />
Chemical profil<strong>in</strong>g of urb<strong>an</strong> <strong>in</strong>door air c<strong>an</strong> be performed on-site <strong>an</strong>d <strong>in</strong> near real time us<strong>in</strong>g <strong>an</strong> ultra<br />
high speed portable gas chromatograph. It is possible to qu<strong>an</strong>titively measure air quality on-site <strong>an</strong>d to<br />
recognize the chemical signature of nusi<strong>an</strong>ce odors. Index<strong>in</strong>g of retention times for target compounds<br />
us<strong>in</strong>g <strong>an</strong> n-alk<strong>an</strong>e vapor st<strong>an</strong>dard provides a convenient method of screen<strong>in</strong>g for target compounds. GC<br />
test<strong>in</strong>g of ambient air coupled with sensory data from hum<strong>an</strong>s yields a more objective method of classify<strong>in</strong>g<br />
<strong>an</strong>d qu<strong>an</strong>tify<strong>in</strong>g odors.<br />
Results of test<strong>in</strong>g <strong>an</strong> urb<strong>an</strong> dwell<strong>in</strong>g for the presence of org<strong>an</strong>ic compounds associated with ur<strong>in</strong>e<br />
odors have shown that these odors exist with<strong>in</strong> the <strong>in</strong>door air of the dwell<strong>in</strong>g. Ambient air throughout the<br />
dwell<strong>in</strong>g was evaluated by test<strong>in</strong>g <strong>in</strong> multiple locations with<strong>in</strong> each room as well as with<strong>in</strong> air ducts. Over<br />
150 ambient air measurements were performed with<strong>in</strong> the house (on site) <strong>an</strong>d grab-samples were also tested<br />
at <strong>an</strong> off-site laboratory. In general the concentration of org<strong>an</strong>ic compounds found was extremely low (ppt<br />
to low ppb) concentrations <strong>an</strong>d chromatogram peaks also detected <strong>in</strong> ur<strong>in</strong>e vapors were detected <strong>in</strong> ambient<br />
air with<strong>in</strong> the house. In bathrooms where toilets had been removed emissions from sewer pipes were tested<br />
as potential emission sources. The concentrations of targeted compounds with<strong>in</strong> the sewer pipes were low<br />
<strong>an</strong>d did not appear to be a source of odors with<strong>in</strong> the house. However, because of the large numbers of<br />
background peaks at these low concentration levels it is difficult to be certa<strong>in</strong> the peaks were actually<br />
metabolic compounds from ur<strong>in</strong>e without <strong>in</strong>dependent validation.<br />
Other sources of org<strong>an</strong>ic compounds, <strong>in</strong>vestigated at the site were fertilizers that had been used on the<br />
surround<strong>in</strong>g l<strong>an</strong>dscape <strong>an</strong>d shrubbery. Fertilizers did show trace amounts of the same org<strong>an</strong>ic compounds<br />
found <strong>in</strong> ur<strong>in</strong>e but their odor profile or chemical signature was dom<strong>in</strong>ated by other high concentration<br />
org<strong>an</strong>ic compounds, which were not detected <strong>in</strong> air outside or <strong>in</strong>side of the house. <strong>Odors</strong> from wood, which<br />
had been removed from the house <strong>an</strong>d stored <strong>in</strong> the garage, tested positive for ur<strong>in</strong>e contam<strong>in</strong>ation.<br />
Insulation <strong>an</strong>d drywall samples from the liv<strong>in</strong>g room air duct did not show ur<strong>in</strong>e contam<strong>in</strong>ation.<br />
Recommendations:<br />
1. Collection <strong>an</strong>d test<strong>in</strong>g of high volume air samples from with<strong>in</strong> the house us<strong>in</strong>g tenax absorption<br />
tubes. Split samples would allow <strong>in</strong>dependent validation.<br />
2. Implement on-site test<strong>in</strong>g protocol for measur<strong>in</strong>g the concentration of targeted org<strong>an</strong>ic compounds<br />
<strong>in</strong> ambient air with<strong>in</strong> the house.<br />
3. Determ<strong>in</strong>ation of acceptable target compound concentration levels for remediation.<br />
The zNose® is a new tool which provides environmental <strong>an</strong>d remediation eng<strong>in</strong>eers the speed, portability, precision,<br />
<strong>an</strong>d accuracy needed for cost-effective on-site odor measurements. Such measurements, because they are based<br />
upon well known chromatographic methods, c<strong>an</strong> easily be validated by <strong>in</strong>dependent laboratory test<strong>in</strong>g. Acceptable<br />
odor levels, determ<strong>in</strong>ed by tra<strong>in</strong>ed sensory p<strong>an</strong>els, c<strong>an</strong> be used to validate remediation efforts by objective <strong>an</strong>d<br />
qu<strong>an</strong>titative on-site test<br />
Detection of 2-Methylisoborneol <strong>an</strong>d Geosm<strong>in</strong> <strong>in</strong> Pond Water<br />
Us<strong>in</strong>g the zNose®