2013 Public Facilities Implementation Plan Update - City of Manteca
2013 Public Facilities Implementation Plan Update - City of Manteca
2013 Public Facilities Implementation Plan Update - City of Manteca

Create successful ePaper yourself
Turn your PDF publications into a flip-book with our unique Google optimized e-Paper software.
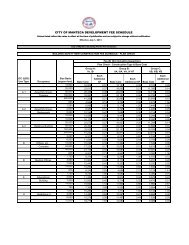
Table C-1<br />
<strong>City</strong> <strong>of</strong> <strong>Manteca</strong><br />
PFIP Storm Drainage Collection Fee<br />
Storm Drainage Fee Calculation Summary<br />
Zone 30 Zone 32 Zone 34 Zone 36 Zone 39<br />
Cost (31+32) Cost (33+34+35) Cost Cost Cost Source/<br />
Description Estimate Estimate Estimate Estimate Estimate Totals Notes<br />
PROJECT CONSTRUCTION COSTS<br />
Capital Improvements <strong>Plan</strong><br />
Current Projects -<br />
Future Projects 348,984<br />
Total Master <strong>Plan</strong> CIP (July 2010 $) 348,984<br />
S<strong>of</strong>t Costs (12% <strong>of</strong> Construction Costs) 41,878<br />
Inflation Adjustment to 2012 $ 21,214<br />
-<br />
2,219,860<br />
2,219,860<br />
266,383<br />
134,939<br />
-<br />
1,465,928<br />
1,465,928<br />
175,911<br />
89,109<br />
-<br />
7,282,301<br />
7,282,301<br />
873,876<br />
442,669<br />
-<br />
1,540,000<br />
1,540,000<br />
184,800<br />
93,612<br />
-<br />
12,857,074 Table C-4<br />
12,857,074<br />
1,542,849<br />
781,543<br />
Total PFIP CIP 412,076 2,621,182 1,730,949 8,598,847 1,818,412 15,181,465<br />
% <strong>of</strong> PFIP CIP 2.7% 17.3% 11.4% 56.6% 12.0% 100.0%<br />
See Note (4)<br />
See Note (1)<br />
FINANCING COSTS<br />
Total PFIP CIP 139,899 889,885 587,653 2,919,288 617,347 5,154,072 See Note (3)<br />
Total Estimated Financing Costs 139,899 889,885 587,653 2,919,288 617,347 5,154,072<br />
Finance Cost % <strong>of</strong> CIP 33.9% 33.9% 33.9% 33.9% 33.9% 33.9%<br />
PFIP ADMINISTRATION COSTS<br />
Program <strong>Update</strong>s and On-Going Admin 75,046<br />
<strong>City</strong> Administrative Costs - Variable -<br />
Total PFIP Admin Costs 75,046<br />
FUND BALANCES<br />
Net Fund Balance (Deficit) -<br />
Fees From Remaining PFIP Development -<br />
Total Fund Balances -<br />
Net Costs Funded From PFIP Fee 627,021<br />
Total Development Units (Acres x C) 796<br />
477,363<br />
-<br />
477,363<br />
(678,937)<br />
-<br />
(678,937)<br />
4,667,368<br />
315,236<br />
-<br />
315,236<br />
(486,480)<br />
-<br />
(486,480)<br />
3,120,318<br />
1,566,002<br />
-<br />
1,566,002<br />
(2,236,041)<br />
-<br />
(2,236,041)<br />
15,320,178<br />
331,165<br />
-<br />
331,165<br />
-<br />
-<br />
-<br />
2,766,923<br />
Fee Per Development Unit ($/Acres x C) $ 787 $ 9,521 $ 5,987 $ 14,590 $ 5,990<br />
Notes:<br />
(1) CIP costs based on July 2010 ENR (8844) were adjusted to July 2012 ENR (9324).<br />
(2) Assumes entire cost <strong>of</strong> current projects funded by 30 year debt service with 2.0% interest.<br />
(3) Assumes 100% <strong>of</strong> PFIP CIP costs are financed, see Table C-6 for financing assumptions.<br />
(4) Contingency estimate <strong>of</strong> 10% included in construction cost estimates, 12% s<strong>of</strong>t cost estimate from <strong>City</strong> <strong>of</strong> <strong>Manteca</strong>.<br />
(5) <strong>City</strong> Administrative Costs - Variable assumed to be 0.0% <strong>of</strong> PFIP CIP costs.<br />
490<br />
521<br />
1,050<br />
462<br />
2,764,813 See Appendix F<br />
-<br />
2,764,813<br />
See Note (5)<br />
(3,401,458) June 30, 2012 Balance<br />
-<br />
(3,401,458)<br />
26,501,808<br />
3,320