Orchard Groundcover Management - Amaya Atucha
Orchard Groundcover Management - Amaya Atucha
Orchard Groundcover Management - Amaya Atucha

You also want an ePaper? Increase the reach of your titles
YUMPU automatically turns print PDFs into web optimized ePapers that Google loves.
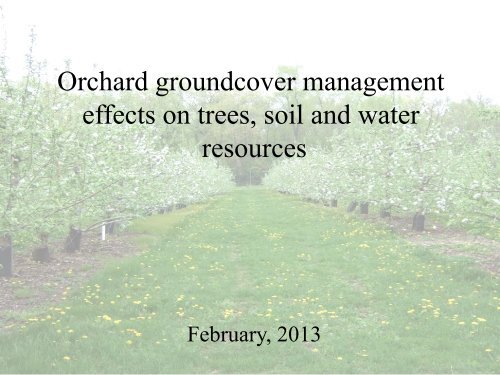
<strong>Orchard</strong> groundcover management<br />
effects on trees, soil and water<br />
resources<br />
February, 2013
Long-term studies of orchard groundcover<br />
management systems (GMSs)<br />
Effects on :<br />
ü Tree physiology and yields<br />
ü Soil physical, chemical and biological conditions<br />
ü Nutrient dynamics<br />
ü Agrochemical leaching and runoff
Long-term Effects of Four <strong>Groundcover</strong> <strong>Management</strong> Systems in an<br />
NY Apple <strong>Orchard</strong>
Objective<br />
To determine the impacts of various GMS<br />
treatments on tree growth, nutrition, and<br />
production and to ascertain the effects of various<br />
GMS treatments on soil physical and edaphic<br />
conditions over several decades.
Pre-emergence<br />
Post-emergence<br />
Sod Bark Mulch
Cumulative TCSA (cm²)<br />
200<br />
180<br />
160<br />
140<br />
120<br />
100<br />
80<br />
60<br />
40<br />
20<br />
0<br />
1992<br />
**<br />
1993<br />
**<br />
1994<br />
*<br />
1995<br />
1996<br />
Tree growth<br />
1997<br />
1998<br />
*<br />
1999<br />
**<br />
2000<br />
*<br />
2001<br />
**<br />
2002<br />
*<br />
2003<br />
PreHerb PostHerb Sod Mulch<br />
Letters in columns represent mean separation using Tukey’s honestly significant difference (HDS) at ** P≤0.05 or * 0.1<br />
**<br />
2004<br />
**<br />
2005<br />
**<br />
2006<br />
**<br />
2007<br />
**<br />
2008
Letters in columns represent mean separation using Tukey’s honestly significant difference (HDS) at P≤ 0.05
Fruit Yield (kg·tree -1 )<br />
120.0<br />
100.0<br />
80.0<br />
60.0<br />
40.0<br />
20.0<br />
0.0<br />
**<br />
1994<br />
**<br />
1995<br />
**<br />
1996<br />
1997<br />
**<br />
1998<br />
Fruit Yield<br />
*<br />
1999<br />
2000<br />
*<br />
2001<br />
2002<br />
**<br />
2003<br />
2004<br />
PreHerb PostHerb Sod Mulch<br />
Letters in columns represent mean separation using Tukey’s honestly significant difference (HDS) at ** P≤0.05 or * 0.1<br />
2005<br />
2006<br />
2007<br />
2008
Long-term effects of GMSs treatments on soil nutrient availability (kg/ha)<br />
and pH.<br />
Variable 1992 1993 1995 2000 2005 2006 2007<br />
NO־³<br />
PreHerb 11.4 47.7 a 19.5 13.1 b N/D N/D 2.6 b<br />
PostHerb 11.2 24.6 ab 8.7 12.7 b 5.4 b<br />
Sod 10.8 11.0 b 2.6 12.7 b 4.0 b<br />
Mulch 11.2 11.1 b 4.8 15.7 a 23.9 a<br />
P<br />
PreHerb 1.2 3.2 a 2.8 a 7.1 b 2.1 b 2.2 1.0 b<br />
PostHerb 1.4 2.8 ab 0.7 ab 6.0 b 2.1 b 2.4 1.6 b<br />
Sod 1.0 1.5 b 0.3 b 3.7 b 3.2 b 1.9 1.2 b<br />
Mulch 1.3 2.7 ab 1.1 ab 16.4 a 22.0 a 7.1 10.0 a<br />
K<br />
PreHerb 122.3 ab 169.5 ab 74.4 ab 375.2 410.2 ab 249.0 190.5<br />
PostHerb 127.5 ab 191.3 ab 74.3 ab 317.3 328.5 b 207.8 214.5<br />
Sod 106.5 b 148.5 b 56.1 b 306.1 420.5 ab 193.5 192.0<br />
Mulch 158.3 a 200.3 a 93.9 a 388.3 595.4 a 264.0 299.3<br />
Ca<br />
PreHerb 4041.0 4733.3 2028.1 3124.8 b 3216.7 b 3620.3 b 3364.5 b<br />
PostHerb 3192.8 4284.0 1509.0 2639.5 b 3191.3 b 3551.3 b 3060.8 b<br />
Sod 3291.0 4107.0 1525.0 2284.8 b 3086.8 b 3276.8 b 3087.0 b<br />
Mulch 4935.0 4700.3 1760.7 5730.7 a 12799.0 a 8248.5 a 9559.5 a<br />
Mg<br />
PreHerb 682.7 912.4 a 418.5 957.6 898.8 810.1 a 862.3<br />
PostHerb 597.4 857.3 ab 367.6 767.2 792.9 772.3 a 805.8<br />
Sod 629.0 799.8 ab 353.2 774.7 889.1 690.5 ab 805.1<br />
Mulch 612.5 705.0 b 342.3 643.7 988.1 544.7 b 760.1<br />
Mn<br />
PreHerb 38.6 27.7 b 71.3 b 234.1 58.4 b 44.6 b 26.9 b<br />
PostHerb 36.0 30.0 b 76.0 b 154.6 44.7 b 40.2 b 32.7 b<br />
Sod 31.7 32.0 b 81.8 ab 121.7 54.6 b 35.1 b 29.5 b<br />
Mulch 47.0 48.6 a 108.0 a 185.5 117.5 a 75.2 a 63.5 a<br />
pH<br />
PreHerb 6.9 7.1 7.1 5.9 6.9 bc 6.8 bc 7.1 ab<br />
PostHerb 6.9 7.2 7.0 5.9 7.0 ab 7.0 ab 6.9 b<br />
Sod 7.1 7.2 7.0 5.8 6.6 c 6.6 c 6.8 b<br />
Mulch 6.7 7.4 7.0 6.4 7.4 a 7.2 a 7.5 a<br />
Letters in columns represent mean separation using Tukey’s honestly significant difference (HDS) at P≤ 0.05
Percent nitrogen (N), percent carbon (C), and C-to-N ratio in soil<br />
Letters in columns represent mean separation using Tukey’s honestly significant difference (HDS) at P≤ 0.05
Yao et al. (2005) <strong>Orchard</strong> floor management prac7ces that maintain vegeta7ve or biomass groundcover s7mulate soil<br />
microbial ac7vity and alter soil microbial community composi7on. Plant and Soil. 271:377-‐389
Oliveira et al. (2001) Soil physical condi7ons in a New York orchard aLer eight years under<br />
different groundcover management systems. Plant and Soil. 234: 233-‐237
• Total soil nitrogen (N) and carbon (C) content, C-to-N<br />
ratios, and essential plant nutrients were much higher in<br />
the Mulch soil after 16 years of treatments.<br />
• Deterioration of soil physical properties, biological<br />
activity, and soil fertility in weed-free plots.<br />
• Post-emergence herbicides that reduce weed competition<br />
during summer month may offer an optimal combination<br />
of weed suppression and soil conservation.
Nutrient Cycling and Budgets under Four <strong>Groundcover</strong> <strong>Management</strong><br />
Systems (GMSs) in a NY Apple <strong>Orchard</strong>
Objective<br />
• To measure and budget the major inputs and<br />
outputs of N in an orchard after 15 years under<br />
four different GMSs, with and without soil-<br />
applied N fertilizer applications.
Nitrogen Budget<br />
INPUTS INTERNAL<br />
FLUXES<br />
Fertilization<br />
Irrigation and<br />
precipitation<br />
water N<br />
Bark mulch<br />
Recycling surface<br />
vegetation<br />
Leaf litter fall<br />
Pruned wood<br />
Soil N mineralization<br />
OUTPUTS<br />
Harvested fruit<br />
Subsurface leaching<br />
Surface Runoff
Litter decomposition study<br />
• Litter samples: apple leaves,<br />
fallen immature fruits and<br />
surface vegetation.<br />
• 3 bags with 40 g of litter<br />
were placed under the tree<br />
canopy<br />
• Bags were removed after 6,<br />
12 and 18 weeks and<br />
analyzed to determine C:N
Nitrogen Budget<br />
INPUTS INTERNAL<br />
FLUXES<br />
Fertilization<br />
Irrigation and<br />
precipitation<br />
water<br />
Recycling surface<br />
vegetation<br />
Leaf litter fall<br />
Pruned wood<br />
Soil Mineralization<br />
OUTPUTS<br />
Harvest fruit<br />
Subsurface leaching<br />
Surface Runoff
Leaf litter fall
Nitrogen Budget<br />
INPUTS INTERNAL<br />
FLUXES<br />
Fertilization<br />
Irrigation and<br />
precipitation<br />
water<br />
Recycling surface<br />
vegetation<br />
Leaf litter fall<br />
Pruned wood<br />
Soil Mineralization<br />
OUTPUTS<br />
Harvest fruit<br />
Subsurface leaching<br />
Surface Runoff
PreHerb<br />
PostHerb<br />
Mowed Sod<br />
Mulch<br />
Sub-‐surface water collec9on sta9on<br />
Surface water collec9on sta9on<br />
Tree (Empire on M.9/111)<br />
<strong>Orchard</strong> OuElow<br />
4” Perforated plot collec9on 9le<br />
4” Solid 9le to collec9on sta9on<br />
4” Perimeter isola9on 9le<br />
Surface water collec9on 9le<br />
Outline of the experimental site (DTS) at Lansing Source: M G Brown, 2005
Nitrogen Budget<br />
INPUTS INTERNAL<br />
FLUXES<br />
Fertilization<br />
Irrigation and<br />
precipitation<br />
water<br />
Recycling surface<br />
vegetation<br />
Leaf litter fall<br />
Pruned wood<br />
Soil Mineralization<br />
OUTPUTS<br />
Harvest fruit<br />
Subsurface leaching<br />
Surface Runoff
Results
g N / kg of biomass<br />
35<br />
30<br />
25<br />
20<br />
15<br />
10<br />
5<br />
0<br />
Nitrogen mineralization from groundcover<br />
litter decomposition<br />
32 66 96<br />
2005<br />
days<br />
PreHerb PostHerb Sod Mulch<br />
g N / kg of biomass<br />
35<br />
30<br />
25<br />
20<br />
15<br />
10<br />
5<br />
0<br />
42 84 126<br />
2007<br />
PreHerb PostHerb Sod Mulch<br />
days
Average nitrate-N (NO 3 -N) concentration (mg L –1 ) in<br />
runoff and leachate samples collected from<br />
June to Nov. 2005 and 2007<br />
Treatment<br />
Runoff N Concentration<br />
(mg L -1 )<br />
Leachate N Concentration<br />
(mg L -1 )<br />
June-November June-November<br />
2005 2007 2005 2007<br />
PreHerb 5.8 a 4.6 ns 4.1 b 0.6 b<br />
PostHerb 3.1 ab 2.6 13.0 a 0.8 b<br />
Mulch 1.6 b 5.5 10.0 ab 1.6 a<br />
Sod 1.9 b 3.8 12.8 a 1.0 b<br />
Letters in columns represent mean separation using Tukey’s honestly significant difference (HDS) at P≤ 0.05
Water flows (L·m -2 ) from surface runoff and sub-surface<br />
leaching during May-Dec. of 2005 and 2007<br />
Treatment<br />
Surface Runoff Water<br />
(L·m -2 )<br />
May-Dec<br />
Sub-surface Leaching Water<br />
(L·m -2 )<br />
May-Dec<br />
2005 2007 2005 2007<br />
PreHerb 11.6 b 32.9 ab 34.2 ns 44.7 b<br />
PostHerb 30.7 a 87.9 a 47.7 41.5 ab<br />
Mulch 6.7 b 6.6 b 53.5 61.7 a<br />
Sod 21.0 ab 36.6 ab 42.3 51.4 ab<br />
Letters in columns represent mean separation using Tukey’s honestly significant difference (HDS) at P≤ 0.05
A. EXTERNAL INPUTS<br />
PreHerb<br />
(kg N·ha - 1·yr -1 )<br />
<strong>Groundcover</strong> <strong>Management</strong> Systems (GMSs)<br />
PostHerb<br />
(kg N·ha - 1·yr -1 )<br />
Sod<br />
(kg N·ha - 1·yr -1 )<br />
Mulch<br />
(kg N·ha - 1·yr -1 )<br />
2005 2007 2005 2007 2005 2007 2005 2007<br />
Fertilizer application 60.0 0 60.0 0 60.0 0 60.0 0<br />
Mulch Biomass N 0 0 0 0 0 0 169.2 84.6<br />
Rain water 0.9 1.2 0.9 1.2 0.9 1.2 0.9 1.2<br />
Irrigation Water 1.8 0.03 1.8 0.03 1.8 0.03 1.8 0.03<br />
Total Inputs 62.7 1.23 62.7 1.23 62.7 1.23 231.9 85.3<br />
B. INTERNAL FLUXES<br />
Recycling surface vegetation 15.1 19.5 20.9 21.5 23.6 29.9 25.1 24.4<br />
Soil Mineralization 11.2 12.3 13.5 14.1 14.8 17.2 17.8 18.9<br />
Leaf litter Fall 16.4 10.7 11.6 14.2 10.3 17.9 10.3 15.9<br />
Pruned wood 4.1 11.5 5.6 13.2 4.8 14.5 5.2 14.9<br />
Total internal fluxes 46.8 54.0 51.6 63.0 53.5 79.5 58.4 74.1<br />
C. OUTPUTS<br />
Harvested fruit* 69.3 57.3 82.2 70.3 54.9 61.0 80.9 78.0<br />
Surface runoff 4.0 13.5 3.1 20.8 1.4 12.8 1.2 11.1<br />
Subsurface leaching 16.1 5.2 18.9 5.2 16.1 5.9 20.9 7.4<br />
Total outputs 89.4 76.0 104.2 96.3 72.4 79.7 103.0 96.5<br />
BALANCE= (A+B)-C 20.1 -20.8 10.1 -32.1 43.8 1.1 187.3 62.9
• Soil N mineralization and recycling groundcover biomass<br />
accounted for over 60% of internal fluxes in both years.<br />
• Harvested fruit represented > 70% of N outputs in both years.<br />
• Most N losses occurred through leaching rather than runoff,<br />
regardless of GMS.<br />
• Positive balance for N supply in Sod and Mulch at this orchard<br />
• Potential long-term problems with N leaching in orchards that<br />
receive high annual inputs of compost, biomass mulch, or<br />
other organic nutrient sources.<br />
• N deficit in both herbicide GMSs without N fertilizer inputs,<br />
because of reduced internal N cycling in these GMSs
Ques7ons