Investigation of Solid Solution Hardening in Molybdenum Alloys
Investigation of Solid Solution Hardening in Molybdenum Alloys
Investigation of Solid Solution Hardening in Molybdenum Alloys

You also want an ePaper? Increase the reach of your titles
YUMPU automatically turns print PDFs into web optimized ePapers that Google loves.
RM 18/10 17th Plansee Sem<strong>in</strong>ar 2009, Vol. 1 Wesemann, H<strong>of</strong>fmann et al.<br />
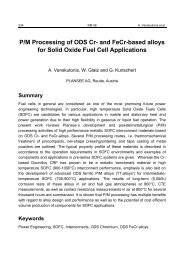
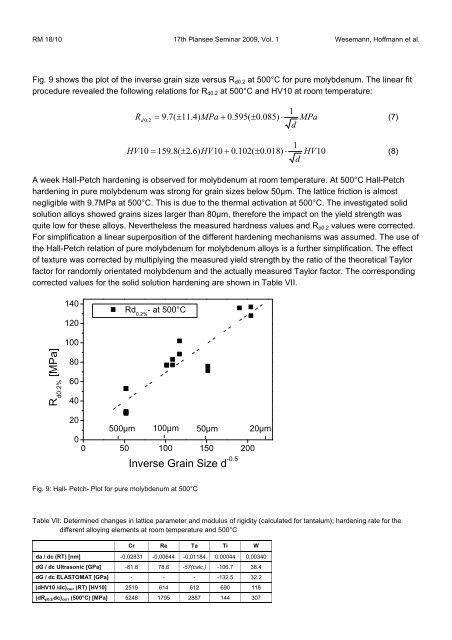
Fig. 9 shows the plot <strong>of</strong> the <strong>in</strong>verse gra<strong>in</strong> size versus Rd0.2 at 500°C for pure molybdenum. The l<strong>in</strong>ear fit<br />
procedure revealed the follow<strong>in</strong>g relations for Rd0.2 at 500°C and HV10 at room temperature:<br />
Rd 0.<br />
2<br />
1<br />
= 9.<br />
7(<br />
± 11.<br />
4)<br />
MPa + 0.<br />
595(<br />
± 0.<br />
085)<br />
⋅ MPa<br />
(7)<br />
d<br />
1<br />
HV10 = 159.<br />
8(<br />
± 2.<br />
6)<br />
HV10<br />
+ 0.<br />
102(<br />
± 0.<br />
018)<br />
⋅ HV10<br />
(8)<br />
d<br />
A week Hall-Petch harden<strong>in</strong>g is observed for molybdenum at room temperature. At 500°C Hall-Petch<br />
harden<strong>in</strong>g <strong>in</strong> pure molybdenum was strong for gra<strong>in</strong> sizes below 50µm. The lattice friction is almost<br />
negligible with 9.7MPa at 500°C. This is due to the thermal activation at 500°C. The <strong>in</strong>vestigated solid<br />
solution alloys showed gra<strong>in</strong>s sizes larger than 80µm, therefore the impact on the yield strength was<br />
quite low for these alloys. Nevertheless the measured hardness values and Rp0.2 values were corrected.<br />
For simplification a l<strong>in</strong>ear superposition <strong>of</strong> the different harden<strong>in</strong>g mechanisms was assumed. The use <strong>of</strong><br />
the Hall-Petch relation <strong>of</strong> pure molybdenum for molybdenum alloys is a further simplification. The effect<br />
<strong>of</strong> texture was corrected by multiply<strong>in</strong>g the measured yield strength by the ratio <strong>of</strong> the theoretical Taylor<br />
factor for randomly orientated molybdenum and the actually measured Taylor factor. The correspond<strong>in</strong>g<br />
corrected values for the solid solution harden<strong>in</strong>g are shown <strong>in</strong> Table VII.<br />
R d0.2% [MPa]<br />
140<br />
120<br />
100<br />
80<br />
60<br />
40<br />
Rd - at 500°C<br />
0.2% at 500°C<br />
20<br />
500µm 100µm 50µm 20µm<br />
0<br />
0 50 100 150 200<br />
Inverse Gra<strong>in</strong> Size d -0.5<br />
Fig. 9: Hall- Petch- Plot for pure molybdenum at 500°C<br />
Table VII: Determ<strong>in</strong>ed changes <strong>in</strong> lattice parameter and modulus <strong>of</strong> rigidity (calculated for tantalum); harden<strong>in</strong>g rate for the<br />
different alloy<strong>in</strong>g elements at room temperature and 500°C<br />
Cr Re Ta Ti W<br />
da / dc (RT) [nm] -0,02831 -0,00644 -0,01184 0.00044 0,00340<br />
dG / dc Ultrasonic [GPa] -81.8 78.6 -57(calc.) -106.7 38.4<br />
dG / dc ELASTOMAT [GPa] - - - -132.5 32.2<br />
(dHV10 /dc)corr (RT) [HV10] 2519 614 612 690 118<br />
(dRp0.2/dc)corr (500°C) [MPa] 5248 1795 2887 144 307