Investigation of Solid Solution Hardening in Molybdenum Alloys
Investigation of Solid Solution Hardening in Molybdenum Alloys
Investigation of Solid Solution Hardening in Molybdenum Alloys

Create successful ePaper yourself
Turn your PDF publications into a flip-book with our unique Google optimized e-Paper software.
Wesemann, H<strong>of</strong>fmann et al. 17th Plansee Sem<strong>in</strong>ar 2009, Vol. 1 RM 18/1<br />
Abstract<br />
<strong>Investigation</strong> <strong>of</strong> <strong>Solid</strong> <strong>Solution</strong> <strong>Harden<strong>in</strong>g</strong> <strong>in</strong> <strong>Molybdenum</strong> <strong>Alloys</strong><br />
I. Wesemann*, A. H<strong>of</strong>fmann*, T. Mrotzek**, U. Mart<strong>in</strong>***<br />
* PLANSEE Metall GmbH, Austria<br />
** PLANSEE SE, Austria<br />
*** Technische Universität Bergakademie Freiberg, Germany<br />
Mechanical properties <strong>of</strong> pure molybdenum like yield strength, hardness and creep strength can be<br />
modified by alloy<strong>in</strong>g elements. The alteration <strong>of</strong> properties can be described as a result <strong>of</strong> different<br />
mechanisms like solid solution harden<strong>in</strong>g (SSH), particle as well as gra<strong>in</strong> boundary harden<strong>in</strong>g. The aim<br />
<strong>of</strong> this work is to quantify the solid solution harden<strong>in</strong>g effect <strong>of</strong> different solutes. Therefore the <strong>in</strong>fluences<br />
<strong>of</strong> other strength affect<strong>in</strong>g mechanisms like gra<strong>in</strong> boundary harden<strong>in</strong>g or particle harden<strong>in</strong>g have been<br />
excluded. Based on the powder metallurgical manufactur<strong>in</strong>g route different molybdenum alloys with Cr,<br />
Re, Ta, Ti or W additions were prepared. Vickers hardness measurements at room temperature and<br />
tensile tests at 500°C were performed to quantify the harden<strong>in</strong>g effect. Additionally the modulus <strong>of</strong><br />
rigidity was measured by ultrasonic <strong>in</strong>spection and the dynamical resonance method. Lattice parameters<br />
were measured by means <strong>of</strong> X-ray diffraction experiments. Apply<strong>in</strong>g exist<strong>in</strong>g theories <strong>of</strong> solid solution<br />
harden<strong>in</strong>g an attempt was made to separate and quantify dielastic and parelastic effects.<br />
Keywords<br />
<strong>Molybdenum</strong> alloy, solid solution harden<strong>in</strong>g, chromium, rhenium, tantalum, titanium, tungsten, Hall-<br />
Petch harden<strong>in</strong>g, Labusch, Fleischer, Suzuki, modell<strong>in</strong>g, lattice parameter, modulus <strong>of</strong> rigidity<br />
Introduction<br />
Ow<strong>in</strong>g to their outstand<strong>in</strong>g comb<strong>in</strong>ation <strong>of</strong> high temperature properties like high melt<strong>in</strong>g po<strong>in</strong>t, low vapour<br />
pressure and high temperature strength molybdenum and its alloys have been <strong>in</strong> focus for a variety <strong>of</strong><br />
applications for several decades.<br />
Extensive work on the development <strong>of</strong> molybdenum based alloys was done <strong>in</strong> the 1950`s and 1960`s by<br />
several authors [1–4]. Most <strong>of</strong> the work was done with respect to technological properties like hardness,<br />
tensile strength, workability and ductile to brittle transition temperature. However, reliable <strong>in</strong>formation<br />
about solid solution effects are rare. Some authors provide <strong>in</strong>formation about parelastic <strong>in</strong>teraction <strong>of</strong> the<br />
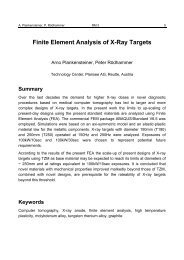
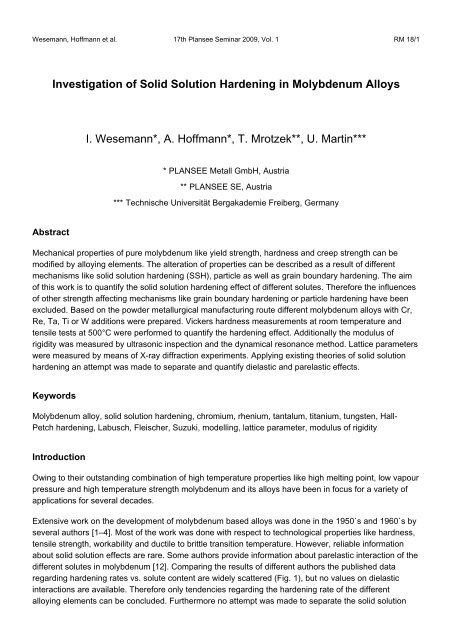
different solutes <strong>in</strong> molybdenum [12]. Compar<strong>in</strong>g the results <strong>of</strong> different authors the published data<br />
regard<strong>in</strong>g harden<strong>in</strong>g rates vs. solute content are widely scattered (Fig. 1), but no values on dielastic<br />
<strong>in</strong>teractions are available. Therefore only tendencies regard<strong>in</strong>g the harden<strong>in</strong>g rate <strong>of</strong> the different<br />
alloy<strong>in</strong>g elements can be concluded. Furthermore no attempt was made to separate the solid solution
RM 18/2 17th Plansee Sem<strong>in</strong>ar 2009, Vol. 1 Wesemann, H<strong>of</strong>fmann et al.<br />
harden<strong>in</strong>g from the other strength <strong>in</strong>fluenc<strong>in</strong>g effects like particle harden<strong>in</strong>g, gra<strong>in</strong> boundary harden<strong>in</strong>g<br />
and texture. Comparable <strong>in</strong>formation about sample homogeneity and chemical composition is not<br />
available, too.<br />
<strong>Harden<strong>in</strong>g</strong> rate <strong>of</strong> Vickers hardness per 1at.% solute<br />
350<br />
300<br />
250<br />
200<br />
150<br />
100<br />
50<br />
0<br />
Semchyshen [2]<br />
Jaffee [1]<br />
Stephens & Witzke [3]<br />
Seigle [4]<br />
W V Re Ti Ta Al Cr Os Nb Zr Ir Fe Si Pt Co Ni Hf<br />
Alloy<strong>in</strong>g Element<br />
Fig. 1: Vickers hardness <strong>in</strong>crease per atomic % solutes reported by different authors [1] – [4]<br />
An <strong>in</strong>creas<strong>in</strong>g demand for tailored molybdenum alloys requires detailed <strong>in</strong>formation about the<br />
effectiveness <strong>of</strong> the <strong>in</strong>dividual strength <strong>in</strong>creas<strong>in</strong>g mechanisms <strong>in</strong> molybdenum. To make precise<br />
predictions about SSH <strong>in</strong> tailored molybdenum alloys it is <strong>in</strong>dispensable to know parelastic and dielastic<br />
<strong>in</strong>teractions result<strong>in</strong>g from the different solutes. Theories from Fleischer, Labusch and Suzuki try to<br />
expla<strong>in</strong> these two <strong>in</strong>teractions. Only little <strong>in</strong>formation is available which theory is most suitable for<br />
describ<strong>in</strong>g the SSH <strong>in</strong> molybdenum alloys.<br />
Therefore one major task <strong>of</strong> this work was to provide and <strong>in</strong>vestigate well def<strong>in</strong>ed solid solution alloys.<br />
Special attention was paid to the sample homogeneity <strong>of</strong> the solutes, presence <strong>of</strong> particles and the level<br />
<strong>of</strong> <strong>in</strong>terstitial impurities. The sample preparation is based on a powder metallurgical manufactur<strong>in</strong>g route.<br />
The amount <strong>of</strong> other non avoidable strength <strong>in</strong>fluenc<strong>in</strong>g mechanism like gra<strong>in</strong> size and texture has to be<br />
quantified and separated.<br />
Another object <strong>of</strong> the work was the comparison <strong>of</strong> different models describ<strong>in</strong>g SSH <strong>in</strong> molybdenum. After<br />
determ<strong>in</strong>ation <strong>of</strong> the <strong>in</strong>crease <strong>in</strong> strength caused by solid solution harden<strong>in</strong>g as well as the parelastic and<br />
dielastic <strong>in</strong>teraction parameters <strong>of</strong> the different theories were verified with respect to the best match<br />
between measured and calculated <strong>in</strong>crease <strong>of</strong> strength.<br />
Theoretical Considerations<br />
The strength <strong>of</strong> metals can be modified by work harden<strong>in</strong>g, solute atoms, gra<strong>in</strong> size, particles and the<br />
texture. In general a l<strong>in</strong>ear superposition <strong>of</strong> these strength determ<strong>in</strong><strong>in</strong>g mechanisms is assumed for pure<br />
metals.
Wesemann, H<strong>of</strong>fmann et al. 17th Plansee Sem<strong>in</strong>ar 2009, Vol. 1 RM 18/3<br />
SSH results from <strong>in</strong>teractions between solute atoms and dislocations. These <strong>in</strong>teractions can be<br />
classified <strong>in</strong> parelastic <strong>in</strong>teractions, dielastic <strong>in</strong>teractions, <strong>in</strong>teractions result<strong>in</strong>g from atomic order<strong>in</strong>g,<br />
chemical effects and <strong>in</strong>teractions result<strong>in</strong>g <strong>in</strong> changes <strong>of</strong> the local electronic structure [5-6]. The<br />
parelastic <strong>in</strong>teraction is a result <strong>of</strong> the <strong>in</strong>teraction between the dilatation <strong>of</strong> the lattice near the solute<br />
atom and the dilatation around the stress field <strong>of</strong> a dislocation. The parelastic <strong>in</strong>teraction δ is best<br />
described by the change <strong>of</strong> the lattice constant with solute alloy<strong>in</strong>g content c [7]:<br />
da<br />
a dc<br />
⋅<br />
1<br />
δ = (1)<br />
Accord<strong>in</strong>g to R. L. Fleischer [7] the dielastic <strong>in</strong>teraction is a result <strong>of</strong> local changes <strong>of</strong> bond<strong>in</strong>g energies<br />
between the solute atom and the matrix. They are best quantified by the change <strong>of</strong> the modulus <strong>of</strong><br />
rigidity G with alloy<strong>in</strong>g content c [6].<br />
η<br />
dG<br />
η′<br />
= , with<br />
1<br />
G dc<br />
1+ η<br />
2<br />
⋅<br />
1<br />
η = (2)(3)<br />
Interactions like atom order<strong>in</strong>g, chemical effects or changes <strong>of</strong> the local electron structure are very<br />
difficult to measure and not to quantify as easy as the parelastic solid solution harden<strong>in</strong>g effect. A useful<br />
review about these <strong>in</strong>teractions can be found <strong>in</strong> [6].<br />
For the modell<strong>in</strong>g <strong>of</strong> SSH the theories <strong>of</strong> Fleischer, Labusch and Suzuki have been established [9].<br />
These theories can be summarized by one simple formula (4). The contribution <strong>of</strong> solid solution<br />
harden<strong>in</strong>g τc to the total critical shear strength depends on the concentration c, the exponent p, a<br />
harden<strong>in</strong>g parameter ε and the exponent q <strong>in</strong> case <strong>of</strong> Fleischer and Labusch [6]. The parameter ε is a<br />
comb<strong>in</strong>ation <strong>of</strong> δ and η´ and a parameter α which assess δ and η´. Suzuki def<strong>in</strong>es an <strong>in</strong>teraction energy<br />
EW <strong>in</strong>stead <strong>of</strong> ε which also <strong>in</strong>corporates parelastic and dielastic <strong>in</strong>teractions. It should be noted that a<br />
different parameter η´´ is def<strong>in</strong>ed. This parameter considers a non l<strong>in</strong>ear superposition<strong>in</strong>g <strong>of</strong> parelastic<br />
and dielastic <strong>in</strong>teractions and requires an additional material constant based on measurements for iron<br />
[8]. In addition the modulus <strong>of</strong> rigidity at room temperature G0 and the modulus <strong>of</strong> rigidity G(T) at certa<strong>in</strong><br />
temperature T have to be determ<strong>in</strong>ed for the calculation <strong>of</strong> EW. A special feature <strong>of</strong> the theory by Suzuki<br />
is the consideration <strong>of</strong> the temperature dependency. For simplification H. Hattendorf und R. Büchner<br />
have simplified the complex system <strong>of</strong> non l<strong>in</strong>ear equations by Suzuki [10].<br />
τ ~ const G(T) ε c<br />
c<br />
p q<br />
⋅ ⋅ ⋅ [13] (4)
RM 18/4 17th Plansee Sem<strong>in</strong>ar 2009, Vol. 1 Wesemann, H<strong>of</strong>fmann et al.<br />
Table I: Overview <strong>of</strong> parameters and boundary conditions for the different theories describ<strong>in</strong>g SSH<br />
Parameter: Fleischer: Labusch: Suzuki:<br />
ε, Ew F<br />
p, q, Z<br />
τ c<br />
Boundary<br />
conditions<br />
ε = η′ + αδ * 2 2 2<br />
ε = η′<br />
+ α δ<br />
p = 3/2;<br />
q = 1/2;<br />
ZF = 760<br />
L<br />
p = 4/3;<br />
q = 2/3;<br />
ZL = 550<br />
E W<br />
G(<br />
T )<br />
= 0.<br />
122eV<br />
( 1.<br />
52δ<br />
+ η′<br />
′ ) ⋅<br />
G<br />
p = 2;<br />
q = 1<br />
2<br />
3<br />
1<br />
2<br />
1<br />
1 4<br />
Ew ⋅ c<br />
2<br />
2<br />
3<br />
τ cF = Gε<br />
F c τ G 3<br />
cL = ε L c<br />
τ cS = 3<br />
Z F<br />
Z<br />
kTb<br />
L<br />
b… Burgers vector<br />
T = 0K;<br />
c < 0.1%<br />
T = 0K;<br />
c > 0.1% possible<br />
T > 0K possible<br />
c > 0.1% possible<br />
valid for b.c.c. iron<br />
Reference [6, 8] [8] [8, 10]<br />
* for screw dislocations [14]<br />
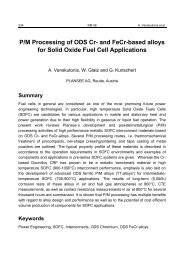
Sample Preparation<br />
Alloy<strong>in</strong>g elements were selected with respect to the solubility limits <strong>in</strong> the molybdenum matrix, the<br />
availability and the limits were implied by the powder metallurgical manufactur<strong>in</strong>g route. Other important<br />
factors are chemical stability <strong>of</strong> the alloy<strong>in</strong>g elements dur<strong>in</strong>g the s<strong>in</strong>ter<strong>in</strong>g process <strong>in</strong> a hydrogen<br />
atmosphere, density after s<strong>in</strong>ter<strong>in</strong>g and sufficient deformability after s<strong>in</strong>ter<strong>in</strong>g <strong>in</strong> order to produce<br />
samples with a relative density >99.5%.<br />
Accord<strong>in</strong>g to these requirements molybdenum alloys with 0.5-3.0% chromium, 0.5 -5.0% rhenium, 0.5-<br />
3.0% tantalum, 0.5-4.0% titanium and 1.0-18.3% tungsten were produced by the manufactur<strong>in</strong>g route as<br />
listed <strong>in</strong> Fig. 2. All compositions are given on atomic percent.<br />
<strong>Molybdenum</strong> powder (Fischer Sub Sieve Size FSSS=4.7µm) was blended together with commercial<br />
available powders <strong>of</strong> chromium (FSSS
Wesemann, H<strong>of</strong>fmann et al. 17th Plansee Sem<strong>in</strong>ar 2009, Vol. 1 RM 18/5<br />
Fig. 2: Powder metallurgical manufactur<strong>in</strong>g route for the preparation <strong>of</strong> the molybdenum alloys<br />
Characterisation<br />
powder mix<strong>in</strong>g<br />
cold isostatic press<strong>in</strong>g (2000 bar)<br />
s<strong>in</strong>ter<strong>in</strong>g (2000-2300°C)<br />
forg<strong>in</strong>g <strong>in</strong> several steps<br />
φtotal = 1,5<br />
forg<strong>in</strong>g and <strong>in</strong>termediate anneal<strong>in</strong>g at T= 1300°C -1500°C<br />
solution anneal<strong>in</strong>g 2000 -2300°C /24 h<br />
Ti, Cr: T = 2100°C<br />
Ta, Re, W: T = 2300°C<br />
Ta, Ti, Re: φ<strong>in</strong>d = 0.25 T = 1300°C<br />
Cr, W: φ<strong>in</strong>d = 0.17 T = 1500°C<br />
Cr: T = 2000°C<br />
Ta, Ti, Re, W: T = 2300°C<br />
After the 24h f<strong>in</strong>al heat treatment the density, chemical composition, homogeneity <strong>of</strong> the solute, gra<strong>in</strong><br />
size and texture <strong>of</strong> the samples were <strong>in</strong>vestigated. The mean gra<strong>in</strong> size was determ<strong>in</strong>ed follow<strong>in</strong>g ASTM<br />
E112-96. The total amount <strong>of</strong> alloy<strong>in</strong>g elements was determ<strong>in</strong>ed by means <strong>of</strong> Inductively Coupled<br />
Plasma Optical Atom Emission Spectrometry (ICP-OES) for chromium, tantalum, titanium and tungsten<br />
and X-Ray Fluorescent Analysis (XFA) for rhenium. The <strong>in</strong>terstitial elements oxygen, nitrogen and<br />
hydrogen were determ<strong>in</strong>ed by Carrier Gas Hot Extraction (CE). Combustion Analyses (CA) was used for<br />
carbon. The distribution <strong>of</strong> the alloy<strong>in</strong>g elements after the solution anneal<strong>in</strong>g was characterised by<br />
Electron Probe Micro Analyser (EPMA) l<strong>in</strong>e scans with a step size <strong>of</strong> 10 µm on a total length <strong>of</strong> 3000 µm<br />
at the TUBA Freiberg on a JOEL JXA 8900RL. Taylor factors were determ<strong>in</strong>ed from Electron Back<br />
Scatter Diffraction (EBSD) measurements <strong>of</strong> selected samples. The equipment was a LEO Gem<strong>in</strong>i 1530<br />
FEG <strong>in</strong> comb<strong>in</strong>ation with a HKL NORDLYS detector system. The analyzed area was 4 mm x 2.4 mm <strong>in</strong><br />
transversal direction <strong>of</strong> the tensile specimen.<br />
Mechanical characterization at room temperature was done by Vickers hardness HV10 measurement.<br />
Tensile tests could not be performed at room temperature because <strong>of</strong> elastic fracture <strong>of</strong> the alloys. At<br />
−3<br />
−1<br />
500°C tensile tests with a stra<strong>in</strong> rate <strong>of</strong> ε& = 2.<br />
0 ⋅10<br />
s were performed with a ZWICK-MAYTEC RMC<br />
100 test<strong>in</strong>g device.<br />
In order to determ<strong>in</strong>e the parelastic <strong>in</strong>teraction lattice parameters were determ<strong>in</strong>ed. The measurement<br />
was done <strong>in</strong> θ / 2θ mode with a step width <strong>of</strong> 0.02° us<strong>in</strong>g a CuKα radiation at 40kV / 30mA. For<br />
monochromatisation a carbon monochromator was used. The large gra<strong>in</strong> size after f<strong>in</strong>al solution<br />
anneal<strong>in</strong>g caused a pseudo texture effect by a low number <strong>of</strong> reflexes. Therefore the sample position<br />
was shifted <strong>in</strong> order to have at least 4 reflexes.
RM 18/6 17th Plansee Sem<strong>in</strong>ar 2009, Vol. 1 Wesemann, H<strong>of</strong>fmann et al.<br />
The effect <strong>of</strong> dielastic <strong>in</strong>teraction was characterised by the measurement <strong>of</strong> change <strong>in</strong> modulus <strong>of</strong><br />
rigidity. The modulus <strong>of</strong> rigidity G can be determ<strong>in</strong>ed by velocity <strong>of</strong> transversal ultrasonic waves cT <strong>in</strong> a<br />
metal with known density ρ. Transversal ultransonic waves show a low transmittance. Therefore an<br />
attempt was made to derterm<strong>in</strong>e G without direct measurement <strong>of</strong> cT at room temperature. Such a<br />
method is described by M. B. Reynolds [11]. Sample diameter d and the time Δt between the 1 st and 2 nd<br />
back wall echo and the velocity <strong>of</strong> longitud<strong>in</strong>al ultrasonic waves cL have to be determ<strong>in</strong>ed. For the<br />
verification <strong>of</strong> the ultra sonic measurements additional measurements were carried out with the<br />
ELASTOMAT. The ELASTOMAT excites the sample with different ultra sonic frequencies and the<br />
resonance frequencies are determ<strong>in</strong>ed. Thereby the modulus <strong>of</strong> elasticity E and the Poisson ratio ν can<br />
be determ<strong>in</strong>ed and the modulus <strong>of</strong> rigidity can be calculated. This comparitive measurement was done<br />
for molybdenum-titanium and molybdenum-tungsten alloys.<br />
The effect <strong>of</strong> gra<strong>in</strong> size harden<strong>in</strong>g was determ<strong>in</strong>ed with a pure molybdenum reference sample as well as<br />
on PLANSEE standard molybdenum rods with a total degree <strong>of</strong> deformation <strong>of</strong> φtotal = 3.4. The gra<strong>in</strong> size<br />
on the molybdenum rods was altered by variation <strong>of</strong> the anneal<strong>in</strong>g temperature between 1300°C and<br />
2300°C. Anneal<strong>in</strong>g time was constant for 1 hour. These samples were tested by Vickers hardness HV10<br />
−3<br />
−1<br />
at room temperature and compression tests at 500°C with a deformation rate <strong>of</strong> ε& = 2.<br />
0 ⋅10<br />
s .<br />
Results<br />
Except for the molybdenum-titanium alloys chemical analysis revealed <strong>in</strong>terstitial impurities below 1 ppm<br />
for hydrogen and below 5 ppm for nitrogen, and carbon. The molybdenum-titanium alloys with titanium<br />
content above 2% showed oxygen content <strong>of</strong> 150-350 ppm. SEM analysis <strong>in</strong> comb<strong>in</strong>ation with EDX<br />
revealed oxygen conta<strong>in</strong><strong>in</strong>g titanium particles (presumably titanium oxide) for these alloys even after<br />
apply<strong>in</strong>g a 2300°C anneal<strong>in</strong>g.<br />
Even at 2300°C a complete homogeneous distribution <strong>of</strong> the alloy<strong>in</strong>g elements could not be achieved for<br />
the molybdenum- tungsten and molybdenum-rhenium alloys, although the whole alloy<strong>in</strong>g content was <strong>in</strong><br />
solid solution (EPMA measurements <strong>in</strong> fig. 5 and fig. 6). Particles were observed for molybdenumtantalum<br />
and molybdenum-titanium alloys with high alloy<strong>in</strong>g content after a 2000°C anneal<strong>in</strong>g. After an<br />
additional 2300°C anneal<strong>in</strong>g the molybdenum- tantalum alloys were completely homogenised (EPMA<br />
measurements <strong>in</strong> Fig. 3 and Fig. 4) while very few particles rema<strong>in</strong>ed present <strong>in</strong> the high content<br />
molybdenum-titanium alloys.
Wesemann, H<strong>of</strong>fmann et al. 17th Plansee Sem<strong>in</strong>ar 2009, Vol. 1 RM 18/7<br />
at. %<br />
5<br />
4<br />
3<br />
2<br />
1<br />
0<br />
0 1000 2000<br />
measured distance [µm]<br />
Oxygen<br />
Tantalum<br />
Fig. 3: Tantalum and oxygen distribution <strong>in</strong> molybdneum 1%-<br />
tantalum alloy after 2000°C anneal<strong>in</strong>g for 24 h<br />
at. % Tungsten<br />
5<br />
4<br />
3<br />
2<br />
1<br />
2000°C / 24h anneal<strong>in</strong>g<br />
2300°C / 24h anneal<strong>in</strong>g<br />
0<br />
0 2000 4000<br />
measured distance [µm]<br />
Fig. 5: Tungsten distribution for molybdenum 1% tungsten<br />
alloy after 2000°C and 2300°C anneal<strong>in</strong>g<br />
at. %<br />
5<br />
4<br />
3<br />
2<br />
1<br />
0<br />
0 1000 2000<br />
measured distance [µm]<br />
Oxygen<br />
Tantalum<br />
Fig. 4: Tantalum and oxygen distribution <strong>in</strong> molybdneum 1%-<br />
tantalum alloy after 2300°C anneal<strong>in</strong>g for 24 h<br />
at. % Rhenium<br />
5<br />
4<br />
3<br />
2<br />
1<br />
2000°C / 24h anneal<strong>in</strong>g<br />
2300°C / 24h anneal<strong>in</strong>g<br />
0<br />
0 2000 4000<br />
measured distance [µm]<br />
Fig. 6: Rhenium distribution for molybdenum 1% rhenium<br />
alloy after 2000°C and 2300°C anneal<strong>in</strong>g<br />
The relative density was above 99.5% for all samples except the molybdenum-tantalum with a density<br />
above 98.5%. The lower density for molybdenum-tantalum alloys can be expla<strong>in</strong>ed by the formation <strong>of</strong><br />
oxygen conta<strong>in</strong><strong>in</strong>g tantalum particles dur<strong>in</strong>g the s<strong>in</strong>ter<strong>in</strong>g. All alloys showed smaller gra<strong>in</strong> sizes with<br />
<strong>in</strong>creas<strong>in</strong>g alloy<strong>in</strong>g content except the molybdenum-tantalum alloys. Texture measurements revealed a<br />
weak texture with Taylor factors <strong>of</strong> 2.87-3.05. This is close to the theoretical value <strong>of</strong> texture free b.c.c.<br />
metals.<br />
The moduli <strong>of</strong> rigidity determ<strong>in</strong>ed by ultra sonic <strong>in</strong>spection are shown <strong>in</strong> table II – table VI. The calculated<br />
dG/dc values are shown <strong>in</strong> Table VII. These values are <strong>in</strong> a good agreement with the values determ<strong>in</strong>ed<br />
by the ELASTOMAT. For the molybdenum-tantalum alloys the measurement <strong>of</strong> the modulus <strong>of</strong> rigidity by<br />
ultrasonic <strong>in</strong>spection failed. Therefore values calculated by Vegards law were used.<br />
Lattice parameters showed deviation from the Vegard´s rule for titanium, rhenium but were <strong>in</strong> good<br />
agreement with measured lattice parameters reported <strong>in</strong> literature [12].<br />
The tensile properties at 500°C are shown <strong>in</strong> table II- table VI. An upper and lower yield po<strong>in</strong>t was<br />
observed for some alloys. At 500°C molybdenum-chromium alloys show the highest harden<strong>in</strong>g rate,
RM 18/8 17th Plansee Sem<strong>in</strong>ar 2009, Vol. 1 Wesemann, H<strong>of</strong>fmann et al.<br />
followed by tantalum. Rhenium exhibits a moderate harden<strong>in</strong>g rate while SSH was only very weak for<br />
titanium and tungsten at this temperature. The hardness values at room temperature showed a<br />
cont<strong>in</strong>uous <strong>in</strong>crease with <strong>in</strong>creas<strong>in</strong>g solute content for molybdenum-tantalum, molybdenum-titanium and<br />
molybdenum-tungsten alloys (Fig. 7). For the molybdenum-chromium alloys a decrease <strong>in</strong> the Vickers<br />
hardness for very low solute content (0.5%Cr) was observed. At higher concentrations SSH was<br />
observed. Rhenium showed a similar phenomenon <strong>of</strong> a decreas<strong>in</strong>g Vickers hardness up to<br />
concentrations <strong>of</strong> 3% rhenium. This effect is known as solid solution s<strong>of</strong>ten<strong>in</strong>g effect <strong>in</strong> literature and can<br />
not be described by SSH theories. For the harden<strong>in</strong>g rate dHV10/dc <strong>of</strong> rhenium a literature value was<br />
used [3]. In [3] the alloy s<strong>of</strong>ten<strong>in</strong>g effect has a weak impact on the total harden<strong>in</strong>g rate for alloy<br />
conta<strong>in</strong><strong>in</strong>g up to 41 wt.% rhenium.<br />
Table II: Material parameters determ<strong>in</strong>ed on the molybdenum-chromium alloys and pure molybdenum<br />
Mo Mo0.5Cr Mo1.0Cr Mo2.0Cr Mo3.0Cr<br />
Measured solute [at.%] - 0.6 1.0 2.0 3.0<br />
Gra<strong>in</strong> size [µm] 367 374 284 189 177<br />
Taylor factor 2.91 n.d. 2.99 n.d. 3.05<br />
Lattice parameter [Å] 3.14779 3.14763 3.14809 3.14564 3.14522<br />
Modulus <strong>of</strong> rigidity [GPa] n.d. 117.5 117.4 116.0 115.7<br />
Rp0.2 / ReH at 500°C [MPa] 28 / - n.d. 81 / - 143 / - - / 206<br />
Rm at 500°C [MPa] 252 n.d. 324 424 353<br />
A at 500°C [%] 52 n.d. 38.1 20.9 5.7<br />
Table III: Material parameters determ<strong>in</strong>ed on the molybdenum-rhenium alloys<br />
Mo0.5Re Mo1.0Re Mo2.0Re Mo3.0Re Mo5.0Re<br />
Measured solute [at.%] 0.5 1.0 2.0 3.0 5.0<br />
Gra<strong>in</strong> size [µm] 245 248 254 225 170<br />
Taylor factor n.d. n.d. 2.88 n.d. 2.89<br />
Lattice parameter [Å] 3.14763 3.14809 3.14674 3.14564 3.14522<br />
Modulus <strong>of</strong> rigidity [GPa] 119.2 119.8 122.1 123 122.6<br />
Rp0.2 / ReH at 500°C [MPa] n.d. n.d. - / 58 - / 95 - / 136<br />
Rm at 500°C [MPa] n.d. n.d. 313 352 385<br />
A at 500°C [%] n.d. n.d. 53.9 47.7 40<br />
Table IV: Material parameters determ<strong>in</strong>ed on the molybdenum-tantalum alloys<br />
Mo0.5Ta Mo1.0Ta Mo2.0Ta Mo3.0Ta<br />
Measured solute [at.%] 0.4 0.9 2.0 3.0<br />
Gra<strong>in</strong> size [µm] 173 220 223 266<br />
Taylor factor n.d. n.d. n.d. 2.93<br />
Lattice parameter [Å] 3.1491 3.14966 3.1499 3.152<br />
Modulus <strong>of</strong> rigidity [GPa] n.d. n.d. n.d. n.d.<br />
Rp0.2 / ReH at 500°C [MPa] n.d. - / 58 - / 106 - / 122<br />
Rm at 500°C [MPa] n.d. 304 372 384<br />
A at 500°C [%] n.d. 45.9 41.8 39.5
Wesemann, H<strong>of</strong>fmann et al. 17th Plansee Sem<strong>in</strong>ar 2009, Vol. 1 RM 18/9<br />
Table V: Material parameters determ<strong>in</strong>ed on the molybdenum-titanium alloys<br />
Mo1.0Ti Mo2.0Ti Mo3.0Ti Mo4.0Ti<br />
Measured solute [at.%] 1.0 2.0 3.1 4.0<br />
Gra<strong>in</strong> size [µm] 270 258 206 186<br />
Taylor factor n.d. 2.96 n.d. 2.87<br />
Lattice parameter [Å] 3.14883 3.14806 3.14831 3.14814<br />
Modulus <strong>of</strong> rigidity [GPa] 118.2 118.0 116.2 115.2<br />
Rp0.2 / ReH at 500°C [MPa] n.d. 46 / - 41 / - 48 / -<br />
Rm at 500°C [MPa] n.d. 256 311 277<br />
A at 500°C [%] n.d. 32.1 43.2 29<br />
Table VI: Material parameters determ<strong>in</strong>ed on the molybdenum-tungsten alloys<br />
Mo1.0W Mo2.7W Mo5.5W Mo11.5W Mo18.3W<br />
Measured solute [at.%] 1.0 2.8 5.5 11.3 18.4<br />
Gra<strong>in</strong> size [µm] 558 408 250 133 84<br />
Taylor factor n.d. n.d. 2.89 n.d. 2.93<br />
Lattice parameter [Å] 3.14798 n.d. 3.14918 3.15066 3.15425<br />
Modulus <strong>of</strong> rigidity [GPa] n.d. 116.3 118.3 120.9 122.5<br />
Rp0.2 / ReH at 500°C [MPa] n.d. n.d. - / 57 - / 102 - / 116<br />
Rm at 500°C [MPa] n.d. n.d. 301 365 394<br />
A at 500°C [%] n.d. n.d. 45 46.8 45.1<br />
Vickers Hardness [HV10]<br />
210<br />
200<br />
190<br />
180<br />
170<br />
160<br />
0 2 4 6 8 10 12 14 16 18<br />
solute content [at. %]<br />
Mo- Ta<br />
Mo- W<br />
Mo- Ti<br />
Fig. 7: Vickers hardness measurement depend<strong>in</strong>g on the<br />
solute content for tantalum, titanium and tungsten<br />
Vickers Hardness [HV10]<br />
220<br />
200<br />
180<br />
160<br />
140<br />
Mo- Cr<br />
Mo- Re<br />
0 1 2 3 4 5<br />
solute content [at. %]<br />
Fig. 8: Vickers hardness measurement depend<strong>in</strong>g on the<br />
solute content for chromium and rhenium
RM 18/10 17th Plansee Sem<strong>in</strong>ar 2009, Vol. 1 Wesemann, H<strong>of</strong>fmann et al.<br />
Fig. 9 shows the plot <strong>of</strong> the <strong>in</strong>verse gra<strong>in</strong> size versus Rd0.2 at 500°C for pure molybdenum. The l<strong>in</strong>ear fit<br />
procedure revealed the follow<strong>in</strong>g relations for Rd0.2 at 500°C and HV10 at room temperature:<br />
Rd 0.<br />
2<br />
1<br />
= 9.<br />
7(<br />
± 11.<br />
4)<br />
MPa + 0.<br />
595(<br />
± 0.<br />
085)<br />
⋅ MPa<br />
(7)<br />
d<br />
1<br />
HV10 = 159.<br />
8(<br />
± 2.<br />
6)<br />
HV10<br />
+ 0.<br />
102(<br />
± 0.<br />
018)<br />
⋅ HV10<br />
(8)<br />
d<br />
A week Hall-Petch harden<strong>in</strong>g is observed for molybdenum at room temperature. At 500°C Hall-Petch<br />
harden<strong>in</strong>g <strong>in</strong> pure molybdenum was strong for gra<strong>in</strong> sizes below 50µm. The lattice friction is almost<br />
negligible with 9.7MPa at 500°C. This is due to the thermal activation at 500°C. The <strong>in</strong>vestigated solid<br />
solution alloys showed gra<strong>in</strong>s sizes larger than 80µm, therefore the impact on the yield strength was<br />
quite low for these alloys. Nevertheless the measured hardness values and Rp0.2 values were corrected.<br />
For simplification a l<strong>in</strong>ear superposition <strong>of</strong> the different harden<strong>in</strong>g mechanisms was assumed. The use <strong>of</strong><br />
the Hall-Petch relation <strong>of</strong> pure molybdenum for molybdenum alloys is a further simplification. The effect<br />
<strong>of</strong> texture was corrected by multiply<strong>in</strong>g the measured yield strength by the ratio <strong>of</strong> the theoretical Taylor<br />
factor for randomly orientated molybdenum and the actually measured Taylor factor. The correspond<strong>in</strong>g<br />
corrected values for the solid solution harden<strong>in</strong>g are shown <strong>in</strong> Table VII.<br />
R d0.2% [MPa]<br />
140<br />
120<br />
100<br />
80<br />
60<br />
40<br />
Rd - at 500°C<br />
0.2% at 500°C<br />
20<br />
500µm 100µm 50µm 20µm<br />
0<br />
0 50 100 150 200<br />
Inverse Gra<strong>in</strong> Size d -0.5<br />
Fig. 9: Hall- Petch- Plot for pure molybdenum at 500°C<br />
Table VII: Determ<strong>in</strong>ed changes <strong>in</strong> lattice parameter and modulus <strong>of</strong> rigidity (calculated for tantalum); harden<strong>in</strong>g rate for the<br />
different alloy<strong>in</strong>g elements at room temperature and 500°C<br />
Cr Re Ta Ti W<br />
da / dc (RT) [nm] -0,02831 -0,00644 -0,01184 0.00044 0,00340<br />
dG / dc Ultrasonic [GPa] -81.8 78.6 -57(calc.) -106.7 38.4<br />
dG / dc ELASTOMAT [GPa] - - - -132.5 32.2<br />
(dHV10 /dc)corr (RT) [HV10] 2519 614 612 690 118<br />
(dRp0.2/dc)corr (500°C) [MPa] 5248 1795 2887 144 307
Wesemann, H<strong>of</strong>fmann et al. 17th Plansee Sem<strong>in</strong>ar 2009, Vol. 1 RM 18/11<br />
The applicability <strong>of</strong> the different solid solution theories was tested by compar<strong>in</strong>g the correlation between<br />
the actually measured harden<strong>in</strong>g rate with the calculated harden<strong>in</strong>g rate. For the calculation <strong>of</strong> the<br />
theoretical harden<strong>in</strong>g rate the parameters δ (eq. 1) and η´ (eq. 2) were calculated by the measured<br />
changes <strong>in</strong> lattice parameter and modulus <strong>of</strong> rigidity. The value α (table I) was determ<strong>in</strong>ed by a fitt<strong>in</strong>g<br />
procedure look<strong>in</strong>g for the best match between the experimentally determ<strong>in</strong>ed ε as well as measured and<br />
calculated harden<strong>in</strong>g rates. This procedure was done for the theory <strong>of</strong> Fleischer and Labusch. At room<br />
temperature the best agreement was found for the harden<strong>in</strong>g parameter <strong>of</strong> Labusch with a α = 18<br />
(R 2 =0.98) <strong>in</strong> Fig. 10. Fleischers theory showed good correlation for α = 9 (R 2 =0.92). For the theory <strong>of</strong><br />
Suzuki the parameter EW was calculated accord<strong>in</strong>g to [10].<br />
Compar<strong>in</strong>g the calculated solid solution harden<strong>in</strong>g with the measured the best agreement was found for<br />
Labusch (Fig. 12). Although the SSH theory <strong>of</strong> Fleischer was developed for concentrations below 1%<br />
solute the calculated values show a good agreement with the measured harden<strong>in</strong>g rate at room<br />
temperature.<br />
dHV10/dc<br />
3000<br />
2000<br />
α = 18<br />
R 2 = 0.98<br />
1000<br />
0<br />
Ti<br />
Ta<br />
W<br />
Re<br />
0,0 0,5 1,0 4<br />
3 ε L<br />
1,5 2,0 2,5<br />
Fig. 10: Correlation between harden<strong>in</strong>g parameter for<br />
Labusch and the measured soild solution harden<strong>in</strong>g<br />
at room temperature with the best fit for α = 18<br />
Cr<br />
d(R d0.2/eH )/dc<br />
4000<br />
2000<br />
α = 25<br />
R 2 = 0.87<br />
Re<br />
Ta<br />
Cr<br />
W<br />
0<br />
Ti<br />
0 1 4<br />
3 ε L<br />
2 3<br />
Fig. 11: Correlation between harden<strong>in</strong>g parameter for Labusch<br />
and the measured soild solution harden<strong>in</strong>g at 500°C<br />
with the best fit for α = 25<br />
The same procedure was carried out for solid solution harden<strong>in</strong>g at 500°C <strong>in</strong> Fig. 11. Dielastic<br />
<strong>in</strong>teractions at 500°C were calculated from the modulus <strong>of</strong> rigidity <strong>of</strong> the pure metals at 500°C and<br />
assum<strong>in</strong>g Vegard`s law for the alloys. For the parelastic <strong>in</strong>teraction at 500°C the room temperature<br />
values were used because no data were available at 500°C. The calculation accord<strong>in</strong>g to Labusch<br />
revealed good agreement for α = 25, R 2 =0.87. The <strong>in</strong>crease <strong>in</strong> α from 18 to 25 implies a higher impact <strong>of</strong><br />
the parelastic <strong>in</strong>teractions. This gives evidence that the <strong>in</strong>fluence <strong>of</strong> dislocations with edge character on<br />
the deformation has <strong>in</strong>creased at 500°C. For the theory <strong>of</strong> Fleischer the best correlation was found to be<br />
unrealistically high with a value <strong>of</strong> α >100, R 2 =0.59. The quality <strong>of</strong> the fit became worse for both theories<br />
compared to room temperature. This is probably due to the <strong>in</strong>creas<strong>in</strong>g degree <strong>of</strong> thermal activation <strong>of</strong><br />
dislocation movement at 500°C which is not considered <strong>in</strong> both theories. Nevertheless the theory <strong>of</strong><br />
Labusch showed still some accordance. The high solute content <strong>in</strong> the <strong>in</strong>vestigated alloys may result <strong>in</strong><br />
non- discrete obstacles which can not be overcome easily by thermal activation. Labusch´s theory<br />
considers these high concentrations with c > 1% <strong>in</strong> his theory. This may expla<strong>in</strong> the rema<strong>in</strong><strong>in</strong>g<br />
agreement at a temperature <strong>of</strong> 500°C.
RM 18/12 17th Plansee Sem<strong>in</strong>ar 2009, Vol. 1 Wesemann, H<strong>of</strong>fmann et al.<br />
Although Suzuki considers thermal activation the results were even worse. The correlation between<br />
calculated and experimentally determ<strong>in</strong>ed values show a low degree <strong>of</strong> correlation with R 2 =0.16. The<br />
bad results are attributed to the def<strong>in</strong>ition <strong>of</strong> EW and δ” (table I). These two parameters were def<strong>in</strong>ed and<br />
pro<strong>of</strong>ed for iron but not for molybdenum.<br />
dHV10/dc (measured)<br />
3000<br />
2000<br />
1000<br />
Suzuki R 2 = 0.86<br />
Fleischer R 2 = 0.91<br />
Labusch R 2 = 0.98<br />
0<br />
0 1000 2000<br />
dτ crit /dc (calculated)<br />
Fig. 12: Comparison <strong>of</strong> the calculated solid solution harden<strong>in</strong>g dτcrit/dc by the different theories and the actually measured solid<br />
solution harden<strong>in</strong>g dHV10/dc at room temperature<br />
Conclusions<br />
The sample characterisation has shown that the manufactur<strong>in</strong>g <strong>of</strong> homogeneous molybdenum solid<br />
solution alloys by powder metallurgy is quite difficult. For a complete homogenization long last<strong>in</strong>g high<br />
temperature solution anneal<strong>in</strong>g is required which resulted <strong>in</strong> significant gra<strong>in</strong> growth. Large gra<strong>in</strong><br />
complicated the determ<strong>in</strong>ation <strong>of</strong> the lattice parameters and modulus <strong>of</strong> rigidity.<br />
Except for the molybdenum-tantalum alloys all other alloys undergo a cont<strong>in</strong>uous decrease <strong>in</strong> gra<strong>in</strong> size<br />
with <strong>in</strong>creas<strong>in</strong>g alloy content. At room temperature the molybdenum-chromium alloys and molybdenum-<br />
rhenium alloys showed solid solution s<strong>of</strong>ten<strong>in</strong>g at concentrations up to 1% and 3% respectively. At<br />
higher concentrations solid solution harden<strong>in</strong>g was observed. Chromium as alloy<strong>in</strong>g element exhibited<br />
the highest harden<strong>in</strong>g rate at room temperature followed by titanium, tantalum and rhenium. Tungsten<br />
shows a weak solid solution harden<strong>in</strong>g. At 500°C molybdenum-chromium showed the highest solid<br />
solution harden<strong>in</strong>g. Moderate harden<strong>in</strong>g was observed for molybdenum-tantalum and molybdenumrhenium<br />
while molybdenum-tungsten and molybdenum-titanium showed only very low solid solution<br />
harden<strong>in</strong>g at this temperature. A strong gra<strong>in</strong> size harden<strong>in</strong>g effect was observed for pure molybdenum<br />
at 500°C for gra<strong>in</strong> sizes below 50µm. The gra<strong>in</strong> size effect was negligible for the <strong>in</strong>vestigated alloys<br />
which showed gra<strong>in</strong> sizes above 80µm.<br />
To describe the solid solution harden<strong>in</strong>g <strong>in</strong> molybdenum the theory <strong>of</strong> Labsuch is most suitable at room<br />
temperature. Although the theory <strong>of</strong> Labusch was developed for solid solution harden<strong>in</strong>g at 0K, it is still<br />
<strong>in</strong> good agreement at 500°C. Fleischer´s theory showed good agreement at room temperature, too, but
Wesemann, H<strong>of</strong>fmann et al. 17th Plansee Sem<strong>in</strong>ar 2009, Vol. 1 RM 18/13<br />
can not be applied at 500°C. Both theories yield high values for α which <strong>in</strong>dicates that dislocations with<br />
edge character have significant <strong>in</strong>fluence on the SSH <strong>in</strong> molybdenum. With <strong>in</strong>creas<strong>in</strong>g deformation<br />
temperature the impact <strong>of</strong> dislocations with edge character further <strong>in</strong>creases. The SSH theory <strong>of</strong> Suzuki<br />
has to be further developed for molybdenum. Material parameters for the calculation <strong>of</strong> EW have to be<br />
estimated for molybdenum <strong>in</strong>stead <strong>of</strong> us<strong>in</strong>g the parameters <strong>of</strong> iron <strong>in</strong> the future.<br />
Acknowledgement<br />
The authors would like to thank the University <strong>of</strong> Erlangen-Nürnberg, Lehrstuhl I (Allgeme<strong>in</strong>e<br />
Werkst<strong>of</strong>feigenschaften) for the experimental determ<strong>in</strong>ation <strong>of</strong> the modulus <strong>of</strong> rigidity by means <strong>of</strong> the<br />
ELASTOMAT. The authors also acknowledge the support <strong>of</strong> Dr. rer. nat. D. Heger and Dipl.-Phys. G.<br />
Schreiber <strong>in</strong> experimental work.<br />
References<br />
1. J. J. Harwood, The Metal <strong>Molybdenum</strong> – Proceed<strong>in</strong>g, R.I. Jaffee, American Society for Metals,<br />
Ohio, 331-364, (1958)<br />
2. J. J Harwood, The Metal <strong>Molybdenum</strong> – Proceed<strong>in</strong>g, M. Semchyshen, American Society for<br />
Metals, Ohio, 281-329, (1958)<br />
3. J. R. Stephens, W. R. Witzke, Journal <strong>of</strong> Less- Common Metals 29, 325-342 (1972)<br />
4. N. E. Promisel, The Science and Technology <strong>of</strong> Tungsten, Tantalum, <strong>Molybdenum</strong>, Niobium and<br />
their <strong>Alloys</strong> – Conference on Refractory Metals held at Oslo Univeristy Centre, L. L. Seigle,<br />
Pergamon Press, Oxford S. 63–93 (1964)<br />
5. J. Friedel, Dislocations, 351-366, Pergamon Press, Paris, (1964)<br />
6. P. Haasen, Zeitschrift für Metallkunde Bd. 55, 55-60, (1964)<br />
7. R. L. Fleischer, Acta Metallurgica Vol. 9, 203-209, (1963)<br />
8. L. A. Gypen, A. Deruyttere, Scripta Metallurgica Vol. 15, 815- 820, (1981)<br />
9. R. Labusch, Phys. Stat. Sol., Vol. 41, 659-669, (1970)<br />
10. H. Hattendorf, A. R. Büchner, Zeitschrift für Metallkunde Bd 83, 690–698, (1992)<br />
11. M. B. Reynolds, Trans. Am. Soc. For Metals Vol. 45, 839-861, (1953)<br />
12. W. B. Pearson, Structures <strong>of</strong> Metals and <strong>Alloys</strong>, Pergamon Press, London, (1958)<br />
13. P. Jax, P. Kratochvil, P. Haasen, Acta. Metallugica Vol. 18, 237-245, (1970)<br />
14. B.L. Mordike, Phys. Stat. Sol. (a), 35, 303-308, (1976)