Half-Bridge LLC Resonant Converter Design Using FSFR-Series ...
Half-Bridge LLC Resonant Converter Design Using FSFR-Series ...
Half-Bridge LLC Resonant Converter Design Using FSFR-Series ...

You also want an ePaper? Increase the reach of your titles
YUMPU automatically turns print PDFs into web optimized ePapers that Google loves.
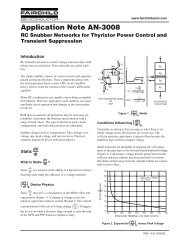
AN-4151 APPLICATION NOTE<br />
The available input voltage range of the <strong>LLC</strong> resonant<br />
converter is determined by the peak voltage gain. Thus, the<br />
resonant network should be designed so that the gain curve<br />
has an enough peak gain to cover the input voltage range.<br />
However, ZVS condition is lost below the peak gain point,<br />
as depicted in Figure 12. Therefore, some margin is required<br />
when determining the maximum gain to guarantee stable<br />
ZVS operation during the load transient and start-up.<br />
Typically 10~20% of the maximum gain is used as a margin<br />
for practical design, as shown in Figure 13.<br />
Gain (M)<br />
10~20% of M max<br />
peak gain<br />
maximum operation gain<br />
(M max )<br />
fo Figure 13. Determining the Maximum Gain<br />
Even though the peak gain at a given condition can be<br />
obtained by using the gain in Equation 6, it is difficult to<br />
express the peak gain in explicit form. To simplify the<br />
analysis and design, the peak gains are obtained using<br />
simulation tools and depicted in Figure 14, which shows<br />
how the peak gain (attainable maximum gain) varies with<br />
Q for different m values. It appears that higher peak gain<br />
can be obtained by reducing m or Q values. With a given<br />
resonant frequency (fo) and Q value, decreasing m means<br />
reducing the magnetizing inductance, which results in<br />
increased circulating current. Accordingly, there is a tradeoff<br />
between the available gain range and conduction loss.<br />
f s<br />
1<br />
0.2 0.3 0.4 0.5 0.6 0.7 0.8 0.9 1 1.1 1.2 1.3 1.4<br />
© 2007 Fairchild Semiconductor Corporation www.fairchildsemi.com<br />
Rev. 1.0.1 • 5/15/12 6<br />
peak gain<br />
2.2<br />
2.1<br />
2<br />
1.9<br />
1.8<br />
1.7<br />
1.6<br />
1.5<br />
1.4<br />
1.3<br />
1.2<br />
1.1<br />
m=3.0<br />
m=3.5<br />
m=4.0<br />
m=4.5<br />
m=5.0<br />
m=6.0<br />
m=9.0 m=8.0 m=7.0<br />
Q<br />
m=2.25<br />
m=2.5<br />
Figure 14. Peak Gain (Attainable Maximum Gain) vs.<br />
Q for Different m Values