longitudinal impact assessment study of sugar producers in malawi
longitudinal impact assessment study of sugar producers in malawi
longitudinal impact assessment study of sugar producers in malawi

You also want an ePaper? Increase the reach of your titles
YUMPU automatically turns print PDFs into web optimized ePapers that Google loves.
4. The global, national and local <strong>sugar</strong> contexts<br />
4.1 The global <strong>sugar</strong> situation<br />
More than 100 countries produce <strong>sugar</strong>, 80% <strong>of</strong> which is made from <strong>sugar</strong> cane<br />
grown primarily <strong>in</strong> the tropical and sub-tropical zones <strong>of</strong> the southern hemisphere,<br />
and the balance from <strong>sugar</strong> beet which is grown ma<strong>in</strong>ly <strong>in</strong> the temperate zones <strong>of</strong> the<br />
northern hemisphere. Generally, the costs <strong>of</strong> produc<strong>in</strong>g <strong>sugar</strong> from <strong>sugar</strong> cane are<br />
lower than those <strong>in</strong> respect <strong>of</strong> process<strong>in</strong>g <strong>sugar</strong> beets.<br />
Currently, 70% <strong>of</strong> the world's <strong>sugar</strong> is consumed <strong>in</strong> the countries <strong>of</strong> orig<strong>in</strong>, whilst the<br />
balance is traded on world markets. Because <strong>of</strong> the residual nature <strong>of</strong> the world<br />
market, the free market price has historically been one <strong>of</strong> the most volatile <strong>of</strong> all<br />
commodity prices. The five largest exporters <strong>in</strong> 2008/09, Brazil, Thailand, Australia,<br />
SADC and Guatemala, are expected to supply approximately 85% <strong>of</strong> all world free<br />
market exports. South Africa is currently ranked as the 8th largest exporter to the<br />
world market. None <strong>of</strong> the other countries <strong>in</strong> which Illovo operates export <strong>sugar</strong> to the<br />
world market.<br />
The world <strong>sugar</strong> price, although cont<strong>in</strong>u<strong>in</strong>g to be very volatile, adjusted upwards<br />
dur<strong>in</strong>g the past two years, from an average <strong>of</strong> US11.84 cents/lb <strong>in</strong> April 2008 to<br />
above US13.00 cents/lb <strong>in</strong> March 2009 and US 15.20cents/lb <strong>in</strong> April 2010.<br />
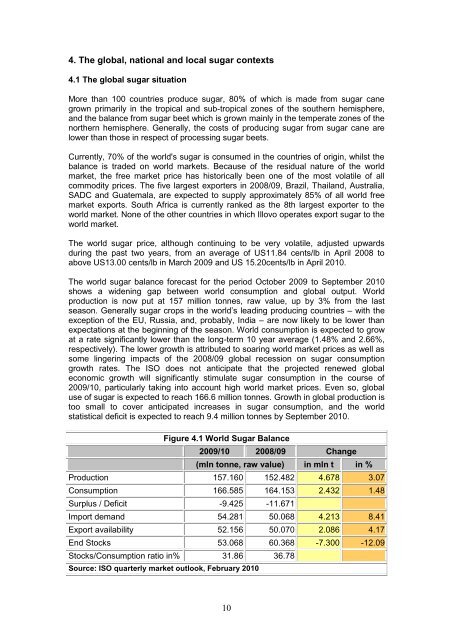
The world <strong>sugar</strong> balance forecast for the period October 2009 to September 2010<br />
shows a widen<strong>in</strong>g gap between world consumption and global output. World<br />
production is now put at 157 million tonnes, raw value, up by 3% from the last<br />
season. Generally <strong>sugar</strong> crops <strong>in</strong> the world’s lead<strong>in</strong>g produc<strong>in</strong>g countries – with the<br />
exception <strong>of</strong> the EU, Russia, and, probably, India – are now likely to be lower than<br />
expectations at the beg<strong>in</strong>n<strong>in</strong>g <strong>of</strong> the season. World consumption is expected to grow<br />
at a rate significantly lower than the long-term 10 year average (1.48% and 2.66%,<br />
respectively). The lower growth is attributed to soar<strong>in</strong>g world market prices as well as<br />
some l<strong>in</strong>ger<strong>in</strong>g <strong>impact</strong>s <strong>of</strong> the 2008/09 global recession on <strong>sugar</strong> consumption<br />
growth rates. The ISO does not anticipate that the projected renewed global<br />
economic growth will significantly stimulate <strong>sugar</strong> consumption <strong>in</strong> the course <strong>of</strong><br />
2009/10, particularly tak<strong>in</strong>g <strong>in</strong>to account high world market prices. Even so, global<br />
use <strong>of</strong> <strong>sugar</strong> is expected to reach 166.6 million tonnes. Growth <strong>in</strong> global production is<br />
too small to cover anticipated <strong>in</strong>creases <strong>in</strong> <strong>sugar</strong> consumption, and the world<br />
statistical deficit is expected to reach 9.4 million tonnes by September 2010.<br />
Figure 4.1 World Sugar Balance<br />
2009/10 2008/09 Change<br />
(mln tonne, raw value) <strong>in</strong> mln t <strong>in</strong> %<br />
Production 157.160 152.482 4.678 3.07<br />
Consumption 166.585 164.153 2.432 1.48<br />
Surplus / Deficit -9.425 -11.671<br />
Import demand 54.281 50.068 4.213 8.41<br />
Export availability 52.156 50.070 2.086 4.17<br />
End Stocks 53.068 60.368 -7.300 -12.09<br />
Stocks/Consumption ratio <strong>in</strong>% 31.86 36.78<br />
Source: ISO quarterly market outlook, February 2010<br />
10