Review of Input and Output Policies for Cereal Production in ...
Review of Input and Output Policies for Cereal Production in ...
Review of Input and Output Policies for Cereal Production in ...
You also want an ePaper? Increase the reach of your titles
YUMPU automatically turns print PDFs into web optimized ePapers that Google loves.
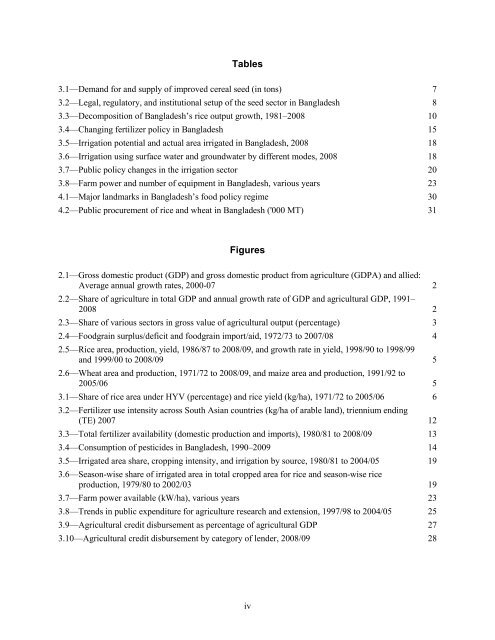
Tables<br />
3.1—Dem<strong>and</strong> <strong>for</strong> <strong>and</strong> supply <strong>of</strong> improved cereal seed (<strong>in</strong> tons) 7<br />
3.2—Legal, regulatory, <strong>and</strong> <strong>in</strong>stitutional setup <strong>of</strong> the seed sector <strong>in</strong> Bangladesh 8<br />
3.3—Decomposition <strong>of</strong> Bangladesh’s rice output growth, 1981–2008 10<br />
3.4—Chang<strong>in</strong>g fertilizer policy <strong>in</strong> Bangladesh 15<br />
3.5—Irrigation potential <strong>and</strong> actual area irrigated <strong>in</strong> Bangladesh, 2008 18<br />
3.6—Irrigation us<strong>in</strong>g surface water <strong>and</strong> groundwater by different modes, 2008 18<br />
3.7—Public policy changes <strong>in</strong> the irrigation sector 20<br />
3.8—Farm power <strong>and</strong> number <strong>of</strong> equipment <strong>in</strong> Bangladesh, various years 23<br />
4.1—Major l<strong>and</strong>marks <strong>in</strong> Bangladesh’s food policy regime 30<br />
4.2—Public procurement <strong>of</strong> rice <strong>and</strong> wheat <strong>in</strong> Bangladesh ('000 MT) 31<br />
Figures<br />
2.1—Gross domestic product (GDP) <strong>and</strong> gross domestic product from agriculture (GDPA) <strong>and</strong> allied:<br />
Average annual growth rates, 2000-07 2<br />
2.2—Share <strong>of</strong> agriculture <strong>in</strong> total GDP <strong>and</strong> annual growth rate <strong>of</strong> GDP <strong>and</strong> agricultural GDP, 1991–<br />
2008 2<br />
2.3—Share <strong>of</strong> various sectors <strong>in</strong> gross value <strong>of</strong> agricultural output (percentage) 3<br />
2.4—Foodgra<strong>in</strong> surplus/deficit <strong>and</strong> foodgra<strong>in</strong> import/aid, 1972/73 to 2007/08 4<br />
2.5—Rice area, production, yield, 1986/87 to 2008/09, <strong>and</strong> growth rate <strong>in</strong> yield, 1998/90 to 1998/99<br />
<strong>and</strong> 1999/00 to 2008/09 5<br />
2.6—Wheat area <strong>and</strong> production, 1971/72 to 2008/09, <strong>and</strong> maize area <strong>and</strong> production, 1991/92 to<br />
2005/06 5<br />
3.1—Share <strong>of</strong> rice area under HYV (percentage) <strong>and</strong> rice yield (kg/ha), 1971/72 to 2005/06 6<br />
3.2—Fertilizer use <strong>in</strong>tensity across South Asian countries (kg/ha <strong>of</strong> arable l<strong>and</strong>), triennium end<strong>in</strong>g<br />
(TE) 2007 12<br />
3.3—Total fertilizer availability (domestic production <strong>and</strong> imports), 1980/81 to 2008/09 13<br />
3.4—Consumption <strong>of</strong> pesticides <strong>in</strong> Bangladesh, 1990–2009 14<br />
3.5—Irrigated area share, cropp<strong>in</strong>g <strong>in</strong>tensity, <strong>and</strong> irrigation by source, 1980/81 to 2004/05 19<br />
3.6—Season-wise share <strong>of</strong> irrigated area <strong>in</strong> total cropped area <strong>for</strong> rice <strong>and</strong> season-wise rice<br />
production, 1979/80 to 2002/03 19<br />
3.7—Farm power available (kW/ha), various years 23<br />
3.8—Trends <strong>in</strong> public expenditure <strong>for</strong> agriculture research <strong>and</strong> extension, 1997/98 to 2004/05 25<br />
3.9—Agricultural credit disbursement as percentage <strong>of</strong> agricultural GDP 27<br />
3.10—Agricultural credit disbursement by category <strong>of</strong> lender, 2008/09 28<br />
iv


