

Review of Input and Output Policies for Cereal Production in ...
Review of Input and Output Policies for Cereal Production in ...
Review of Input and Output Policies for Cereal Production in ...

Create successful ePaper yourself
Turn your PDF publications into a flip-book with our unique Google optimized e-Paper software.
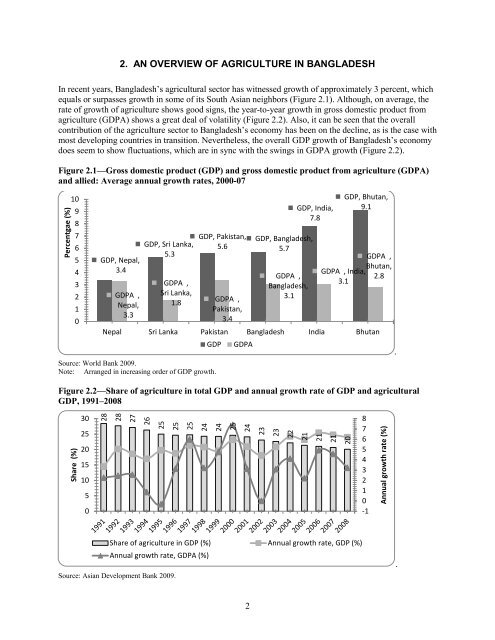
2. AN OVERVIEW OF AGRICULTURE IN BANGLADESH<br />
In recent years, Bangladesh’s agricultural sector has witnessed growth <strong>of</strong> approximately 3 percent, which<br />
equals or surpasses growth <strong>in</strong> some <strong>of</strong> its South Asian neighbors (Figure 2.1). Although, on average, the<br />
rate <strong>of</strong> growth <strong>of</strong> agriculture shows good signs, the year-to-year growth <strong>in</strong> gross domestic product from<br />
agriculture (GDPA) shows a great deal <strong>of</strong> volatility (Figure 2.2). Also, it can be seen that the overall<br />
contribution <strong>of</strong> the agriculture sector to Bangladesh’s economy has been on the decl<strong>in</strong>e, as is the case with<br />
most develop<strong>in</strong>g countries <strong>in</strong> transition. Nevertheless, the overall GDP growth <strong>of</strong> Bangladesh’s economy<br />
does seem to show fluctuations, which are <strong>in</strong> sync with the sw<strong>in</strong>gs <strong>in</strong> GDPA growth (Figure 2.2).<br />
Figure 2.1—Gross domestic product (GDP) <strong>and</strong> gross domestic product from agriculture (GDPA)<br />
<strong>and</strong> allied: Average annual growth rates, 2000-07<br />
Percentgae (%)<br />
10<br />
9<br />
8<br />
7<br />
6<br />
5<br />
4<br />
3<br />
2<br />
1<br />
0<br />
GDP, Nepal,<br />
3.4<br />
GDPA ,<br />
Nepal,<br />
3.3<br />
GDP, Sri Lanka,<br />
5.3<br />
Source: World Bank 2009.<br />
Note: Arranged <strong>in</strong> <strong>in</strong>creas<strong>in</strong>g order <strong>of</strong> GDP growth.<br />
Figure 2.2—Share <strong>of</strong> agriculture <strong>in</strong> total GDP <strong>and</strong> annual growth rate <strong>of</strong> GDP <strong>and</strong> agricultural<br />
GDP, 1991–2008<br />
Share (%)<br />
30<br />
25<br />
20<br />
15<br />
10<br />
5<br />
0<br />
28<br />
Source: Asian Development Bank 2009.<br />
GDPA ,<br />
Sri Lanka,<br />
1.8<br />
GDP, Pakistan,<br />
5.6<br />
GDPA ,<br />
Pakistan,<br />
3.4<br />
2<br />
GDP, Bangladesh,<br />
5.7<br />
GDPA ,<br />
Bangladesh,<br />
3.1<br />
GDP, India,<br />
7.8<br />
GDPA , India,<br />
3.1<br />
GDP, Bhutan,<br />
9.1<br />
GDPA ,<br />
Bhutan,<br />
2.8<br />
Nepal Sri Lanka Pakistan Bangladesh India Bhutan<br />
28<br />
27<br />
26<br />
25<br />
25<br />
25<br />
24<br />
GDP GDPA<br />
24<br />
25<br />
Share <strong>of</strong> agriculture <strong>in</strong> GDP (%) Annual growth rate, GDP (%)<br />
Annual growth rate, GDPA (%)<br />
24<br />
23<br />
23<br />
22<br />
21<br />
21<br />
21<br />
20<br />
8<br />
7<br />
6<br />
5<br />
4<br />
3<br />
2<br />
1<br />
0<br />
-1<br />
Annual growth rate (%)<br />
.<br />
.


