Danish Meteorological Institute - DMI
Danish Meteorological Institute - DMI
Danish Meteorological Institute - DMI

You also want an ePaper? Increase the reach of your titles
YUMPU automatically turns print PDFs into web optimized ePapers that Google loves.
<strong>Danish</strong> <strong>Meteorological</strong> <strong>Institute</strong><br />
<strong>Danish</strong> Climate Centre Report 07-03<br />
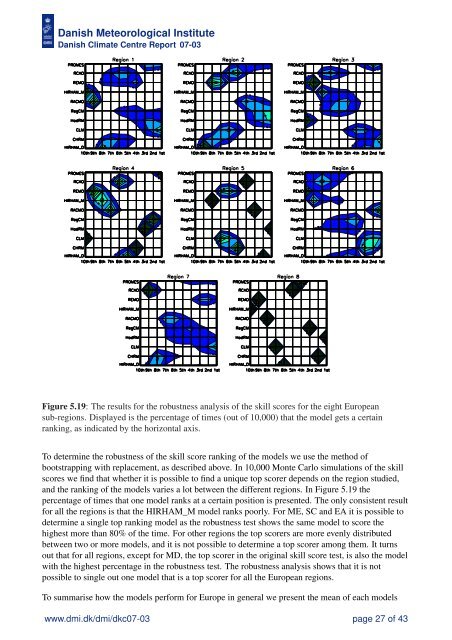
Figure 5.19: The results for the robustness analysis of the skill scores for the eight European<br />
sub-regions. Displayed is the percentage of times (out of 10,000) that the model gets a certain<br />
ranking, as indicated by the horizontal axis.<br />
To determine the robustness of the skill score ranking of the models we use the method of<br />
bootstrapping with replacement, as described above. In 10,000 Monte Carlo simulations of the skill<br />
scores we find that whether it is possible to find a unique top scorer depends on the region studied,<br />
and the ranking of the models varies a lot between the different regions. In Figure 5.19 the<br />
percentage of times that one model ranks at a certain position is presented. The only consistent result<br />
for all the regions is that the HIRHAM_M model ranks poorly. For ME, SC and EA it is possible to<br />
determine a single top ranking model as the robustness test shows the same model to score the<br />
highest more than 80% of the time. For other regions the top scorers are more evenly distributed<br />
between two or more models, and it is not possible to determine a top scorer among them. It turns<br />
out that for all regions, except for MD, the top scorer in the original skill score test, is also the model<br />
with the highest percentage in the robustness test. The robustness analysis shows that it is not<br />
possible to single out one model that is a top scorer for all the European regions.<br />
To summarise how the models perform for Europe in general we present the mean of each models<br />
www.dmi.dk/dmi/dkc07-03 page 27 of 43