Danish Meteorological Institute - DMI
Danish Meteorological Institute - DMI
Danish Meteorological Institute - DMI

Create successful ePaper yourself
Turn your PDF publications into a flip-book with our unique Google optimized e-Paper software.
<strong>Danish</strong> <strong>Meteorological</strong> <strong>Institute</strong><br />
<strong>Danish</strong> Climate Centre Report 07-03<br />
Normalized Precipitation Change [%]<br />
0.3<br />
0.2<br />
0.1<br />
0<br />
−0.1<br />
−0.2<br />
−0.3<br />
−0.4<br />
−0.5<br />
−0.6<br />
−0.7<br />
−0.8<br />
0 5 10 15 20 25<br />
Bin [mm day<br />
30 35 40 45 50<br />
−1 ]<br />
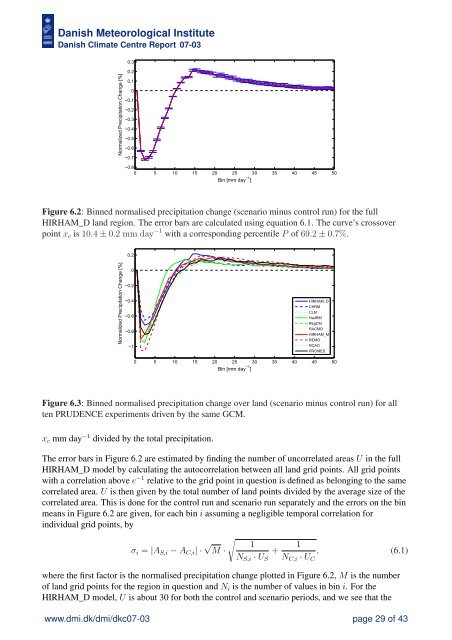
Figure 6.2: Binned normalised precipitation change (scenario minus control run) for the full<br />
HIRHAM_D land region. The error bars are calculated using equation 6.1. The curve’s crossover<br />
point xc is 10.4 ± 0.2 mm day −1 with a corresponding percentile P of 69.2 ± 0.7%.<br />
Normalized Precipitation Change [%]<br />
0.2<br />
0<br />
−0.2<br />
−0.4<br />
−0.6<br />
−0.8<br />
−1<br />
HIRHAM_D<br />
CHRM<br />
CLM<br />
HadRM<br />
RegCM<br />
RACMO<br />
HIRHAM_M<br />
REMO<br />
RCAO<br />
PROMES<br />
0 5 10 15 20 25<br />
Bin [mm day<br />
30 35 40 45 50<br />
−1 ]<br />
Figure 6.3: Binned normalised precipitation change over land (scenario minus control run) for all<br />
ten PRUDENCE experiments driven by the same GCM.<br />
xc mm day −1 divided by the total precipitation.<br />
The error bars in Figure 6.2 are estimated by finding the number of uncorrelated areas U in the full<br />
HIRHAM_D model by calculating the autocorrelation between all land grid points. All grid points<br />
with a correlation above e −1 relative to the grid point in question is defined as belonging to the same<br />
correlated area. U is then given by the total number of land points divided by the average size of the<br />
correlated area. This is done for the control run and scenario run separately and the errors on the bin<br />
means in Figure 6.2 are given, for each bin i assuming a negligible temporal correlation for<br />
individual grid points, by<br />
σi = |AS,i − AC,i| · √ M ·<br />
1<br />
NS,i · US<br />
+<br />
1<br />
NC,i · UC<br />
, (6.1)<br />
where the first factor is the normalised precipitation change plotted in Figure 6.2, M is the number<br />
of land grid points for the region in question and Ni is the number of values in bin i. For the<br />
HIRHAM_D model, U is about 30 for both the control and scenario periods, and we see that the<br />
www.dmi.dk/dmi/dkc07-03 page 29 of 43