Danish Meteorological Institute - DMI
Danish Meteorological Institute - DMI
Danish Meteorological Institute - DMI

You also want an ePaper? Increase the reach of your titles
YUMPU automatically turns print PDFs into web optimized ePapers that Google loves.
<strong>Danish</strong> <strong>Meteorological</strong> <strong>Institute</strong><br />
<strong>Danish</strong> Climate Centre Report 07-03<br />
ECA Daily Normalized Prec. 1961−1990<br />
NCEP Daily Normalized Prec. 1961−1990<br />
ERA 40 Daily Normalized Prec. 1961−1990<br />
10 −1<br />
10 −2<br />
10 −3<br />
10 −4<br />
10 −1<br />
10 −2<br />
10 −3<br />
10 −4<br />
10 −1<br />
10 −2<br />
10 −3<br />
10 −4<br />
Wet day fraction: 30.8%<br />
Wet day precipitation average: 6.15 mm<br />
All day precipitation average: 1.89 mm<br />
R1 BI<br />
R2 IP<br />
R3 FR<br />
R4 ME<br />
R5 SC<br />
R6 AL<br />
R7 MD<br />
R8 EA<br />
0 40 80 120 160 200 240 280<br />
Bin [mm day −1 ]<br />
Wet day fraction: 39.5%<br />
Wet day precipitation average: 5.70 mm<br />
All day precipitation average: 2.25 mm<br />
R1 BI<br />
R2 IP<br />
R3 FR<br />
R4 ME<br />
R5 SC<br />
R6 AL<br />
R7 MD<br />
R8 EA<br />
0 40 80 120 160 200 240 280<br />
Bin [mm day −1 ]<br />
Wet day fraction: 36.3%<br />
Wet day precipitation average: 4.03 mm<br />
All day precipitation average: 1.46 mm<br />
R1 BI<br />
R2 IP<br />
R3 FR<br />
R4 ME<br />
R5 SC<br />
R6 AL<br />
R7 MD<br />
R8 EA<br />
0 40 80 120 160 200 240 280<br />
Bin [mm day −1 ]<br />
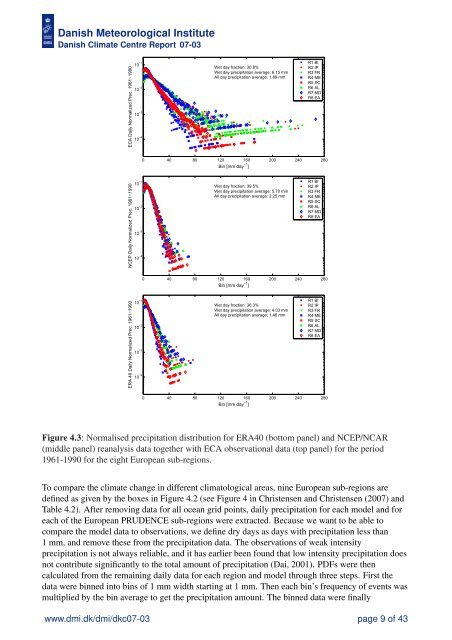
Figure 4.3: Normalised precipitation distribution for ERA40 (bottom panel) and NCEP/NCAR<br />
(middle panel) reanalysis data together with ECA observational data (top panel) for the period<br />
1961-1990 for the eight European sub-regions.<br />
To compare the climate change in different climatological areas, nine European sub-regions are<br />
defined as given by the boxes in Figure 4.2 (see Figure 4 in Christensen and Christensen (2007) and<br />
Table 4.2). After removing data for all ocean grid points, daily precipitation for each model and for<br />
each of the European PRUDENCE sub-regions were extracted. Because we want to be able to<br />
compare the model data to observations, we define dry days as days with precipitation less than<br />
1 mm, and remove these from the precipitation data. The observations of weak intensity<br />
precipitation is not always reliable, and it has earlier been found that low intensity precipitation does<br />
not contribute significantly to the total amount of precipitation (Dai, 2001). PDFs were then<br />
calculated from the remaining daily data for each region and model through three steps. First the<br />
data were binned into bins of 1 mm width starting at 1 mm. Then each bin’s frequency of events was<br />
multiplied by the bin average to get the precipitation amount. The binned data were finally<br />
www.dmi.dk/dmi/dkc07-03 page 9 of 43