Danish Meteorological Institute - DMI
Danish Meteorological Institute - DMI
Danish Meteorological Institute - DMI

Create successful ePaper yourself
Turn your PDF publications into a flip-book with our unique Google optimized e-Paper software.
<strong>Danish</strong> <strong>Meteorological</strong> <strong>Institute</strong><br />
<strong>Danish</strong> Climate Centre Report 07-03<br />
x c [mm day −1 ]<br />
16<br />
15<br />
14<br />
13<br />
12<br />
11<br />
10<br />
9<br />
00.1 0.3 0.5 0.7 1 1.5 2 2.5 3<br />
Dry/wet day transition [mm day −1 ]<br />
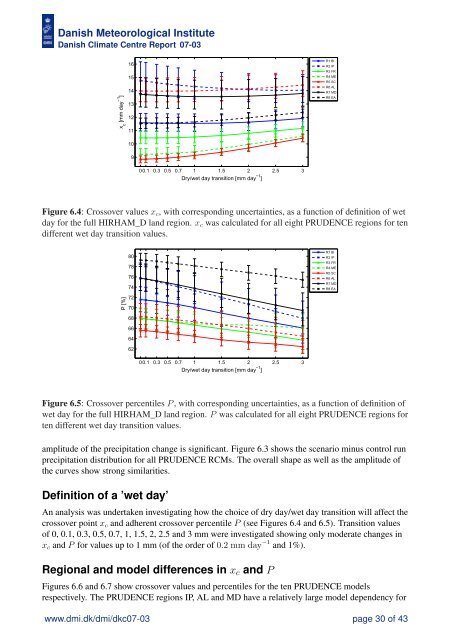
Figure 6.4: Crossover values xc, with corresponding uncertainties, as a function of definition of wet<br />
day for the full HIRHAM_D land region. xc was calculated for all eight PRUDENCE regions for ten<br />
different wet day transition values.<br />
P [%]<br />
80<br />
78<br />
76<br />
74<br />
72<br />
70<br />
68<br />
66<br />
64<br />
62<br />
00.1 0.3 0.5 0.7 1 1.5 2 2.5 3<br />
Dry/wet day transition [mm day −1 ]<br />
Figure 6.5: Crossover percentiles P , with corresponding uncertainties, as a function of definition of<br />
wet day for the full HIRHAM_D land region. P was calculated for all eight PRUDENCE regions for<br />
ten different wet day transition values.<br />
amplitude of the precipitation change is significant. Figure 6.3 shows the scenario minus control run<br />
precipitation distribution for all PRUDENCE RCMs. The overall shape as well as the amplitude of<br />
the curves show strong similarities.<br />
Definition of a ’wet day’<br />
An analysis was undertaken investigating how the choice of dry day/wet day transition will affect the<br />
crossover point xc and adherent crossover percentile P (see Figures 6.4 and 6.5). Transition values<br />
of 0, 0.1, 0.3, 0.5, 0.7, 1, 1.5, 2, 2.5 and 3 mm were investigated showing only moderate changes in<br />
xc and P for values up to 1 mm (of the order of 0.2 mm day −1 and 1%).<br />
Regional and model differences in xc and P<br />
Figures 6.6 and 6.7 show crossover values and percentiles for the ten PRUDENCE models<br />
respectively. The PRUDENCE regions IP, AL and MD have a relatively large model dependency for<br />
www.dmi.dk/dmi/dkc07-03 page 30 of 43<br />
R1 BI<br />
R2 IP<br />
R3 FR<br />
R4 ME<br />
R5 SC<br />
R6 AL<br />
R7 MD<br />
R8 EA<br />
R1 BI<br />
R2 IP<br />
R3 FR<br />
R4 ME<br />
R5 SC<br />
R6 AL<br />
R7 MD<br />
R8 EA