D 2.1.1 Note on literature review concerning market ... - Biorefinery
D 2.1.1 Note on literature review concerning market ... - Biorefinery
D 2.1.1 Note on literature review concerning market ... - Biorefinery

Create successful ePaper yourself
Turn your PDF publications into a flip-book with our unique Google optimized e-Paper software.
Biopol - Deliverable <str<strong>on</strong>g>2.1.1</str<strong>on</strong>g><br />
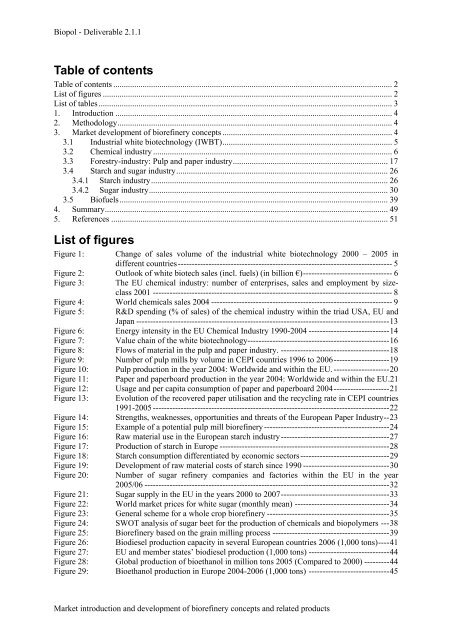
Table of c<strong>on</strong>tents<br />
Table of c<strong>on</strong>tents ..................................................................................................................................... 2<br />
List of figures .......................................................................................................................................... 2<br />
List of tables ............................................................................................................................................ 3<br />
1. Introducti<strong>on</strong> .................................................................................................................................... 4<br />
2. Methodology................................................................................................................................... 4<br />
3. Market development of biorefinery c<strong>on</strong>cepts ................................................................................. 4<br />
3.1 Industrial white biotechnology (IWBT)................................................................................. 5<br />
3.2 Chemical industry .................................................................................................................. 6<br />
3.3 Forestry-industry: Pulp and paper industry.......................................................................... 17<br />
3.4 Starch and sugar industry..................................................................................................... 26<br />
3.4.1 Starch industry.................................................................................................................26<br />
3.4.2 Sugar industry..................................................................................................................30<br />
3.5 Biofuels................................................................................................................................ 39<br />
4. Summary....................................................................................................................................... 49<br />
5. References .................................................................................................................................... 51<br />
List of figures<br />
Figure 1: Change of sales volume of the industrial white biotechnology 2000 – 2005 in<br />
different countries----------------------------------------------------------------------------- 5<br />
Figure 2: Outlook of white biotech sales (incl. fuels) (in billi<strong>on</strong> €)-------------------------------- 6<br />
Figure 3: The EU chemical industry: number of enterprises, sales and employment by sizeclass<br />
2001 -------------------------------------------------------------------------------------- 8<br />
Figure 4: World chemicals sales 2004 ----------------------------------------------------------------- 9<br />
Figure 5: R&D spending (% of sales) of the chemical industry within the triad USA, EU and<br />
Japan -------------------------------------------------------------------------------------------13<br />
Figure 6: Energy intensity in the EU Chemical Industry 1990-2004 -----------------------------14<br />
Figure 7: Value chain of the white biotechnology---------------------------------------------------16<br />
Figure 8: Flows of material in the pulp and paper industry. ---------------------------------------18<br />
Figure 9: Number of pulp mills by volume in CEPI countries 1996 to 2006--------------------19<br />
Figure 10: Pulp producti<strong>on</strong> in the year 2004: Worldwide and within the EU. --------------------20<br />
Figure 11: Paper and paperboard producti<strong>on</strong> in the year 2004: Worldwide and within the EU.21<br />
Figure 12: Usage and per capita c<strong>on</strong>sumpti<strong>on</strong> of paper and paperboard 2004--------------------21<br />
Figure 13: Evoluti<strong>on</strong> of the recovered paper utilisati<strong>on</strong> and the recycling rate in CEPI countries<br />
1991-2005 -------------------------------------------------------------------------------------22<br />
Figure 14: Strengths, weaknesses, opportunities and threats of the European Paper Industry--23<br />
Figure 15: Example of a potential pulp mill biorefinery ---------------------------------------------24<br />
Figure 16: Raw material use in the European starch industry---------------------------------------27<br />
Figure 17: Producti<strong>on</strong> of starch in Europe -------------------------------------------------------------28<br />
Figure 18: Starch c<strong>on</strong>sumpti<strong>on</strong> differentiated by ec<strong>on</strong>omic sectors--------------------------------29<br />
Figure 19: Development of raw material costs of starch since 1990 -------------------------------30<br />
Figure 20: Number of sugar refinery companies and factories within the EU in the year<br />
2005/06 ----------------------------------------------------------------------------------------32<br />
Figure 21: Sugar supply in the EU in the years 2000 to 2007---------------------------------------33<br />
Figure 22: World <strong>market</strong> prices for white sugar (m<strong>on</strong>thly mean) ----------------------------------34<br />
Figure 23: General scheme for a whole crop biorefinery --------------------------------------------35<br />
Figure 24: SWOT analysis of sugar beet for the producti<strong>on</strong> of chemicals and biopolymers ---38<br />
Figure 25: <strong>Biorefinery</strong> based <strong>on</strong> the grain milling process ------------------------------------------39<br />
Figure 26: Biodiesel producti<strong>on</strong> capacity in several European countries 2006 (1,000 t<strong>on</strong>s)----41<br />
Figure 27: EU and member states’ biodiesel producti<strong>on</strong> (1,000 t<strong>on</strong>s) -----------------------------44<br />
Figure 28: Global producti<strong>on</strong> of bioethanol in milli<strong>on</strong> t<strong>on</strong>s 2005 (Compared to 2000) ---------44<br />
Figure 29: Bioethanol producti<strong>on</strong> in Europe 2004-2006 (1,000 t<strong>on</strong>s) -----------------------------45<br />
Market introducti<strong>on</strong> and development of biorefinery c<strong>on</strong>cepts and related products