D 2.1.1 Note on literature review concerning market ... - Biorefinery
D 2.1.1 Note on literature review concerning market ... - Biorefinery
D 2.1.1 Note on literature review concerning market ... - Biorefinery

You also want an ePaper? Increase the reach of your titles
YUMPU automatically turns print PDFs into web optimized ePapers that Google loves.
Biopol - Deliverable <str<strong>on</strong>g>2.1.1</str<strong>on</strong>g><br />
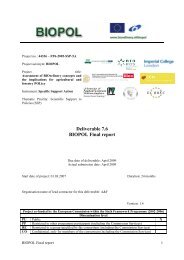
Figure 11: Paper and paperboard producti<strong>on</strong> in the year 2004: Worldwide and within the EU.<br />
Producti<strong>on</strong> [1.000t]<br />
100.000<br />
80.000<br />
60.000<br />
40.000<br />
20.000<br />
0<br />
China Japan Canada USA Others EU 25<br />
Spain<br />
Sweden<br />
Poland<br />
Austria<br />
Netherlands<br />
Italy<br />
Great Britain<br />
France<br />
Finland<br />
Market introducti<strong>on</strong> and development of biorefinery c<strong>on</strong>cepts and related products<br />
Rest of EU countries<br />
0 5.000 10.000 15.000 20.000<br />
Producti<strong>on</strong> [1,000 t]<br />
Germany<br />
Source: Verband Deutscher Papierfabriken e.V. 2006<br />
The main importers of paper and paperboard within the EU are Germany (2005: 9,681 thousand t<strong>on</strong>s),<br />
France (2005: 6,058 thousand t<strong>on</strong>s) and the United Kingdom (2005: 7,265 thousand t<strong>on</strong>s). Italy<br />
imports a big part from n<strong>on</strong>-European countries (2005: 3,649 thousand t<strong>on</strong>s). Germany (2005: 796<br />
thousand t<strong>on</strong>s), Finland (2005: 2,037 thousand t<strong>on</strong>s) and Sweden (2005: 3,535 thousand t<strong>on</strong>s) are the<br />
most important exporters of paper and paperboard within the EU additi<strong>on</strong>ally to n<strong>on</strong>-European<br />
countries (European Commissi<strong>on</strong> 2007b).<br />
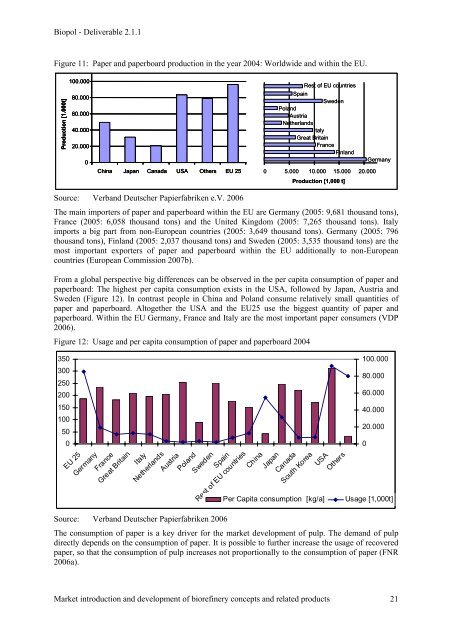
From a global perspective big differences can be observed in the per capita c<strong>on</strong>sumpti<strong>on</strong> of paper and<br />
paperboard: The highest per capita c<strong>on</strong>sumpti<strong>on</strong> exists in the USA, followed by Japan, Austria and<br />
Sweden (Figure 12). In c<strong>on</strong>trast people in China and Poland c<strong>on</strong>sume relatively small quantities of<br />
paper and paperboard. Altogether the USA and the EU25 use the biggest quantity of paper and<br />
paperboard. Within the EU Germany, France and Italy are the most important paper c<strong>on</strong>sumers (VDP<br />
2006).<br />
Figure 12: Usage and per capita c<strong>on</strong>sumpti<strong>on</strong> of paper and paperboard 2004<br />
350<br />
300<br />
250<br />
200<br />
150<br />
100<br />
50<br />
0<br />
EU 25<br />
Germany<br />
France<br />
Great Britain<br />
Italy<br />
Netherlands<br />
Austria<br />
Poland<br />
Sweden<br />
Spain<br />
Rest of EU countries<br />
Source: Verband Deutscher Papierfabriken 2006<br />
China<br />
Japan<br />
Canada<br />
South Korea<br />
USA<br />
Others<br />
100.000<br />
80.000<br />
60.000<br />
40.000<br />
20.000<br />
Per Capita c<strong>on</strong>sumpti<strong>on</strong> [kg/a] Usage [1,000t]<br />
The c<strong>on</strong>sumpti<strong>on</strong> of paper is a key driver for the <strong>market</strong> development of pulp. The demand of pulp<br />
directly depends <strong>on</strong> the c<strong>on</strong>sumpti<strong>on</strong> of paper. It is possible to further increase the usage of recovered<br />
paper, so that the c<strong>on</strong>sumpti<strong>on</strong> of pulp increases not proporti<strong>on</strong>ally to the c<strong>on</strong>sumpti<strong>on</strong> of paper (FNR<br />
2006a).<br />
0<br />
21