The State of Canada's Cities and Communities 2012 - FCM
The State of Canada's Cities and Communities 2012 - FCM
The State of Canada's Cities and Communities 2012 - FCM

Create successful ePaper yourself
Turn your PDF publications into a flip-book with our unique Google optimized e-Paper software.
Chapter 1<br />
Page 2<br />
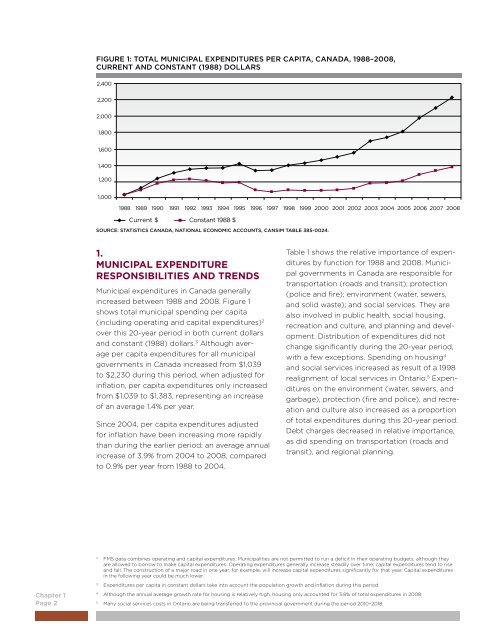
FIGURE 1: TOTAL MUNICIPAL EXPENDITURES PER CAPITA, CANADA, 1988–2008,<br />
CURRENT AND CONSTANT (1988) DOLLARS<br />
2,400<br />
2,200<br />
2,000<br />
1,800<br />
1,600<br />
1,400<br />
1,200<br />
1,000<br />
1988 1989 1990 1991 1992 1993 1994 1995 1996 1997 1998 1999 2000 2001 2002 2003 2004 2005 2006 2007 2008<br />
Current $ Constant 1988 $<br />
SOURCE: STATISTICS CANADA, NATIONAL ECONOMIC ACCOUNTS, CANSIM TABLE 385-0024.<br />
1.<br />
MUNICIPAL EXPENDITURE<br />
RESPONSIBILITIES AND TRENDS<br />
Municipal expenditures in Canada generally<br />
increased between 1988 <strong>and</strong> 2008. Figure 1<br />
shows total municipal spending per capita<br />
(including operating <strong>and</strong> capital expenditures) 2<br />
over this 20-year period in both current dollars<br />
<strong>and</strong> constant (1988) dollars. 3 Although average<br />
per capita expenditures for all municipal<br />
governments in Canada increased from $1,039<br />
to $2,230 during this period, when adjusted for<br />
inflation, per capita expenditures only increased<br />
from $1,039 to $1,383, representing an increase<br />
<strong>of</strong> an average 1.4% per year.<br />
Since 2004, per capita expenditures adjusted<br />
for inflation have been increasing more rapidly<br />
than during the earlier period: an average annual<br />
increase <strong>of</strong> 3.9% from 2004 to 2008, compared<br />
to 0.9% per year from 1988 to 2004.<br />
Table 1 shows the relative importance <strong>of</strong> expenditures<br />
by function for 1988 <strong>and</strong> 2008. Municipal<br />
governments in Canada are responsible for<br />
transportation (roads <strong>and</strong> transit); protection<br />
(police <strong>and</strong> fire); environment (water, sewers,<br />
<strong>and</strong> solid waste); <strong>and</strong> social services. <strong>The</strong>y are<br />
also involved in public health, social housing,<br />
recreation <strong>and</strong> culture, <strong>and</strong> planning <strong>and</strong> development.<br />
Distribution <strong>of</strong> expenditures did not<br />
change significantly during the 20-year period,<br />
with a few exceptions. Spending on housing 4<br />
<strong>and</strong> social services increased as result <strong>of</strong> a 1998<br />
realignment <strong>of</strong> local services in Ontario. 5 Expenditures<br />
on the environment (water, sewers, <strong>and</strong><br />
garbage), protection (fire <strong>and</strong> police), <strong>and</strong> recreation<br />
<strong>and</strong> culture also increased as a proportion<br />
<strong>of</strong> total expenditures during this 20-year period.<br />
Debt charges decreased in relative importance,<br />
as did spending on transportation (roads <strong>and</strong><br />
transit), <strong>and</strong> regional planning.<br />
2 FMS data combines operating <strong>and</strong> capital expenditures. Municipalities are not permitted to run a deficit in their operating budgets, although they<br />
are allowed to borrow to make capital expenditures. Operating expenditures generally increase steadily over time; capital expenditures tend to rise<br />
<strong>and</strong> fall. <strong>The</strong> construction <strong>of</strong> a major road in one year, for example, will increase capital expenditures significantly for that year. Capital expenditures<br />
in the following year could be much lower.<br />
3 Expenditures per capita in constant dollars take into account the population growth <strong>and</strong> inflation during this period.<br />
4 Although the annual average growth rate for housing is relatively high, housing only accounted for 3.8% <strong>of</strong> total expenditures in 2008.<br />
5 Many social services costs in Ontario are being transferred to the provincial government during the period 2010–2018.