The State of Canada's Cities and Communities 2012 - FCM
The State of Canada's Cities and Communities 2012 - FCM
The State of Canada's Cities and Communities 2012 - FCM

You also want an ePaper? Increase the reach of your titles
YUMPU automatically turns print PDFs into web optimized ePapers that Google loves.
Chapter 1<br />
Page 12<br />
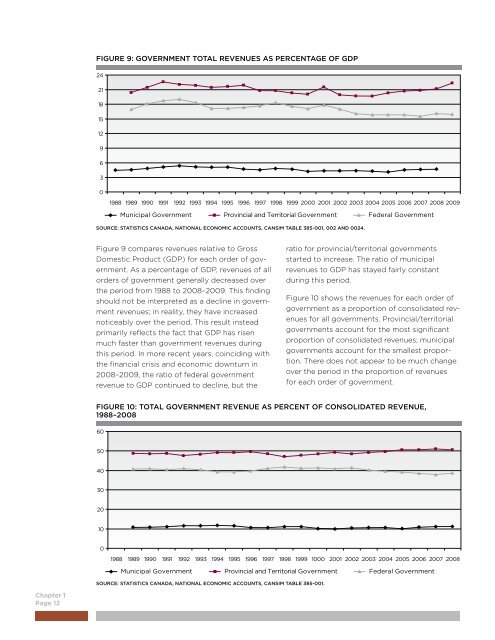
FIGURE 9: GOVERNMENT TOTAL REVENUES AS PERCENTAGE OF GDP<br />
24<br />
21<br />
18<br />
15<br />
12<br />
9<br />
6<br />
3<br />
0<br />
1988 1989 1990 1991 1992 1993 1994 1995 1996 1997 1998 1999 2000 2001 2002 2003 2004 2005 2006 2007 2008 2009<br />
Municipal Government Provincial <strong>and</strong> Territorial Government Federal Government<br />
SOURCE: STATISTICS CANADA, NATIONAL ECONOMIC ACCOUNTS, CANSIM TABLE 385-001, 002 AND 0024.<br />
Figure 9 compares revenues relative to Gross<br />
Domestic Product (GDP) for each order <strong>of</strong> government.<br />
As a percentage <strong>of</strong> GDP, revenues <strong>of</strong> all<br />
orders <strong>of</strong> government generally decreased over<br />
the period from 1988 to 2008–2009. This finding<br />
should not be interpreted as a decline in government<br />
revenues; in reality, they have increased<br />
noticeably over the period. This result instead<br />
primarily reflects the fact that GDP has risen<br />
much faster than government revenues during<br />
this period. In more recent years, coinciding with<br />
the financial crisis <strong>and</strong> economic downturn in<br />
2008–2009, the ratio <strong>of</strong> federal government<br />
revenue to GDP continued to decline, but the<br />
ratio for provincial/territorial governments<br />
started to increase. <strong>The</strong> ratio <strong>of</strong> municipal<br />
revenues to GDP has stayed fairly constant<br />
during this period.<br />
Figure 10 shows the revenues for each order <strong>of</strong><br />
government as a proportion <strong>of</strong> consolidated revenues<br />
for all governments. Provincial/territorial<br />
governments account for the most significant<br />
proportion <strong>of</strong> consolidated revenues; municipal<br />
governments account for the smallest proportion.<br />
<strong>The</strong>re does not appear to be much change<br />
over the period in the proportion <strong>of</strong> revenues<br />
for each order <strong>of</strong> government.<br />
FIGURE 10: TOTAL GOVERNMENT REVENUE AS PERCENT OF CONSOLIDATED REVENUE,<br />
1988–2008<br />
60<br />
50<br />
40<br />
30<br />
20<br />
10<br />
0<br />
1988 1989 1990 1991 1992 1993 1994 1995 1996 1997 1998 1999 1000 2001 2002 2003 2004 2005 2006 2007 2008<br />
Municipal Government Provincial <strong>and</strong> Territorial Government Federal Government<br />
SOURCE: STATISTICS CANADA, NATIONAL ECONOMIC ACCOUNTS, CANSIM TABLE 385-001.