The State of Canada's Cities and Communities 2012 - FCM
The State of Canada's Cities and Communities 2012 - FCM
The State of Canada's Cities and Communities 2012 - FCM

Create successful ePaper yourself
Turn your PDF publications into a flip-book with our unique Google optimized e-Paper software.
Chapter 1<br />
Page 9<br />
not available for other uses. When the costs are<br />
spread out over time, a significant portion <strong>of</strong> the<br />
local budget becomes a fixed obligation, <strong>and</strong><br />
debt charges can constrain local fiscal flexibility.<br />
Moreover, less-indebted governments tend to be<br />
more highly rated by the bond-rating agencies,<br />
<strong>and</strong> thus face lower borrowing costs. A municipality<br />
with low debt also has more flexibility<br />
in responding to unanticipated future events. 9<br />
Nevertheless, borrowing by local governments<br />
to meet at least some capital expenditure<br />
requirements is certainly justified. As Casey<br />
V<strong>and</strong>er Ploeg notes, “a completely debt-free city<br />
should not be the ultimate goal <strong>of</strong> fiscal policy,<br />
regardless <strong>of</strong> how well it plays out politically.<br />
This is especially the case if the trade-<strong>of</strong>f is an<br />
under-funded capital stock.” 10<br />
4.<br />
EXPENDITURE TRENDS AMONG<br />
FEDERAL AND PROVINCIAL/<br />
TERRITORIAL GOVERNMENTS<br />
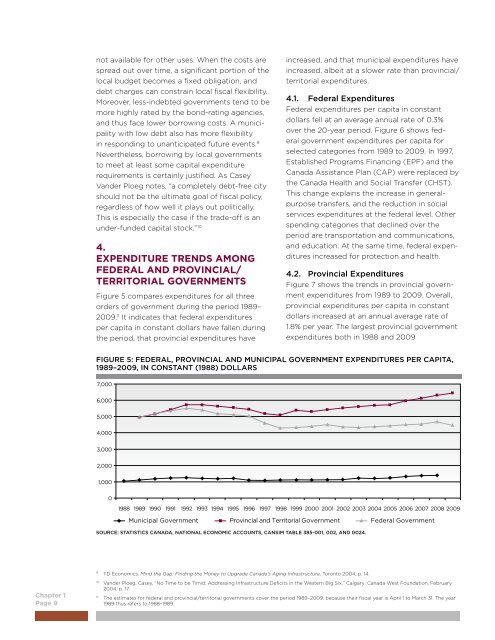
Figure 5 compares expenditures for all three<br />
orders <strong>of</strong> government during the period 1989–<br />
2009. 11 It indicates that federal expenditures<br />
per capita in constant dollars have fallen during<br />
the period, that provincial expenditures have<br />
9 TD Economics. Mind the Gap: Finding the Money to Upgrade Canada’s Aging Infrastructure, Toronto 2004, p. 14.<br />
increased, <strong>and</strong> that municipal expenditures have<br />
increased, albeit at a slower rate than provincial/<br />
territorial expenditures.<br />
4.1. Federal Expenditures<br />
Federal expenditures per capita in constant<br />
dollars fell at an average annual rate <strong>of</strong> 0.3%<br />
over the 20-year period. Figure 6 shows federal<br />
government expenditures per capita for<br />
selected categories from 1989 to 2009. In 1997,<br />
Established Programs Financing (EPF) <strong>and</strong> the<br />
Canada Assistance Plan (CAP) were replaced by<br />
the Canada Health <strong>and</strong> Social Transfer (CHST).<br />
This change explains the increase in generalpurpose<br />
transfers, <strong>and</strong> the reduction in social<br />
services expenditures at the federal level. Other<br />
spending categories that declined over the<br />
period are transportation <strong>and</strong> communications,<br />
<strong>and</strong> education. At the same time, federal expenditures<br />
increased for protection <strong>and</strong> health.<br />
4.2. Provincial Expenditures<br />
Figure 7 shows the trends in provincial government<br />
expenditures from 1989 to 2009. Overall,<br />
provincial expenditures per capita in constant<br />
dollars increased at an annual average rate <strong>of</strong><br />
1.8% per year. <strong>The</strong> largest provincial government<br />
expenditures both in 1988 <strong>and</strong> 2009<br />
FIGURE 5: FEDERAL, PROVINCIAL AND MUNICIPAL GOVERNMENT EXPENDITURES PER CAPITA,<br />
1989–2009, IN CONSTANT (1988) DOLLARS<br />
7,000<br />
6,000<br />
5,000<br />
4,000<br />
3,000<br />
2,000<br />
1,000<br />
0<br />
10 V<strong>and</strong>er Ploeg, Casey, “No Time to be Timid: Addressing Infrastructure Deficits in the Western Big Six,” Calgary: Canada West Foundation, February<br />
2004, p. 17.<br />
1988 1989 1990 1991 1992 1993 1994 1995 1996 1997 1998 1999 2000 2001 2002 2003 2004 2005 2006 2007 2008 2009<br />
Municipal Government Provincial <strong>and</strong> Territorial Government Federal Government<br />
SOURCE: STATISTICS CANADA, NATIONAL ECONOMIC ACCOUNTS, CANSIM TABLE 385-001, 002, AND 0024.<br />
11 <strong>The</strong> estimates for federal <strong>and</strong> provincial/territorial governments cover the period 1989–2009, because their fiscal year is April 1 to March 31. <strong>The</strong> year<br />
1989 thus refers to 1988–1989.