The State of Canada's Cities and Communities 2012 - FCM
The State of Canada's Cities and Communities 2012 - FCM
The State of Canada's Cities and Communities 2012 - FCM

Create successful ePaper yourself
Turn your PDF publications into a flip-book with our unique Google optimized e-Paper software.
Chapter 1<br />
Page 11<br />
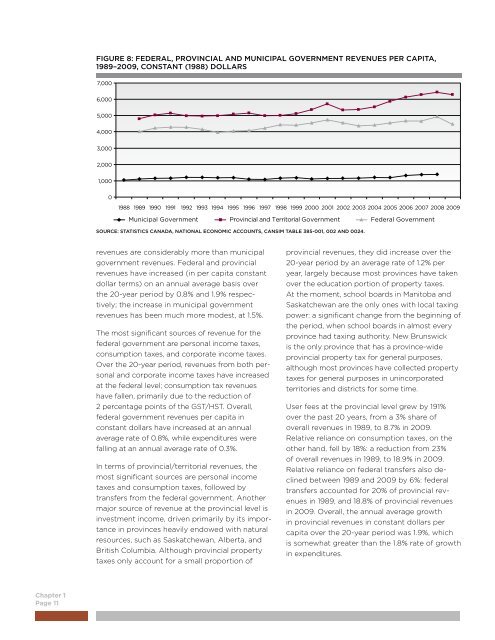
FIGURE 8: FEDERAL, PROVINCIAL AND MUNICIPAL GOVERNMENT REVENUES PER CAPITA,<br />
1989–2009, CONSTANT (1988) DOLLARS<br />
7,000<br />
6,000<br />
5,000<br />
4,000<br />
3,000<br />
2,000<br />
1,000<br />
0<br />
1988 1989 1990 1991 1992 1993 1994 1995 1996 1997 1998 1999 2000 2001 2002 2003 2004 2005 2006 2007 2008 2009<br />
Municipal Government Provincial <strong>and</strong> Territorial Government Federal Government<br />
SOURCE: STATISTICS CANADA, NATIONAL ECONOMIC ACCOUNTS, CANSIM TABLE 385-001, 002 AND 0024.<br />
revenues are considerably more than municipal<br />
government revenues. Federal <strong>and</strong> provincial<br />
revenues have increased (in per capita constant<br />
dollar terms) on an annual average basis over<br />
the 20-year period by 0.8% <strong>and</strong> 1.9% respectively;<br />
the increase in municipal government<br />
revenues has been much more modest, at 1.5%.<br />
<strong>The</strong> most significant sources <strong>of</strong> revenue for the<br />
federal government are personal income taxes,<br />
consumption taxes, <strong>and</strong> corporate income taxes.<br />
Over the 20-year period, revenues from both personal<br />
<strong>and</strong> corporate income taxes have increased<br />
at the federal level; consumption tax revenues<br />
have fallen, primarily due to the reduction <strong>of</strong><br />
2 percentage points <strong>of</strong> the GST/HST. Overall,<br />
federal government revenues per capita in<br />
constant dollars have increased at an annual<br />
average rate <strong>of</strong> 0.8%, while expenditures were<br />
falling at an annual average rate <strong>of</strong> 0.3%.<br />
In terms <strong>of</strong> provincial/territorial revenues, the<br />
most significant sources are personal income<br />
taxes <strong>and</strong> consumption taxes, followed by<br />
transfers from the federal government. Another<br />
major source <strong>of</strong> revenue at the provincial level is<br />
investment income, driven primarily by its importance<br />
in provinces heavily endowed with natural<br />
resources, such as Saskatchewan, Alberta, <strong>and</strong><br />
British Columbia. Although provincial property<br />
taxes only account for a small proportion <strong>of</strong><br />
provincial revenues, they did increase over the<br />
20-year period by an average rate <strong>of</strong> 1.2% per<br />
year, largely because most provinces have taken<br />
over the education portion <strong>of</strong> property taxes.<br />
At the moment, school boards in Manitoba <strong>and</strong><br />
Saskatchewan are the only ones with local taxing<br />
power: a significant change from the beginning <strong>of</strong><br />
the period, when school boards in almost every<br />
province had taxing authority. New Brunswick<br />
is the only province that has a province-wide<br />
provincial property tax for general purposes,<br />
although most provinces have collected property<br />
taxes for general purposes in unincorporated<br />
territories <strong>and</strong> districts for some time.<br />
User fees at the provincial level grew by 191%<br />
over the past 20 years, from a 3% share <strong>of</strong><br />
overall revenues in 1989, to 8.7% in 2009.<br />
Relative reliance on consumption taxes, on the<br />
other h<strong>and</strong>, fell by 18%: a reduction from 23%<br />
<strong>of</strong> overall revenues in 1989, to 18.9% in 2009.<br />
Relative reliance on federal transfers also declined<br />
between 1989 <strong>and</strong> 2009 by 6%: federal<br />
transfers accounted for 20% <strong>of</strong> provincial revenues<br />
in 1989, <strong>and</strong> 18.8% <strong>of</strong> provincial revenues<br />
in 2009. Overall, the annual average growth<br />
in provincial revenues in constant dollars per<br />
capita over the 20-year period was 1.9%, which<br />
is somewhat greater than the 1.8% rate <strong>of</strong> growth<br />
in expenditures.