CAFR - Fairfax County Public Schools
CAFR - Fairfax County Public Schools
CAFR - Fairfax County Public Schools

You also want an ePaper? Increase the reach of your titles
YUMPU automatically turns print PDFs into web optimized ePapers that Google loves.
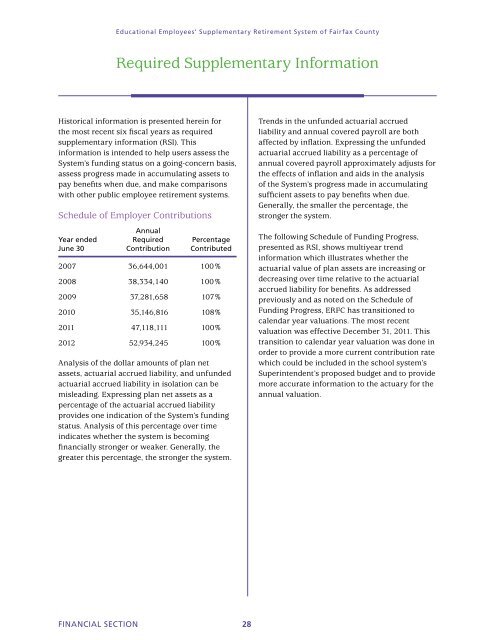
educational employees’ supplementary Retirement system of fairfax county<br />
Required Supplementary Information<br />
Historical information is presented herein for<br />
the most recent six fiscal years as required<br />
supplementary information (RSI). This<br />
information is intended to help users assess the<br />
System’s funding status on a going-concern basis,<br />
assess progress made in accumulating assets to<br />
pay benefits when due, and make comparisons<br />
with other public employee retirement systems.<br />
Schedule of Employer Contributions<br />
annual<br />
Year ended Required Percentage<br />
June 30 contribution contributed<br />
2007 36,644,001 100%<br />
2008 38,334,140 100%<br />
2009 37,281,658 107%<br />
2010 35,146,816 108%<br />
2011 47,118,111 100%<br />
2012 52,934,245 100%<br />
Analysis of the dollar amounts of plan net<br />
assets, actuarial accrued liability, and unfunded<br />
actuarial accrued liability in isolation can be<br />
misleading. Expressing plan net assets as a<br />
percentage of the actuarial accrued liability<br />
provides one indication of the System’s funding<br />
status. Analysis of this percentage over time<br />
indicates whether the system is becoming<br />
financially stronger or weaker. Generally, the<br />
greater this percentage, the stronger the system.<br />
financial section 28<br />
Trends in the unfunded actuarial accrued<br />
liability and annual covered payroll are both<br />
affected by inflation. Expressing the unfunded<br />
actuarial accrued liability as a percentage of<br />
annual covered payroll approximately adjusts for<br />
the effects of inflation and aids in the analysis<br />
of the System’s progress made in accumulating<br />
sufficient assets to pay benefits when due.<br />
Generally, the smaller the percentage, the<br />
stronger the system.<br />
The following Schedule of Funding Progress,<br />
presented as RSI, shows multiyear trend<br />
information which illustrates whether the<br />
actuarial value of plan assets are increasing or<br />
decreasing over time relative to the actuarial<br />
accrued liability for benefits. As addressed<br />
previously and as noted on the Schedule of<br />
Funding Progress, ERFC has transitioned to<br />
calendar year valuations. The most recent<br />
valuation was effective December 31, 2011. This<br />
transition to calendar year valuation was done in<br />
order to provide a more current contribution rate<br />
which could be included in the school system’s<br />
Superintendent’s proposed budget and to provide<br />
more accurate information to the actuary for the<br />
annual valuation.