CAFR - Fairfax County Public Schools
CAFR - Fairfax County Public Schools
CAFR - Fairfax County Public Schools

You also want an ePaper? Increase the reach of your titles
YUMPU automatically turns print PDFs into web optimized ePapers that Google loves.
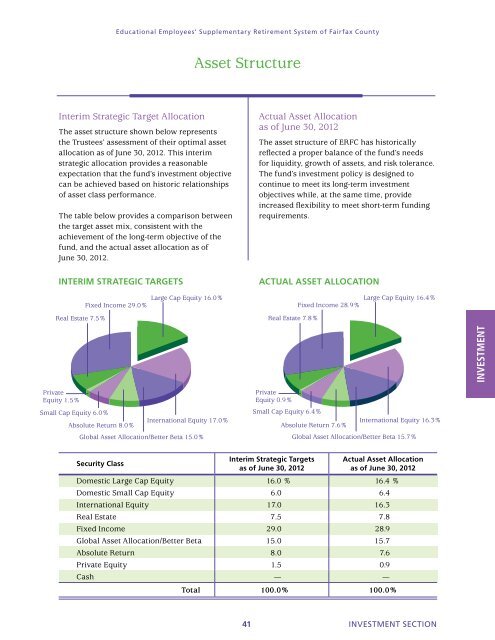
Educational Employees’ Supplementary Retirement System of <strong>Fairfax</strong> county<br />
Interim Strategic Target Allocation<br />
The asset structure shown below represents<br />
the Trustees’ assessment of their optimal asset<br />
allocation as of June 30, 2012. This interim<br />
strategic allocation provides a reasonable<br />
expectation that the fund’s investment objective<br />
can be achieved based on historic relationships<br />
of asset class performance.<br />
The table below provides a comparison between<br />
the target asset mix, consistent with the<br />
achievement of the long-term objective of the<br />
fund, and the actual asset allocation as of<br />
June 30, 2012.<br />
Real Estate 7.5%<br />
Private<br />
Equity 1.5%<br />
Small Cap Equity 6.0%<br />
Large Cap Equity 16.0%<br />
Fixed Income 29.0%<br />
Absolute Return 8.0%<br />
International Equity 17.0%<br />
Global Asset Allocation/Better Beta 15.0%<br />
security Class<br />
Asset Structure<br />
Actual Asset Allocation<br />
as of June 30, 2012<br />
The asset structure of ERFC has historically<br />
reflected a proper balance of the fund’s needs<br />
for liquidity, growth of assets, and risk tolerance.<br />
The fund’s investment policy is designed to<br />
continue to meet its long-term investment<br />
objectives while, at the same time, provide<br />
increased flexibility to meet short-term funding<br />
requirements.<br />
inTERiM sTRaTEGiC TaRGETs aCTual assET alloCaTion<br />
Real Estate 7.8%<br />
Private<br />
Equity 0.9%<br />
Small Cap Equity 6.4%<br />
Large Cap Equity 16.4%<br />
Fixed Income 28.9%<br />
Absolute Return 7.6%<br />
interim strategic Targets<br />
as of June 30, 2012<br />
International Equity 16.3%<br />
Global Asset Allocation/Better Beta 15.7%<br />
actual asset allocation<br />
as of June 30, 2012<br />
Domestic Large Cap Equity 16.0 % 16.4 %<br />
Domestic Small Cap Equity 6.0 6.4<br />
International Equity 17.0 16.3<br />
Real Estate 7.5 7.8<br />
Fixed Income 29.0 28.9<br />
Global Asset Allocation/Better Beta 15.0 15.7<br />
Absolute Return 8.0 7.6<br />
Private Equity 1.5 0.9<br />
Cash — —<br />
Total 100.0% 100.0%<br />
41 INVESTMENT SEcTIoN<br />
INVESTMENT