The effects of road pricing - Feweb - Vrije Universiteit Amsterdam
The effects of road pricing - Feweb - Vrije Universiteit Amsterdam
The effects of road pricing - Feweb - Vrije Universiteit Amsterdam

Create successful ePaper yourself
Turn your PDF publications into a flip-book with our unique Google optimized e-Paper software.
Road Pricing<br />
Effectiveness, Acceptance<br />
and Institutional Aspects<br />
Barry Ubbels
© Barry Ubbels, 2006<br />
Cover illustration:<br />
This research has been carried out within the NWO/Connekt VEV project on “A<br />
Multidisciplinay Study <strong>of</strong> Pricing Policies in Transport”; nr. 014-34-351. Financial<br />
support is gratefully acknowledged.
VRIJE UNIVERSITEIT<br />
Road Pricing<br />
Effectiveness, Acceptance and Institutional Aspects<br />
ACADEMISCH PROEFSCHRIFT<br />
ter verkrijging van de graad Doctor aan<br />
de <strong>Vrije</strong> <strong>Universiteit</strong> <strong>Amsterdam</strong>,<br />
op gezag van de rector magnificus<br />
pr<strong>of</strong>.dr. L.M. Bouter,<br />
in het openbaar te verdedigen<br />
ten overstaan van de promotiecommissie<br />
van de faculteit der Economische Wetenschappen en Bedrijfskunde<br />
op woensdag 27 september 2006 om 15.45 uur<br />
in de aula van de universiteit,<br />
De Boelelaan 1105<br />
door<br />
Barry Johan Ubbels<br />
geboren te Monnickendam
promotoren: pr<strong>of</strong>.dr. E.T. Verhoef<br />
pr<strong>of</strong>.dr. P. Rietveld<br />
pr<strong>of</strong>.dr. P. Nijkamp
Acknowledgements<br />
This dissertation contains the results <strong>of</strong> research carried out at the Department <strong>of</strong> Spatial<br />
Economics <strong>of</strong> the <strong>Vrije</strong> <strong>Universiteit</strong> in <strong>Amsterdam</strong>. My work was part <strong>of</strong> the project “A<br />
Multidisciplinary Study <strong>of</strong> Pricing Policies in Transport” funded by the Netherlands<br />
Organisation for Scientific Research (NWO) and Connekt (the innovation network for<br />
traffic and transport in the Netherlands). Many people have contributed to reaching this<br />
point after more than 4 years <strong>of</strong> work when I can say at last: the thesis is done! Without<br />
their help and support I would never have arrived at this destination.<br />
First <strong>of</strong> all, I would like to thank my supervisors Peter Nijkamp, Piet Rietveld and Erik<br />
Verhoef. Peter Nijkamp was the one who ‘discovered’ me, to speak in soccer terms. His<br />
enthusiasm and experience has not only helped me a lot in my first years in the world <strong>of</strong><br />
contract research, he also initiated my interest in writing this dissertation. When starting<br />
this research, supervision and guidance were also provided by Piet and Erik; I greatly<br />
appreciated working with them. Piet was always helpful with useful suggestions<br />
whenever needed, and made me believe that academic research is a serious thing. Erik<br />
taught me that scientific work is also fun, and I very much enjoyed working with him.<br />
<strong>The</strong> door <strong>of</strong> Erik’s room was always open which was very useful to me, especially in<br />
those days when Mathematica was not performing as I thought it should do. In return, I<br />
think his soccer abilities are now greatly improved after my training programmes in<br />
preparation <strong>of</strong> the ERSA tournaments.<br />
<strong>The</strong> congenial environment in the corridor on the fourth floor was also very important in<br />
my journey to completion. <strong>The</strong> first to mention is Ron, together we form the well-known<br />
‘Baron’, working in the same room for almost eight years, do I need to say more? His<br />
presence guarantees fun, soccer and optimism, but he was also open to discuss more<br />
serious issues which was very much appreciated. It remains a pity that I was unable to<br />
improve his soccer skills. Caroline was also a very pleasant presence in our room over<br />
the past years. We failed in a way because she was the first who completed a thesis; she<br />
left without any interest in soccer (let alone skills) and without liking even one kind <strong>of</strong><br />
alcoholic drink.<br />
I would also like to thank other colleagues at the Department for providing an excellent<br />
research environment. <strong>The</strong> open and informal atmosphere always made it possible to ask<br />
for information and discuss issues that I found difficult. Thomas, thanks for your time to<br />
help me with some econometrics. Frank was not only a good goalkeeper, he also<br />
explained what eternally funded research was all about. Eric woke me up for important<br />
meetings such as Eureka and lunches, and Eveline was always in for having a drink with<br />
a big smile (but not on a Friday). Of course, I cannot forget Henk, Hadewijch, Daniel,<br />
Henri, Gert-Jan, Mark, Bart, Willemijn, Jan, Martijn, Jos, Olaf, YinYen (thanks for the<br />
help with Limdep) and Jeroen, who all contributed to an enjoyable stay. <strong>The</strong> support and<br />
smiles <strong>of</strong> the secretariat were also very much appreciated, thanks Elfie, Trudy, Ellen and<br />
Jody.<br />
Many thanks also to my colleagues outside the VU, whom I have met at conferences<br />
(Michiel, Berry, Barry etc.), workshops and seminars, and who commented on my<br />
research. I would also like to mention the other members <strong>of</strong> the MD-PIT team with<br />
whom I have had numerous discussions and useful feedback. <strong>The</strong> multidisciplinary<br />
approach was very instructive and challenging. Furthermore, I would like to thank the<br />
i
members <strong>of</strong> my promotion committee for their time and useful comments and<br />
suggestions.<br />
I also owe a lot to the people who always thought I was on holiday when I went to<br />
serious conferences and other project meetings ab<strong>road</strong>. <strong>The</strong> fun during the days-<strong>of</strong>f has<br />
been very important to free my mind and think about completely other things. At last, it<br />
is possible to show them my ‘book’ which is actually the pro<strong>of</strong> that I have been doing<br />
‘something’. It also proves my point at the numerous discussions about congestion and<br />
<strong>road</strong> <strong>pricing</strong>: it can be effective. But indeed, my friends made me aware <strong>of</strong> the fact that<br />
acceptance is something else. Nevertheless, I would like to thank them for their<br />
friendship and support. <strong>The</strong>ir encouragement was there in good and in bad times. I hope<br />
that my paranymphs Edwin and Olaf enjoy the <strong>of</strong>ficial part <strong>of</strong> my defence, indeed it<br />
looks like carnaval but in this case it is somewhat more serious! Werner, sorry for all<br />
the squash lessons, but it was really a good way to forget the daily econometrics. Thanks<br />
also to Peter for his interest in my work, and the fun we had during our winter sports<br />
activities. For the rest <strong>of</strong> the long evenings and late nights, I would like to mention<br />
Johan, Mario, Richard, Frank, Marc, Peter and the rest <strong>of</strong> the (party) crew, their<br />
girlfriends, and the soccer teams <strong>of</strong> both Monnickendam and Volendam.<br />
Last, but not least, I would like to thank my parents for their love and continuous<br />
support over the last 31 years. <strong>The</strong>y were always there when I needed them. <strong>The</strong>y never<br />
complained about me writing a thesis, but I wouldn’t do so either when your son invites<br />
you to travel to destinations such as Santa Barbara and Porto. Hope you enjoyed the<br />
previous time as much as I did!<br />
Barry<br />
Monnickendam, June, 2006<br />
ii
CHAPTER 1.....................................................................................................................1<br />
INTRODUCTION................................................................................................................1<br />
1.1 Transport...........................................................................................................1<br />
1.2 Transport <strong>pricing</strong> ..............................................................................................2<br />
1.3 Aims and scope <strong>of</strong> the study ..............................................................................3<br />
1.4 Structure <strong>of</strong> the study.........................................................................................4<br />
CHAPTER 2.....................................................................................................................9<br />
THE ECONOMICS OF TRANSPORT PRICING.........................................................................9<br />
2.1 Introduction.......................................................................................................9<br />
2.2 Transport <strong>pricing</strong> ............................................................................................10<br />
2.3 Economic efficiency and equity in <strong>pricing</strong> ......................................................11<br />
2.4 Deviations from first-best <strong>pricing</strong> ...................................................................16<br />
2.5 Second-best <strong>pricing</strong> issues...............................................................................25<br />
2.6 Conclusions .....................................................................................................28<br />
PART I: BEHAVIOURAL RESPONSES TO TRANSPORT PRICING ................31<br />
CHAPTER 3...................................................................................................................33<br />
BEHAVIOURAL RESPONSES TO ROAD PRICING ................................................................33<br />
3.1 Introduction.....................................................................................................33<br />
3.2 <strong>The</strong> price <strong>of</strong> car use and behavioural response ..............................................34<br />
3.3 Behavioural responses in theoretical and empirical models ..........................35<br />
3.3.1 Trip suppression............................................................................................................................. 36<br />
3.3.2 Departure time choice .................................................................................................................... 36<br />
3.3.3 Route choice behaviour.................................................................................................................. 37<br />
3.3.4 Modal split choice.......................................................................................................................... 37<br />
3.3.5 Vehicle occupancy ......................................................................................................................... 38<br />
3.3.6 Location choices ............................................................................................................................ 38<br />
3.3.7 Driving behaviour (speed choice) .................................................................................................. 39<br />
3.3.8 Vehicle ownership.......................................................................................................................... 39<br />
3.3.9 Technology choice ......................................................................................................................... 39<br />
3.3.10 Variabilisation................................................................................................................................ 40<br />
3.4 Behavioural responses: empirical findings.....................................................42<br />
3.4.1 Elasticities...................................................................................................................................... 42<br />
3.4.2 Results from some practical experiences worldwide...................................................................... 48<br />
3.4.3 Overview........................................................................................................................................ 50<br />
3.5 Behavioural responses to <strong>road</strong> <strong>pricing</strong>: comparison <strong>of</strong> psychological and<br />
economic perspectives.....................................................................................51<br />
3.5.1 Results from psychology................................................................................................................ 51<br />
3.5.2 Comparison with economic findings.............................................................................................. 54<br />
3.6 Conclusions .....................................................................................................55<br />
CHAPTER 4...................................................................................................................57<br />
VALUING TIME, SCHEDULING, AND UNCERTAINTY: ESTIMATIONS FROM DISCRETE CHOICE<br />
MODELLING ...................................................................................................................57<br />
4.1 Introduction.....................................................................................................57<br />
4.2 Data sources and survey description ..............................................................58<br />
4.2.1 Data collection ............................................................................................................................... 58<br />
4.2.2 Survey ............................................................................................................................................ 58<br />
4.3 Analysis <strong>of</strong> interval estimates..........................................................................61<br />
4.3.1 How to derive interval estimates.................................................................................................... 61<br />
4.3.2 Results and statistical analysis ....................................................................................................... 62<br />
iii
4.4 Stated choice experiment: theoretical framework...........................................64<br />
4.4.1 Discrete choice models................................................................................................................... 64<br />
4.4.2 Choice model specification ............................................................................................................ 65<br />
4.5 Estimation results <strong>of</strong> stated choice experiment (SCE) data ............................66<br />
4.5.1 <strong>The</strong> basic multinomial logit (MNL) model .................................................................................... 66<br />
4.5.2 Observed heterogeneity: multinomial logit model with a set <strong>of</strong> covariates.................................... 70<br />
4.6 Conclusions .....................................................................................................72<br />
Appendix 4A.................................................................................................................................................... 74<br />
Appendix 4B.................................................................................................................................................... 75<br />
Appendix 4C.................................................................................................................................................... 76<br />
Appendix 4D.................................................................................................................................................... 77<br />
Appendix 4E.................................................................................................................................................... 79<br />
Appendix 4F .................................................................................................................................................... 80<br />
CHAPTER 5...................................................................................................................81<br />
THE EFFECTS OF ROAD PRICING: SHORT-TERM RESPONSES AND CAR OWNERSHIP FROM A<br />
SURVEY AMONG CAR OWNERS .......................................................................................81<br />
5.1 Introduction.....................................................................................................81<br />
5.2 Data collection and survey description...........................................................81<br />
5.2.1 Data collection ............................................................................................................................... 81<br />
5.2.2 Survey ............................................................................................................................................ 82<br />
5.3 Effectiveness <strong>of</strong> different <strong>pricing</strong> regimes .......................................................84<br />
5.3.1 Measure 1: flat kilometre charge (3, 6 and 12 €cents) and different revenue use........................... 84<br />
5.3.2 Measure 2: kilometre charge with multi-step bottleneck toll (2A), and kilometre charge<br />
differentiated according to weight <strong>of</strong> the vehicle (2B)..................................................................................... 86<br />
5.3.3 Measure 3: peak and <strong>of</strong>f peak kilometre charge with different revenue use................................... 87<br />
5.3.4 Overview........................................................................................................................................ 88<br />
5.4 Statistical analysis on effectiveness <strong>of</strong> <strong>pricing</strong> measures................................90<br />
5.4.1 Methodology .................................................................................................................................. 90<br />
5.4.2 Results for measure 1: a kilometre charge (3, 6 and 12 €cents,) and different types <strong>of</strong> revenue use<br />
92<br />
5.4.3 Results for measure 2: a kilometre charge with multi-step bottleneck toll (2A), and a kilometre<br />
charge differentiated according to weight <strong>of</strong> the vehicle (2B) ......................................................................... 93<br />
5.4.4 Results for measure 3: a peak and <strong>of</strong>f-peak kilometre charge, with different revenue use............ 94<br />
5.5 Car ownership .................................................................................................95<br />
5.5.1 Survey ............................................................................................................................................ 96<br />
5.5.2 Results for measures 1, 2 and 3...................................................................................................... 96<br />
5.5.3 Results for measure 4: an increase <strong>of</strong> car ownership taxes and decrease <strong>of</strong> fuel costs ................... 98<br />
5.6 Conclusions ...................................................................................................100<br />
Appendix 5A.................................................................................................................................................. 103<br />
Appendix 5B.................................................................................................................................................. 104<br />
Appendix 5C.................................................................................................................................................. 105<br />
PART II: INSTITUTIONAL ASPECTS OF TRANSPORT PRICING ................107<br />
CHAPTER 6.................................................................................................................109<br />
AUCTIONING CONCESSIONS FOR PRIVATE ROADS.........................................................109<br />
6.1 Introduction...................................................................................................109<br />
6.2 Investment and <strong>pricing</strong> <strong>of</strong> infrastructure.......................................................109<br />
6.3 A modelling framework for evaluating auctions for private <strong>road</strong>s...............111<br />
6.3.1 Previous studies............................................................................................................................ 112<br />
6.3.2 Model formulation ....................................................................................................................... 113<br />
6.3.3 Numerical Example...................................................................................................................... 115<br />
6.3.4 Auction rules for governments..................................................................................................... 116<br />
6.3.5 Sensitivity analysis....................................................................................................................... 119<br />
6.4 Conclusions ...................................................................................................123<br />
Appendix 6A.................................................................................................................................................. 125<br />
Appendix 6B.................................................................................................................................................. 126<br />
Appendix 6C.................................................................................................................................................. 127<br />
Appendix 6D.................................................................................................................................................. 129<br />
iv
CHAPTER 7.................................................................................................................133<br />
GOVERNMENTAL COMPETITION IN ROAD CHARGING AND CAPACITY CHOICE...............133<br />
7.1 Introduction...................................................................................................133<br />
7.2 Previous literature on governmental competition in a small network setting: a<br />
review ............................................................................................................134<br />
7.2.1 Horizontal linkages ...................................................................................................................... 134<br />
7.2.2 Vertical linkages .......................................................................................................................... 135<br />
7.3 A modelling framework to study government competition............................137<br />
7.3.1 Model formulation ....................................................................................................................... 137<br />
7.3.2 Numerical example ...................................................................................................................... 139<br />
7.3.3 Non-cooperative game equilibria ................................................................................................. 141<br />
7.3.4 Sensitivity analysis....................................................................................................................... 146<br />
7.4 Conclusions ...................................................................................................148<br />
Appendix 7A.................................................................................................................................................. 150<br />
Appendix 7B.................................................................................................................................................. 151<br />
Appendix 7C.................................................................................................................................................. 156<br />
PART III: ACCEPTABILITY OF TRANSPORT PRICING.................................157<br />
CHAPTER 8.................................................................................................................159<br />
ACCEPTANCE OF ROAD PRICING AND REVENUE USE.....................................................159<br />
8.1 Introduction...................................................................................................159<br />
8.2 Barriers to <strong>road</strong> <strong>pricing</strong> ................................................................................159<br />
8.2.1 Technological and practical barriers ..................................................................................................... 160<br />
8.2.2 Acceptability barriers............................................................................................................................ 161<br />
8.2.3 Institutional barriers.............................................................................................................................. 161<br />
8.3 Acceptability <strong>of</strong> <strong>road</strong> <strong>pricing</strong>.........................................................................162<br />
8.3.1 Acceptability and the implementation <strong>of</strong> <strong>road</strong> <strong>pricing</strong> ................................................................. 163<br />
8.3.2 Lessons from practical experiences.............................................................................................. 165<br />
8.4 <strong>The</strong> importance <strong>of</strong> revenue use: efficiency and acceptability .......................169<br />
8.4.1 Revenue Use and Economic Efficiency ....................................................................................... 170<br />
8.4.2 Revenue use and acceptability ..................................................................................................... 173<br />
8.5 Conclusions ...................................................................................................175<br />
CHAPTER 9.................................................................................................................177<br />
WHAT DRIVES ACCEPTANCE? AN EXPLANATORY SEARCH FOR ACCEPTANCE LEVELS OF<br />
ROAD PRICING AMONG DUTCH CAR COMMUTERS AND CAR OWNERS IN GENERAL........177<br />
9.1 Introduction...................................................................................................177<br />
9.2 Acceptability and revenue use: a survey among car commuters experiencing<br />
congestion......................................................................................................177<br />
9.2.1 Data collection and survey ........................................................................................................... 178<br />
9.2.2 General results.............................................................................................................................. 179<br />
9.2.3 A search for explanatory variables <strong>of</strong> the acceptance levels <strong>of</strong> 3 <strong>road</strong> <strong>pricing</strong> measures and 6 types<br />
<strong>of</strong> revenue use................................................................................................................................................ 180<br />
9.3 Acceptance and revenue use: a survey among car owners...........................188<br />
9.3.1 Data collection and survey ........................................................................................................... 188<br />
9.3.2 General results.............................................................................................................................. 189<br />
9.3.3 A search for explanatory variables <strong>of</strong> acceptance levels for 3 <strong>road</strong> <strong>pricing</strong> measures.................. 190<br />
9.3.4 Effectiveness and acceptance ....................................................................................................... 195<br />
9.4 Overview and comparison.............................................................................196<br />
9.5 Conclusions ...................................................................................................197<br />
Appendix 9A.................................................................................................................................................. 199<br />
Appendix 9B.................................................................................................................................................. 200<br />
Appendix 9C.................................................................................................................................................. 201<br />
Appendix 9D.................................................................................................................................................. 202<br />
Appendix 9E.................................................................................................................................................. 204<br />
Appendix 9F .................................................................................................................................................. 205<br />
v
CHAPTER 10...............................................................................................................207<br />
SYNTHESIS...................................................................................................................207<br />
10.1 Overview and conclusions.............................................................................207<br />
10.2 Policy recommendations ...............................................................................209<br />
10.3 Research agenda ...........................................................................................211<br />
REFERENCES.............................................................................................................213<br />
NEDERLANDSE SAMENVATTING (SUMMARY IN DUTCH) .........................226<br />
vi
Chapter 1<br />
Introduction<br />
1.1 Transport<br />
Transport is an essential service in any society. Goods transportation ensures that<br />
products can be shipped from factories to markets. Passenger transport, both private and<br />
public, allows people to visit each other, go to work or school, and participate in a<br />
myriad <strong>of</strong> economic and social activities. <strong>The</strong> benefits <strong>of</strong> transport are many and varied:<br />
an efficient transport system is <strong>of</strong>ten a major precondition for economic growth,<br />
competitiveness and employment. Transport is mainly a derived activity, which means<br />
that for most individuals it is a way to facilitate other activities. Depending on the<br />
characteristics and requirements <strong>of</strong> these activities and the persons and goods involved,<br />
transportation can take place via the air, the sea, inland waterways, or the land.<br />
Transportation on land can take place by different means: walking, cycling, bus, train,<br />
truck or car. This thesis is concerned with the last option: private car transport.<br />
Since the early 1950s all developed countries have witnessed a ‘mobility explosion’.<br />
<strong>The</strong> performance <strong>of</strong> the European transport sector has been in line with the expanding<br />
economy. For instance, from 1970 to 2000 total European goods transport in the (at that<br />
time) 15 Member States grew by 119% (from 1.4 million tkm to 3.1 million tkm)<br />
(Eurostat, 2003). Considering only inland transport, it appears that this considerable<br />
growth has been almost entirely realised by <strong>road</strong> transport (with a share <strong>of</strong> 74% in total<br />
freight transport). <strong>The</strong>se figures show the growing <strong>road</strong> travel demand by the freight<br />
sector.<br />
Trends in passenger transport also show the dominance and growth <strong>of</strong> <strong>road</strong> transport.<br />
Table 1.1 shows passenger travel demand for the first EU-15 countries between 1970<br />
and 2000. Total transport demand increased by 126%, with passenger car transport<br />
progressing at an even higher pace. <strong>The</strong> average distance travelled per person per year<br />
has also increased rapidly, which is primarily due to people travelling further rather than<br />
travelling more frequently (Banister et al., 2000). Besides economic growth and<br />
increasing income levels, one <strong>of</strong> the main factors behind the increased demand for<br />
passenger mobility has been the geographical dispersion <strong>of</strong> economic activity, with a<br />
clear trend towards moving away from the urban centres. Consequently, there has been<br />
an ongoing separation <strong>of</strong> place <strong>of</strong> work and residential areas, leading to an increase in<br />
commuting.<br />
Table 1.1: Passenger transport performance by mode in the EU-15 (1000 million pkm)<br />
Passenger Buses and Tram and Railway Air (intra-EU Total<br />
cars coaches metro<br />
and domestic)<br />
1970 1582 269 39 219 33 2142<br />
1990 3199 369 48 268 157 4041<br />
2000 3789 413 53 303 281 4839<br />
1970-2000 (%) +140 +53 +36 +38 +753 +126<br />
Source: Eurostat (2003).<br />
<strong>The</strong> demand for mobility has largely been satisfied by the increased use <strong>of</strong> private cars,<br />
which accounts today for roughly three-quarters <strong>of</strong> all trips. <strong>The</strong> car is attractive because<br />
it <strong>of</strong>fers a high degree <strong>of</strong> independence and flexibility. Higher disposable incomes have<br />
resulted in a higher level <strong>of</strong> car ownership. <strong>The</strong> number <strong>of</strong> passenger cars per 1000<br />
1
inhabitants has continuously increased from 1996 to 2001 in every EU-25 country, in<br />
total by 12% (Eurostat, 2004).<br />
Unfortunately, the trend <strong>of</strong> increased <strong>road</strong> travel demand and automobile ownership has<br />
had negative consequences in terms <strong>of</strong> increasing congestion, environmental degradation<br />
and accidents. <strong>The</strong> rate <strong>of</strong> growth <strong>of</strong> car ownership was so fast that the supply <strong>of</strong> new<br />
infrastructure fell behind. <strong>The</strong> capacity <strong>of</strong> the existing <strong>road</strong> infrastructure became too<br />
small, particularly at specific sites during specific times <strong>of</strong> the day. Traffic congestion is<br />
nowadays a recurring ingredient <strong>of</strong> everyday life, making millions <strong>of</strong> car drivers suffer<br />
from significant time losses. Road transport is also one <strong>of</strong> the largest sources <strong>of</strong><br />
environmental pollution in Europe. Environmental impacts associated with car use are<br />
considerable, and concern energy and mineral resources, land resources, air quality<br />
(emissions), noise and health (injuries and deaths from accidents). Estimates <strong>of</strong> these<br />
environmental costs <strong>of</strong> <strong>road</strong> use (excluding vehicle operating costs) amount on average<br />
to some 1.6% <strong>of</strong> GDP in Western Europe, including the external costs <strong>of</strong> accidents<br />
(0.5%), air pollution (0.6%), noise (0.3%) and global warming (0.2%) (UNITE, 2003).<br />
<strong>The</strong> total costs <strong>of</strong> <strong>road</strong> congestion amount to a further 1% according to this study.<br />
Whilst the nature <strong>of</strong> this transport problem differs across regions, the calls for policy<br />
action are intensifying everywhere. Policy makers can choose from a range <strong>of</strong> policy<br />
instruments that deal with different transport externalities. Governments may influence<br />
the achievement <strong>of</strong> a more sustainable transport system by introducing regulations,<br />
imposing taxes, or providing subsidies (e.g. to stimulate the use and development <strong>of</strong><br />
cleaner vehicles). In the present study, the focus is on one specific instrument that is<br />
available to policy makers: transport <strong>pricing</strong>.<br />
1.2 Transport <strong>pricing</strong><br />
Transport economists have <strong>of</strong>ten claimed that price policies should be one <strong>of</strong> the main<br />
pillars <strong>of</strong> transport policy making. <strong>The</strong> idea would be that prices reflecting marginal<br />
costs would induce individuals to behave in a socially beneficial manner, and would thus<br />
lead to an efficiency improvement <strong>of</strong> the transport system, because in the present<br />
transport market prices are generally not optimal. In the competitive model, the<br />
equilibrium price <strong>of</strong> an object will normally equal its cost <strong>of</strong> production (including the<br />
amount needed to pay a firm’s owner to stay in business rather than seek some other<br />
form <strong>of</strong> employment). Elementary economics tells us that, in the long run, price will<br />
then be equated with the marginal (and average) costs <strong>of</strong> each supplier. But the transport<br />
market is different. Simple market economic theory cannot directly be applied to<br />
transport for a variety <strong>of</strong> reasons (see Chapter 2 <strong>of</strong> this thesis). Transport prices do not<br />
simply result from the law <strong>of</strong> supply and demand. Consequently, transport system users<br />
currently do not perceive the full marginal social costs <strong>of</strong> their travel decisions. This<br />
leads to traffic volumes in excess <strong>of</strong> what is socially desirable, and it implies a<br />
suboptimal distribution <strong>of</strong> transport flows over time and space. Economic theory argues<br />
that prices should be corrected, and hence there is a role for governments to intervene in<br />
the market.<br />
Although transport <strong>pricing</strong> seems to have found its way into both Dutch and European<br />
policy documents, the practical reality <strong>of</strong>ten appears quite different from the<br />
economically ideal situation. Governments have <strong>of</strong>ten objectives other than efficiency.<br />
Pricing measures in car transport are in many cases used to raise revenues, or assist in<br />
traffic control, and not so much to reduce congestion or internalise external costs. But<br />
the emerging problems in traffic, such as congestion, call for a possibly more efficient<br />
<strong>pricing</strong> strategy. It is <strong>of</strong> course important to know about the possible <strong>effects</strong> <strong>of</strong> new<br />
2
<strong>pricing</strong> regimes. But it is also relevant to analyse the barriers to <strong>pricing</strong> measures,<br />
providing evidence why possibly more efficient solutions have not yet been introduced.<br />
1.3 Aims and scope <strong>of</strong> the study<br />
Transport <strong>pricing</strong> has been studied by (transport) economists for many decades now, but<br />
especially now that sophisticated electronic transport <strong>pricing</strong> schemes are increasingly<br />
becoming technically feasible and politically acceptable, it is fair to admit that there are<br />
many unsettled issues in our understanding <strong>of</strong> the economics <strong>of</strong> transport <strong>pricing</strong>. This is<br />
to a considerable extent due to the economists’ ‘habit’ <strong>of</strong> presenting economic insights<br />
using highly simplified models <strong>of</strong> a very complicated multi-actor reality – and<br />
specifically – <strong>of</strong> human behaviour. Although this has a clear advantage in terms <strong>of</strong><br />
exposition and communication <strong>of</strong> ideas, it may <strong>of</strong>ten leave policy makers empty handed<br />
as soon as the insights are to be implemented in reality. Blind spots in our knowledge<br />
and understanding <strong>of</strong> the optimal design and possible consequences <strong>of</strong> price policies in<br />
transport are also due to the complex nature <strong>of</strong> transport markets, in which actors’<br />
decision making and behaviour not only involves a great number <strong>of</strong> dimensions (e.g.<br />
mode, route, time <strong>of</strong> day) but in addition are closely interacting with behaviour in many<br />
other markets (e.g. spatial behaviour in terms <strong>of</strong> locational choice <strong>of</strong> living, working,<br />
shopping and recreating; labour supply decisions; telecommunication, etc.). But, as<br />
previously mentioned, there are not only uncertainties in the consequences, it is also<br />
very relevant to obtain knowledge about issues important to implementation (<strong>of</strong> which<br />
acceptance seems to be most relevant nowadays). This thesis aims to study these<br />
relevant aspects <strong>of</strong> transport <strong>pricing</strong> from the economic perspective in a<br />
multidisciplinary setting. We start with a more general approach <strong>of</strong> transport <strong>pricing</strong>, the<br />
applied work will focus on private <strong>road</strong> transport and <strong>road</strong> <strong>pricing</strong> in particular.<br />
This study results from a multidisciplinary project (MultiDisciplinary research <strong>of</strong> Pricing<br />
in Transport: MD-PIT) that aims at providing a theoretical and empirical evaluation <strong>of</strong><br />
the direct and indirect <strong>effects</strong> <strong>of</strong> practically feasible <strong>road</strong> <strong>pricing</strong> policies. <strong>The</strong> <strong>effects</strong><br />
studied include behavioural responses and their consequences, as well as acceptability<br />
issues <strong>of</strong> various <strong>pricing</strong> and tax recycling schemes, and some specific institutional<br />
issues. <strong>The</strong> evaluation includes the derivation and formulation <strong>of</strong> policy implications. In<br />
order to accomplish this main research objective, we defined three different questions:<br />
1. What behavioural responses to transport <strong>pricing</strong> can be expected to occur, and what<br />
does this mean for the design <strong>of</strong> first-best and second-best <strong>pricing</strong> schemes?<br />
2. What implications can institutional issues have for the design and efficiency <strong>of</strong> <strong>road</strong><br />
<strong>pricing</strong>? Since many institutional issues can be distinguished, we have identified two<br />
specific cases <strong>of</strong> interest: the case where private involvement in setting <strong>road</strong> <strong>pricing</strong><br />
and <strong>road</strong> capacity is considered by a government; and secondly, the case where two<br />
different levels <strong>of</strong> government are involved in the design <strong>of</strong> <strong>road</strong> transport <strong>pricing</strong><br />
schemes.<br />
3. What factors determine the social acceptability <strong>of</strong> transport <strong>pricing</strong>; what role does<br />
the allocation <strong>of</strong> revenues play here; and what are the most important trade-<strong>of</strong>fs that<br />
have to be made between the efficiency and social acceptability <strong>of</strong> <strong>pricing</strong> schemes<br />
and revenue allocation schemes?<br />
Answering these questions requires a solid theoretical basis. <strong>The</strong>refore, we begin with a<br />
literature review <strong>of</strong> the economics <strong>of</strong> transport <strong>pricing</strong>, explaining the motivation for<br />
transport <strong>pricing</strong> including efficiency and equity. For the evaluation and design <strong>of</strong><br />
transport <strong>pricing</strong> strategies, it is <strong>of</strong> course important to have insight into the behavioural<br />
responses. This will to a considerable extent depend on the exact design <strong>of</strong> the <strong>pricing</strong><br />
3
scheme (e.g. a kilometre charge will most likely have more effect on kilometres driven<br />
than car ownership taxes to be paid yearly). Equally important, however, is the price<br />
sensitivity <strong>of</strong> car drivers for the various relevant dimensions <strong>of</strong> behaviour that together<br />
define transport behaviour. A literature review (Chapter 3) aims to identify relevant<br />
dimensions (e.g. departure time choice, mode choice etc.) and to assess their potential<br />
empirical relevance. <strong>The</strong> economic findings will be compared with those <strong>of</strong><br />
psychologists and traffic engineers.<br />
<strong>The</strong> results from this literature review (open issues, relevant policy measures) are then<br />
input for the design <strong>of</strong> the surveys. <strong>The</strong> empirical work aims to determine the<br />
behavioural responses to <strong>road</strong> <strong>pricing</strong> in the Netherlands. Since we evaluate new types<br />
<strong>of</strong> <strong>road</strong> <strong>pricing</strong> measures (not-yet existing in the Netherlands), we make use <strong>of</strong> stated<br />
preference techniques. Such techniques are considered especially useful when dealing<br />
with hypothetical situations where revealed preference measurement is not possible. <strong>The</strong><br />
first survey asks the respondent to make choices between different hypothetical<br />
situations. <strong>The</strong> choice data have been analysed by estimating different choice models<br />
with the aim to determine the preferences <strong>of</strong> the respondents (commuters). <strong>The</strong> logit<br />
family <strong>of</strong> models is recognised as the essential toolkit for studying discrete choices. We<br />
present estimates from the multinomial logit model. <strong>The</strong>se outcomes allow us also to<br />
derive estimates for important parameters such as the value <strong>of</strong> time, which provides a<br />
useful update for policy analysis. Unlike most other studies in this field, we also derive<br />
parameter estimates on an individual level. A second set <strong>of</strong> questions simply asked for<br />
the behavioural responses to different <strong>pricing</strong> measures. Effectiveness levels have been<br />
analysed qualitatively as well as quantitatively (in the form <strong>of</strong> a statistical analysis to<br />
explain the level <strong>of</strong> effectiveness). While most studies focused on trip suppression only,<br />
we analyse diverting behaviour (which alternative will be chosen).<br />
One reason for optimal <strong>pricing</strong> being not very realistic is the existence <strong>of</strong> institutional<br />
constraints. <strong>The</strong> second question deals therefore with two (out <strong>of</strong> many) important<br />
institutional aspects <strong>of</strong> transport <strong>pricing</strong>. We use a small theoretical network model to<br />
investigate the implied efficiency <strong>effects</strong> <strong>of</strong> the inclusion <strong>of</strong> the private sector into <strong>road</strong><br />
construction and operation, as well as the competition between different levels <strong>of</strong><br />
governments in this. We consider different settings where capacity and <strong>road</strong>s are free to<br />
choose leading to interesting new insights.<br />
In order to answer the third question, again a literature review is carried out that deals<br />
with the efficiency aspects and acceptability aspects <strong>of</strong> transport <strong>pricing</strong> measures with<br />
explicit attention for the use <strong>of</strong> revenues. Acceptance and revenue use will also be<br />
analysed empirically, and questions addressing these issues have been included in the<br />
surveys. Statistical methods are applied to assess issues that explain the level <strong>of</strong><br />
acceptance. Unlike other studies we include information on individual’s behavioural<br />
responses and link effectiveness and acceptance scores.<br />
1.4 Structure <strong>of</strong> the study<br />
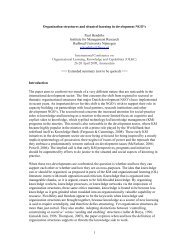
<strong>The</strong> organisation <strong>of</strong> this thesis is shown schematically in Figure 1.1. <strong>The</strong> core <strong>of</strong> the<br />
analysis starts with a theoretical overview <strong>of</strong> the economics <strong>of</strong> transport <strong>pricing</strong> (Chapter<br />
2). <strong>The</strong> economic principles discussed provide the basis for the three different research<br />
topics analysed in this thesis: the behavioural responses to transport <strong>pricing</strong> (Part I), the<br />
institutional issues <strong>of</strong> <strong>road</strong> <strong>pricing</strong> (Part II), and the acceptability <strong>of</strong> <strong>road</strong> <strong>pricing</strong> (Part<br />
III).<br />
Part I focuses on the effectiveness <strong>of</strong> <strong>road</strong> <strong>pricing</strong>. It begins with an overview <strong>of</strong> the<br />
existing literature on behavioural responses to transport <strong>pricing</strong>, followed by an<br />
empirical evaluation <strong>of</strong> the direct and indirect <strong>effects</strong> <strong>of</strong> feasible <strong>pricing</strong> schemes. Part II<br />
4
analyses the welfare consequences <strong>of</strong> situations where not one central government is<br />
responsible for <strong>road</strong> management, and prices are set by different (public or private)<br />
institutions. Parts I and II may show the attractiveness <strong>of</strong> transport <strong>pricing</strong> (in terms <strong>of</strong><br />
effectiveness and welfare gains), but we should not forget that there are considerable<br />
barriers to implementation. Part III deals with what is recently considered as the most<br />
important hurdle: acceptance. <strong>The</strong>oretical and empirical insights obtained in this part <strong>of</strong><br />
the analysis may lead to a reformulation <strong>of</strong> (effective) <strong>pricing</strong> measures addressed in the<br />
previous parts. <strong>The</strong> final chapter (Chapter 10) synthesises the previous chapters, draws<br />
conclusions, and suggests further research and policy recommendations.<br />
Looking more closely at the contents <strong>of</strong> this thesis, Chapter 2 deals with a literature<br />
review <strong>of</strong> the economics <strong>of</strong> transport <strong>pricing</strong>. Some key topics that are addressed include<br />
the economic motivation for transport <strong>pricing</strong>, efficiency and equity <strong>of</strong> transport <strong>pricing</strong>,<br />
and <strong>pricing</strong> in practice (first-best versus second-best <strong>pricing</strong>). Economic theory shows<br />
that optimal prices equal marginal social costs, but only under certain conditions. <strong>The</strong><br />
chapter states that the transport market is far from this ideal, and therefore discusses<br />
some major second-best issues that have recently been studied in transport economic<br />
theory.<br />
Figure 1.1: Outline <strong>of</strong> the research<br />
Part I analyses the behavioural responses to transport <strong>pricing</strong>. For the evaluation and<br />
design <strong>of</strong> transport <strong>pricing</strong> strategies, it is <strong>of</strong> course important to have insight into the<br />
behavioural responses induced by transport <strong>pricing</strong>. It begins in Chapter 3 with a<br />
literature overview <strong>of</strong> the consequences <strong>of</strong> <strong>road</strong> <strong>pricing</strong>. Special emphasis is put on<br />
assessing the implications <strong>of</strong> varying sensitivities with respect to the different<br />
behavioural dimensions distinguished in the economics literature. Given the<br />
multidisciplinary approach, we move one step further and compare the results (in terms<br />
<strong>of</strong> methods applied and effect sizes found) from economic theory with those <strong>of</strong> the<br />
5
psychology discipline, possibly indicating (in)consistencies. Chapter 4 presents the<br />
empirical findings <strong>of</strong> an extensive survey conducted among Dutch commuters who<br />
regularly experience congestion. <strong>The</strong> respondents faced a choice experiment in which<br />
they distributed 10 trips over 4 constructed alternatives. <strong>The</strong> estimated choice models<br />
provide information on the behavioural responses <strong>of</strong> the commuters in terms <strong>of</strong><br />
departure time, route choice and mode choice when confronted with <strong>road</strong> <strong>pricing</strong>.<br />
Moreover, we derive estimates for important transport policy concepts such as the value<br />
<strong>of</strong> time, value <strong>of</strong> schedule delay (early and late), and the value <strong>of</strong> uncertainty. This<br />
analysis focuses on the short-term responses <strong>of</strong> commuting traffic to <strong>road</strong> <strong>pricing</strong>.<br />
Chapter 5 presents the results from another survey with a different sample (car owners in<br />
general). It analyses the short-term responses <strong>of</strong> the respondents, but also includes the<br />
more long-term decision <strong>of</strong> car ownership. <strong>The</strong> data have been collected by a second<br />
questionnaire in which the respondents evaluated three different types <strong>of</strong> kilometre<br />
charges with varying use <strong>of</strong> revenues 1 .<br />
In Part II, two (out <strong>of</strong> many) important institutional aspects <strong>of</strong> transport <strong>pricing</strong> are<br />
considered. <strong>The</strong> first concerns <strong>pricing</strong> by private versus public operators (Chapter 6).<br />
This question is not only relevant for the foreseen privatisation <strong>of</strong> public transport<br />
systems, but may also soon become relevant for <strong>road</strong> transport, given the increasing<br />
interest in privately-operated pay-lanes or highways. <strong>The</strong> second aspect concerns the<br />
question <strong>of</strong> the level <strong>of</strong> government at which transport prices would be set (Chapter 7).<br />
Urban, regional, national, and transnational governments may frequently pursue<br />
different goals and would therefore <strong>of</strong>ten set different prices. Likewise, the use <strong>of</strong><br />
revenues may be strongly dependent on the level <strong>of</strong> government at which prices are set.<br />
Part III <strong>of</strong> the main analysis deals with acceptance issues <strong>of</strong> new <strong>road</strong> <strong>pricing</strong> measures.<br />
Economic theory has demonstrated (see Chapter 2) that the current <strong>pricing</strong> regimes are<br />
<strong>of</strong>ten not very efficient, and that there is scope for other types <strong>of</strong> measures. <strong>The</strong>se more<br />
efficient measures have so far only seldom been implemented in practice. <strong>The</strong> low level<br />
<strong>of</strong> implementation is nowadays not so much caused by technical or administrative<br />
problems. Rather, the problem is that it is generally acknowledged that <strong>pricing</strong> measures<br />
meet public resistance and that acceptability is one <strong>of</strong> the major barriers to the successful<br />
implementation <strong>of</strong> new and more efficient <strong>pricing</strong> measures. Chapter 8 investigates the<br />
barriers to <strong>road</strong> <strong>pricing</strong> by means <strong>of</strong> a literature review. Explicit attention is paid to the<br />
role <strong>of</strong> revenue use. <strong>The</strong> spending <strong>of</strong> the revenues from <strong>road</strong> <strong>pricing</strong> may have<br />
considerable consequences not only in terms <strong>of</strong> public acceptance but also for the<br />
overall efficiency <strong>of</strong> the scheme. <strong>The</strong> results <strong>of</strong> this survey on the empirical and<br />
theoretical work available on this topic are then used as input for the design <strong>of</strong> both<br />
questionnaires described in Part I. <strong>The</strong> questionnaires distributed to commuters and<br />
households do not only focus on behavioural responses, but also address the issue <strong>of</strong><br />
acceptability and revenue use. Chapter 9 presents the empirical results <strong>of</strong> the survey that<br />
was carried out. <strong>The</strong> aim is to identify important explanatory variables for the level <strong>of</strong><br />
acceptance for different types <strong>of</strong> <strong>road</strong> <strong>pricing</strong> measures, and to score different types <strong>of</strong><br />
revenue use in terms <strong>of</strong> acceptance.<br />
Finally, Chapter 10 brings all the results together. It provides a synthesis <strong>of</strong> the<br />
theoretical and empirical findings, puts them into a policy perspective, and indicates<br />
which directions are most promising for further research.<br />
1 <strong>The</strong> empirical part <strong>of</strong> this thesis analyses different types <strong>of</strong> <strong>road</strong> <strong>pricing</strong> measures. In most cases we have<br />
specified both the type <strong>of</strong> price measure and the type <strong>of</strong> revenue allocation. One <strong>of</strong> the measures includes<br />
variabilisation. This measure, policy relevant in the Netherlands, refers to the implementation <strong>of</strong> a<br />
kilometer charge together with the abolition <strong>of</strong> car taxation independent <strong>of</strong> car use (car ownership taxation<br />
and car purchase taxation).<br />
6
Chapter 2<br />
<strong>The</strong> economics <strong>of</strong> transport <strong>pricing</strong><br />
2.1 Introduction<br />
Transport forms an important part <strong>of</strong> everyone’s life. <strong>The</strong> spread <strong>of</strong> production, trade<br />
and ideas and the economic ascendancy <strong>of</strong> mankind all depend upon movement.<br />
Adequate transport is something that we tend to take for granted in the industrialised<br />
world, and if it is not available public concerns soon emerge. <strong>The</strong> reasons for this are<br />
not difficult to find. Comprehensive transport provision is perceived as an important<br />
input into the efficient functioning <strong>of</strong> modern industry and commerce. It also affords<br />
individuals and households the benefits <strong>of</strong> mobility.<br />
Transport has some characteristics that makes it different from other goods. Possibly<br />
the most important characteristic <strong>of</strong> transport is that it is <strong>of</strong>ten not really demanded in<br />
its own right (Button, 1993). People wish, in general, to travel so that some benefit<br />
can be obtained at the final destination. Similarly, users <strong>of</strong> freight transport perceive<br />
transport as a cost in their overall production function and seek to minimise it<br />
wherever possible.<br />
While the demand for transport has particular, if not unique, features, certain aspects<br />
<strong>of</strong> supply are also entirely peculiar to transport. More specifically, part <strong>of</strong> the supply<br />
is mobile – almost by definition – and is entirely different in its characteristics from<br />
the fixed infrastructure (for example, <strong>road</strong>s, airports, etc.). <strong>The</strong> fixed component is<br />
usually extremely long-lived and expensive to replace. Further, few elements <strong>of</strong><br />
transport infrastructure have alternative uses.<br />
Demand and supply work together to determine the market price in competitive<br />
markets. <strong>The</strong> price <strong>of</strong> a good or a service is what must be given in exchange for the<br />
good or service (Stiglitz and Driffill, 2000). In the competitive model, the equilibrium<br />
price <strong>of</strong> an object will normally equal its cost <strong>of</strong> production (including the amount<br />
needed to pay a firm’s owner to stay in business rather than seek some other form <strong>of</strong><br />
employment). Elementary economics tells us that, in the long run, price will then be<br />
equated with the marginal (and average) costs <strong>of</strong> each supplier. But the transport<br />
market is different. Simple market economic theory cannot directly be applied to<br />
transport for a variety <strong>of</strong> reasons. Since journeys are unique in space and time,<br />
monopoly is likely to arise in varying degrees, especially when technological change<br />
<strong>of</strong>fers an advantage to a particular mode, or where economies <strong>of</strong> scale affect one<br />
mode more than another. This situation also affects the <strong>pricing</strong> <strong>of</strong> transport services.<br />
Transport prices do not simply result from the law <strong>of</strong> supply and demand. This<br />
chapter addresses a range <strong>of</strong> complexities that arise due to the nature <strong>of</strong> the cost<br />
structure and the different market conditions generally observed in the transport<br />
sector. Although general <strong>pricing</strong> issues in transport will be discussed, particular<br />
attention will be paid to the <strong>pricing</strong> <strong>of</strong> passenger car transport.<br />
This chapter comprises several sections. We begin with a general discussion <strong>of</strong><br />
<strong>pricing</strong> issues in transport. Section 2.3 focuses on marginal cost <strong>pricing</strong>, including<br />
equity and efficiency. We move on to market failures and pay special attention to<br />
externalities, monopoly and indivisibilities, which play an important role in transport<br />
<strong>pricing</strong>. Section 2.5 discusses some second-best <strong>pricing</strong> issues, since a great deal <strong>of</strong><br />
research is nowadays focused on this topic. Finally some concluding remarks and<br />
lessons will be drawn from the issues raised in this chapter.<br />
9
2.2 Transport <strong>pricing</strong><br />
Pricing is a method <strong>of</strong> resource allocation. Pricing strategies permit specified aims to<br />
be achieved; there is no such thing as the ‘right’ price. <strong>The</strong> <strong>pricing</strong> policy adopted by<br />
any transport undertaking depends upon its basic objectives. For example, optimal<br />
price aimed at achieving pr<strong>of</strong>it maximisation may differ from that needed to maximise<br />
social welfare or to ensure the highest sales revenue. In some cases, there is no<br />
attempt to devise a price to maximise or minimise anything, but instead prices are set<br />
that permit lower level objectives (for example, security, minimum market share) to<br />
be attained. Further, prices may be set to achieve certain objectives for the transport<br />
supplier in terms <strong>of</strong> his welfare. This is normally the case for private enterprise<br />
transport undertakings, while in other areas prices may be set to improve the welfare<br />
<strong>of</strong> consumers (as has been the case with publicly-owned transport undertakings). This<br />
distinction is important, as many undertakings consider that the employment <strong>of</strong> the<br />
<strong>pricing</strong> mechanisms to achieve their objectives is automatically for the benefit <strong>of</strong><br />
customers.<br />
It is clear that <strong>pricing</strong> objectives differ, depending on the provision <strong>of</strong> transport<br />
services (public or private) and market conditions. <strong>The</strong> following <strong>pricing</strong> objectives<br />
can be distinguished:<br />
• Economic efficiency;<br />
• Pr<strong>of</strong>it maximisation;<br />
• Cost coverage;<br />
• Environmental sustainability;<br />
• Equity (including redistributive objectives);<br />
• Objectives transcending the boundaries <strong>of</strong> transport markets, including<br />
macroeconomic objectives.<br />
<strong>The</strong> objective <strong>of</strong> economic efficiency reflects the aim to maximise social welfare; this<br />
will be discussed in Section 2.3. Pr<strong>of</strong>itability is the traditional, classical economic<br />
assumption that firms set prices as to maximise pr<strong>of</strong>its. More recent variations on this<br />
theory suggest that many undertakings adopt prices that maximise sales revenues<br />
(Baumol, 1962) when in an expansive phase, or simply price to ensure that certain<br />
satisfactory levels <strong>of</strong> pr<strong>of</strong>it or market domination are achieved (Simon, 1959). A third<br />
possible objective is that <strong>of</strong> cost coverage. Most publicly-owned firms are focused not<br />
so much on making pr<strong>of</strong>its but to stay in business and recoup their costs, <strong>of</strong>ten<br />
induced to do so for political or fiscal reasons. Protection <strong>of</strong> the environment has<br />
become an important objective for governments in recent years. Transport in general,<br />
and <strong>road</strong> transport in particular, are widely recognised as an important source <strong>of</strong><br />
pollution which threatens environmental sustainability. Pricing measures have been<br />
suggested or introduced to deal with these problems. Promoting environmental<br />
objectives may be consistent with the aim <strong>of</strong> securing welfare maximisation through<br />
economic efficiency, in particular when social welfare incorporates environmental<br />
social costs and benefits.<br />
Equity objectives and the distribution <strong>of</strong> real incomes in society are important issues<br />
for a government, reflected in the pattern <strong>of</strong> taxation and public expenditures. Whilst<br />
transfer payments, such as benefits and pensions, are a major means <strong>of</strong> redistributing<br />
income, the provision <strong>of</strong> services, such as transport at subsidised prices, is <strong>of</strong>ten<br />
considered to be equally important (United Nations, 2001). Moreover, tax policies (or<br />
other policies) aimed at regulating transport and revenue recycling, will have<br />
distributional consequences that may or may not match more generally formulated<br />
distributional targets, and may therefore motivate adjustments in currently used<br />
10
(distortive) taxes. This, in turn, implies that indirect efficiency <strong>effects</strong> may occur<br />
elsewhere in the economy.<br />
Finally, public bodies are concerned with macroeconomic policy objectives.<br />
Governments usually focus on four target variables: the level <strong>of</strong> unemployment; the<br />
rate <strong>of</strong> inflation, the balance <strong>of</strong> payments and the rate <strong>of</strong> growth <strong>of</strong> national output<br />
(see Stiglitz and Driffill, 2000). <strong>The</strong> level <strong>of</strong> investment in, and the <strong>pricing</strong> <strong>of</strong>,<br />
transport infrastructure and transport services both affects and is affected by<br />
macroeconomic policies.<br />
<strong>The</strong> kinds <strong>of</strong> objectives mentioned above are complex and are <strong>of</strong>ten not compatible<br />
(see Table 2.1 below for some examples). Although there are many transport <strong>pricing</strong><br />
objectives, economists <strong>of</strong>ten focus on the pursuance <strong>of</strong> economic efficiency in the<br />
transport sector alone. Prices that are socially optimal are seen as the first-best<br />
benchmark, which is in most cases politically desired.<br />
Nevertheless, an expanding body <strong>of</strong> literature on transport <strong>pricing</strong> is emerging that<br />
considers <strong>pricing</strong> and revenue allocation in the context <strong>of</strong> a wider – general<br />
equilibrium – framework, in which (tax)distortions elsewhere in the economy and<br />
distributional objectives, as represented in social welfare functions, are considered<br />
explicitly (e.g. Mayeres and Proost, 1997; Parry and Bento, 2002).<br />
Table 2.1: Pricing policy objectives and possible conflicts<br />
Pricing Policy Objectives Conflicts<br />
Economic efficiency vs pr<strong>of</strong>it<br />
Efficient <strong>pricing</strong> <strong>of</strong> the use <strong>of</strong> transport capacity may<br />
maximisation (or cost coverage) lead to financial losses for the infrastructure owner<br />
Pr<strong>of</strong>itability vs income distribution Pricing for pr<strong>of</strong>itability may lead to higher transport<br />
prices with adverse <strong>effects</strong> on poorer income groups<br />
Economic efficiency vs macroeconomic Macroeconomic price restraint policies may conflict<br />
policy<br />
with the need to increase transport prices during<br />
periods <strong>of</strong> congestion and excess demand<br />
Source: Adapted from United Nations, 2001<br />
So, efficient use <strong>of</strong> resources and optimising the welfare <strong>of</strong> society is clearly an<br />
important objective. It may even be the most important for governments involved in<br />
setting prices in mobility. In the following, the consequences <strong>of</strong> realising maximum<br />
welfare for price setting in general and transport <strong>pricing</strong> in particular will be<br />
discussed. We begin by considering what is <strong>of</strong>ten called a ‘first-best’ world: apart<br />
from the (transport) price to be determined, all other markets have efficient <strong>pricing</strong>,<br />
there are no other constraints on the transport prices, and no market failures to be<br />
considered. Second-best <strong>pricing</strong> issues will be discussed in Section 2.5.<br />
2.3 Economic efficiency and equity in <strong>pricing</strong><br />
2.3.1 Efficiency: marginal cost <strong>pricing</strong><br />
<strong>The</strong> concept <strong>of</strong> economic efficiency is derived from the theory <strong>of</strong> welfare economics,<br />
and is concerned with the allocation <strong>of</strong> resources in an economy. Welfare economics<br />
takes a rather wide view <strong>of</strong> <strong>pricing</strong>, looking upon price as a method <strong>of</strong> resource<br />
allocation which maximises social welfare rather than simply the welfare <strong>of</strong> the<br />
supplier (Button, 1993). According to this view, prices should equate with marginal<br />
social cost to obtain maximal social welfare. Sometimes, public provision <strong>of</strong> the good<br />
or service may also result in maximising the suppliers’ welfare. Otherwise, regulatory<br />
policies may be applied to private companies so that their <strong>pricing</strong> policy is modified<br />
11
to maximise social rather than private welfare. This may take the form <strong>of</strong> price<br />
regulation, or taxing firms so that their prices become socially optimal. This will be<br />
explained below.<br />
Deriving optimal prices needs an objective function. <strong>The</strong> most general form <strong>of</strong> this<br />
function is a social welfare function. Formally, a social welfare function<br />
1 n<br />
i<br />
W = W ( V ... V ) has as its arguments the indirect utility functions V <strong>of</strong> individuals<br />
i , i = 1...<br />
N (Varian, 1999). <strong>The</strong>se indirect utility functions indicate the maximum<br />
utility levels <strong>of</strong> the individuals. <strong>The</strong> utility levels depend on prices, income, and the<br />
magnitude <strong>of</strong> externalities such as congestion and pollution. <strong>The</strong> social welfare<br />
function incorporates welfare judgements with respect to the distribution <strong>of</strong> economic<br />
resources. <strong>The</strong>se value judgements are reflected in the policy prescriptions based on<br />
the welfare function.<br />
Several alternatives can be used as a target. <strong>The</strong>se include: the search for local<br />
improvements to welfare (rather than a global optimum); Pareto improvements;<br />
potential Pareto improvements; compensating and equivalent variation; and social<br />
surplus. This last one is the most commonly used for applied welfare analysis. Social<br />
surplus is defined to be the sum <strong>of</strong> producers’ surplus and consumers’ surplus (CS).<br />
Consumers’ surplus represents the benefit to consumers, as expressed by their<br />
willingness to pay, in excess <strong>of</strong> the cost <strong>of</strong> providing a particular quantity or level <strong>of</strong><br />
output. Producers’ surplus represents the revenue in excess <strong>of</strong> the cost <strong>of</strong> providing<br />
that level <strong>of</strong> output, i.e. pr<strong>of</strong>it. <strong>The</strong> principal advantage is that CS can be calculated<br />
using uncompensated aggregate demand curves. On the other hand, CS makes the<br />
implicit welfare judgement that welfare distributional concerns do not matter, by<br />
giving equal weight to the surplus <strong>of</strong> all individuals. Another drawback is that CS is<br />
not an exact measure <strong>of</strong> welfare when the utility function is not quasilinear.<br />
Despite these disadvantages, the considerable practical advantages <strong>of</strong> CS make it<br />
attractive. CS is most commonly used to measure welfare changes associated with the<br />
change in the price <strong>of</strong> a good. Willig (1976) has shown that CS serves as a good<br />
approximation to the compensating and equivalent variation, which are exact<br />
measures <strong>of</strong> changes in welfare, as long as any one <strong>of</strong> three conditions hold:<br />
1. the price change is not large;<br />
2. expenditure on the commodity is not a large fraction <strong>of</strong> income;<br />
3. the income elasticity <strong>of</strong> demand is not large.<br />
12
Figure 2.1: Welfare maximisation in a partial equilibrium setting<br />
Welfare theory assumes that interpersonal utility comparisons can be made, and seeks<br />
to maximise the sum <strong>of</strong> consumers’ and producers’ surpluses. This can be illustrated<br />
diagrammatically as in Figure 2.1. In the diagram, MC is the marginal costs curve or<br />
supply function. Marginal costs are the increase in total costs that occurs from<br />
producing one more unit <strong>of</strong> output or service (Gomez-Ibanez, 1999). In the figure, it<br />
is assumed that marginal costs increase when output is increased. However, this is not<br />
necessarily the case in the transportation industry, where firms may face large fixed<br />
costs (see also Section 2.4.3 on this issue). D and MR represent the demand and<br />
marginal revenue curves, respectively. A pr<strong>of</strong>it maximising firm would produce the<br />
output 0g at the price 0c, where marginal revenues equal marginal costs (a monopolist<br />
is likely to choose this price: see Section 2.4.4 below). Consumers’ surplus (assuming<br />
no income <strong>effects</strong>) is equal to the area cde, and producers’ surplus is represented by<br />
the area acek, leading to a total <strong>of</strong> adek (social surplus level).<br />
If this firm were to set its price equal to marginal costs, output would expand to 0h,<br />
and price would fall to 0b. Consumers’ surplus would be given by area bdf, and<br />
producers’ surplus by the area abf, resulting in a social surplus adf. When we compare<br />
this with the previously obtained aggregate, it appears that the triangle kef makes the<br />
difference. <strong>The</strong> sum <strong>of</strong> the two surpluses is at the maximum when price equals<br />
marginal costs. In other words, social welfare is maximised when price is equated<br />
with marginal social costs (Pareto optimum).<br />
What marginal cost <strong>pricing</strong> does, in effect, is to result in transport services being<br />
provided up to the point where the benefit for the marginal unit is equated with the<br />
costs <strong>of</strong> providing that unit (Button, 1993). <strong>The</strong> traditional theory suggests that such a<br />
condition prevails in the long term when perfect competition exists, despite the fact<br />
that each firm is trying to maximise its own pr<strong>of</strong>its, i.e. producers’ surplus. However,<br />
the ability to exercise any degree <strong>of</strong> monopoly power permits a firm to set prices<br />
above marginal costs, so that it can achieve additional pr<strong>of</strong>it at the expense <strong>of</strong> reduced<br />
output and at a cost to the consumer. This higher price, charged by the pr<strong>of</strong>it<br />
maximising monopolist, will deny some consumers the use <strong>of</strong> a service, even though<br />
13
they are prepared to pay at least the marginal social costs involved. This fear has been<br />
explicitly high in the transport market leading to widespread price regulation in many<br />
sectors by numerous governments.<br />
A ‘first-best optimum’, where all prices equate marginal social costs, will prevail as a<br />
market equilibrium under certain conditions, among which:<br />
- perfect competition;<br />
- no distortions in other market segments;<br />
- no externalities;<br />
- complete information about future prices, tastes and technology;<br />
- no subsidies or indivisibilities <strong>of</strong> demand or supply.<br />
An allocation is said to be first-best if it maximises social welfare subject to the<br />
irreducible technological constraints <strong>of</strong> production (Dreze and Stern, 1987). A firstbest<br />
optimum in transport is an allocation defined by quantities <strong>of</strong> goods, including<br />
passenger and freight transport volumes, that maximises W ( . ) , given the prevailing<br />
technology, such as vehicle fuel consumption and emissions, and the capital stock,<br />
including transport infrastructure (MC-ICAM, 2002). This definition encompasses<br />
externalities if their costs are internalised in the decisions <strong>of</strong> agents who generate<br />
them and included in their utility functions. Economic efficiency then implies that the<br />
full costs <strong>of</strong> transport services are accounted for, including social and environmental<br />
costs (no externalities). Including these social and environmental costs in the welfare<br />
function is difficult, but estimates <strong>of</strong> the most important externalities exist (see also<br />
Section 2.4.2).<br />
2.3.2 Social welfare and equity<br />
From the previous discussions it becomes clear that, in a fully competitive and<br />
distortion free economy, each price equilibrium is a Pareto optimum. This means that<br />
the market mechanism is able to guarantee efficiency for any initial distribution <strong>of</strong><br />
resources over the population. However, this distribution might not be consistent with<br />
policy objectives and the public may perceive it as unfair. This section deals with<br />
<strong>pricing</strong> and its consequences in terms <strong>of</strong> equity. Equity is important from the<br />
viewpoint <strong>of</strong> distribution <strong>of</strong> income (or other items) and for the acceptability <strong>of</strong><br />
<strong>pricing</strong> policies by the public. Various types <strong>of</strong> equity concepts are important in<br />
transport and these will now be discussed, as well as strategies to deal with<br />
distributional issues.<br />
Equity is important in the context <strong>of</strong> the acceptability <strong>of</strong> <strong>pricing</strong>. Many stakeholders<br />
raise objections about <strong>pricing</strong> measures that they perceive to be unfair. If a <strong>pricing</strong><br />
measure is unfair either to themselves in relation to other people or to people<br />
perceived to be less well <strong>of</strong>f in society, then there could be significant acceptability<br />
problems. Transport <strong>pricing</strong> can <strong>of</strong>ten be perceived to be a form <strong>of</strong> regressive<br />
taxation, allowing only those with enough money to access a resource (e.g.<br />
infrastructure) that was once considered free. Implementation strategies are therefore<br />
discussed that allow certain sections <strong>of</strong> the community to be exempted from <strong>pricing</strong>,<br />
or compensate some groups with a lump-sum transfer. <strong>The</strong> problem <strong>of</strong> who should<br />
receive extra benefits (e.g. tax exemption) and the wider problem <strong>of</strong> making sure<br />
price measures are both equitable and perceived to be so, are important issues to be<br />
included in any successful implementation strategy. Here the concept <strong>of</strong> price<br />
discrimination shows up. In public transport, for instance, it is common that different<br />
prices are charged for the same service. <strong>The</strong> fare policy <strong>of</strong> governments may benefit<br />
particular groups <strong>of</strong> society, e.g. the elderly.<br />
14
<strong>The</strong> public finance and tax literature makes a distinction between horizontal equity<br />
and vertical equity. Horizontal equity refers to the principle which states that those<br />
who are in identical or similar circumstances should pay identical or similar amounts<br />
in taxes (Stiglitz and Driffill, 2000). It requires that those with equal status-whether<br />
measured by ability or some other appropriate scale-should be treated the same. If, for<br />
instance, income were the only measure <strong>of</strong> a person then two persons with equal<br />
incomes would be treated as equals. Vertical equity states that people who are better<br />
<strong>of</strong>f should pay more taxes (Stiglitz and Driffill, 2000). This generally requires that<br />
those with less ability be treated favourably relative to those with greater ability.<br />
<strong>The</strong> role <strong>of</strong> these concepts in transport can be illustrated by describing the<br />
implementation <strong>of</strong> <strong>road</strong> <strong>pricing</strong> and the use <strong>of</strong> the revenues. Horizontal equity implies<br />
that similar users should pay identical tolls. But the question who ‘deserves’ the<br />
benefit (or revenues) according to this criterion is matter <strong>of</strong> debate. It can be defined<br />
as those who actually pay the toll, or it could also include those who change their<br />
behaviour (travel pattern), thereby incurring costs in terms <strong>of</strong> inconvenience, and<br />
providing congestion reduction benefit to the toll payers. So the difficulty is that the<br />
initial users <strong>of</strong> the <strong>road</strong> have become ‘unlike’ after the implementation <strong>of</strong> the charge,<br />
and should be compensated. <strong>The</strong> use <strong>of</strong> <strong>road</strong> charges to fund public transport is an<br />
example. Horizontal equity is further complicated by the existence <strong>of</strong> externalities<br />
from motor vehicle use, including accident risk and environmental degradation. That<br />
vehicle use imposes costs on other people itself represents horizontal inequity. If the<br />
criterion is horizontal equity and external impacts are recognised, then revenues may<br />
be used to compensate for external costs (Litman, 1996). Funding candidates may<br />
include environmental and social programmes that mitigate the harm <strong>of</strong> motor vehicle<br />
use. However, compensation for external costs may, in turn, induce inefficient<br />
behaviour by the recipients <strong>of</strong> externalities, in the sense that insufficient incentive is<br />
provided to avoid incurring the externality (Oates, 1983; Verhoef, 1994). This implies<br />
that (also) from this perspective, there may be trade-<strong>of</strong>fs between efficiency and<br />
equity in the regulation <strong>of</strong> externalities.<br />
Vertical equity is concerned with the treatment <strong>of</strong> individuals and classes that are<br />
unlike. By this principle, the distribution <strong>of</strong> costs and benefits should reflect people’s<br />
needs and abilities. Progressive tax rates, and need-based services such as<br />
programmes to help the poor, seniors, and disabled people, are examples <strong>of</strong> policies<br />
reflecting vertical equity. Vertical equity is <strong>of</strong>ten measured with respect to income.<br />
This is an imperfect metric, since people with the same income <strong>of</strong>ten have very<br />
different needs and abilities. Road <strong>pricing</strong> is usually considered vertically inequitable<br />
because charges impose a relatively larger burden on the poor. For example, a €2 per<br />
day toll might be horizontally equitable (everybody pays the same amount), but<br />
vertically inequitable because it represents a larger portion <strong>of</strong> income for a lowerincome<br />
driver than for a high-income driver. This fact is tempered by the fact that<br />
lower-income people drive less on average than those with higher incomes.<br />
Another equity issue refers to spatial or geographical equity, which is concerned with<br />
the treatment <strong>of</strong> individuals located in various regions or cities. Congestion <strong>pricing</strong><br />
could be considered as unfair from this point <strong>of</strong> view, as charges (depending on time<br />
and place) will differ among regions. Another illustration <strong>of</strong> spatial equity concerns in<br />
transport is the experience <strong>of</strong> Sydney City Council, which decided that transport<br />
availability should not depend on the geographical area in which a person lives.<br />
Transport services should be available equally to people across the Sydney<br />
metropolitan region.<br />
15
It should not be forgotten that it remains a political issue to decide what allocation <strong>of</strong><br />
<strong>road</strong> <strong>pricing</strong> revenues is equitable. Political acceptability will reflect popular<br />
perceptions and the distribution <strong>of</strong> political power. When policy makers are not<br />
satisfied with the situation, the implementation <strong>of</strong> individual specific transfers can<br />
satisfy the distributional goals. If this redistribution can be realised without distorting<br />
the market mechanism, equity and efficiency can both be reached. <strong>The</strong> proper<br />
instrument for carrying out such transfers is a lump-sum tax, i.e. a tax that does not<br />
depend on any action <strong>of</strong> the individual: there is no way that he can change the tax<br />
liability (Atkinson and Stiglitz, 1980). A lump-sum tax would be one that induces<br />
income <strong>effects</strong> alone, no substitution <strong>effects</strong>. If such lump-sum transfers were possible<br />
there would be no reason to worry about distributional concerns in the transportation<br />
<strong>pricing</strong> policy domain. Unfortunately, in practice, it is almost impossible to effect<br />
transfers without distorting the market mechanism.<br />
It appeared from the previous discussion that both the consumers’ surplus and the<br />
social surplus weight monetary gains and costs equally for all individuals. <strong>The</strong> fact<br />
that these objective functions are so <strong>of</strong>ten used in transportation policy analysis does<br />
not imply that researchers deliberately want to ignore distributional issues. <strong>The</strong> main<br />
reason for using social surplus as the welfare measure is that it is easier to use, mainly<br />
because it requires only information at the market level.<br />
Sometimes the term ‘first-best’ optimum is reserved for situations in which lump-sum<br />
taxes can be used to address distributional issues. In such circumstances, the marginal<br />
social value <strong>of</strong> the public good is, in the optimum, equal to the welfare weight <strong>of</strong> each<br />
traveller. In such a first-best optimum, prices are equal to marginal costs. This does<br />
not mean that there is no reason for government intervention because <strong>of</strong> the existence<br />
<strong>of</strong> externalities. Charges including the marginal external costs have to be introduced<br />
in order to guarantee that the travellers pay the full marginal cost associated with their<br />
actions.<br />
This links to the ‘user pays’ concept, which states that all users <strong>of</strong> transport<br />
infrastructure should pay for the costs, including environmental and other external<br />
impacts. Protection <strong>of</strong> the environment has become an important objective for<br />
governments in recent years, and the ‘polluter pays’ principle is <strong>of</strong>ten proposed to<br />
reduce and control environmental pollution in a fair way. Marginal cost-based <strong>pricing</strong><br />
can be regarded as being fully consistent with the user pays principle under first-best<br />
circumstances. However, all dimensions <strong>of</strong> travel behaviour must be priced at<br />
marginal social cost, and distortions elsewhere in the economy must be absent in a<br />
first-best optimum.<br />
Under this interpretation, the ‘user pays principle’ implies that each user fully pays for<br />
the cost he imposes. But the principle can also be interpreted to mean that users<br />
together should cover the costs they collectively impose, implying average cost<br />
<strong>pricing</strong>, rather than marginal cost <strong>pricing</strong>. <strong>The</strong>se two concepts are mutually<br />
inconsistent, unless marginal cost <strong>pricing</strong> just suffices to cover costs.<br />
2.4 Deviations from first-best <strong>pricing</strong><br />
2.4.1 Deviations from marginal cost <strong>pricing</strong><br />
<strong>The</strong> previous section has shown us that equality <strong>of</strong> prices and marginal costs leads to<br />
an efficient use <strong>of</strong> resources in an otherwise ideal world. But the practical world is not<br />
ideal. Actual (market) prices may deviate from marginal costs for a number <strong>of</strong><br />
reasons. Moreover, given the existence <strong>of</strong> such distortions, it is usually not optimal to<br />
16
set the other prices exactly equal to marginal costs. Most <strong>of</strong> these reasons result from<br />
market failures. <strong>The</strong> following reasons can be mentioned:<br />
• Imperfect competition (e.g. monopoly);<br />
• Increasing returns to scale (indivisibilities <strong>of</strong> supply: fixed capacity);<br />
• Imperfect information;<br />
• Indivisibilites <strong>of</strong> demand: peak load;<br />
• Externalities;<br />
• Difficulties with implementing marginal cost <strong>pricing</strong> (price instrument);<br />
• Policies in favour <strong>of</strong> equity.<br />
Imperfect competition implies that individual suppliers do not face a completely<br />
elastic demand curve. Pr<strong>of</strong>it maximisation then implies that a mark-up will be added<br />
to marginal costs. Only under conditions <strong>of</strong> perfect competition will market prices be<br />
equal to marginal costs.<br />
If prices are equal to marginal costs, industries with increasing returns to scale<br />
(decreasing cost industries) will suffer losses, and are therefore unable to exist. In the<br />
absence <strong>of</strong> subsidies, it is impossible to have prices equal to marginal costs in such<br />
industries.<br />
Imperfect information can reduce market efficiency: consumers need to have accurate<br />
information about their choices. For example, a rideshare programme could fail to<br />
attract users because there is little demand for the service, or it could be that potential<br />
users do not know about it or have an inaccurate impression <strong>of</strong> it.<br />
Many parts <strong>of</strong> the transport industry experience a systematic pattern <strong>of</strong> demand<br />
fluctuations within a given period, with the pattern repeating itself from period to<br />
period. <strong>The</strong> duration <strong>of</strong> the fluctuations is too short to permit capacity to be varied to<br />
match them, while it is too expensive or physically impossible to store spare capacity<br />
to meet the requirements <strong>of</strong> the peak demand period. If sufficient capacity is provided<br />
to meet the peaks, then in the rest <strong>of</strong> the time varying amounts <strong>of</strong> it will be lying idle.<br />
On the other hand, the demand at each time will depend on the price that prevails at<br />
that time, as well as the prices set for all other times. In general, therefore, <strong>pricing</strong><br />
policy could be used to flatten the peaks and raise the lows, so as to get a more even<br />
rate <strong>of</strong> capacity utilisation and a lower level <strong>of</strong> required capacity. <strong>The</strong> indivisibilities<br />
<strong>of</strong> demand is then that <strong>of</strong> determining an overall capacity level and optimal values for<br />
a sequence <strong>of</strong> prices over the demand cycle. <strong>The</strong> problem may be regarded as one <strong>of</strong><br />
applying marginal cost <strong>pricing</strong> to a system with fluctuating demand.<br />
In the presence <strong>of</strong> external <strong>effects</strong>, market prices will (even under conditions <strong>of</strong><br />
perfect competition) not be equal to marginal costs. In order to make prices equal to<br />
marginal costs, they have to be adjusted appropriately by internalising the external<br />
<strong>effects</strong>. As we will see later, this requires tolls or subsidies, which are not always easy<br />
to implement.<br />
Difficulties with implementing marginal cost <strong>pricing</strong> may arise when it is impossible<br />
to impose perfect competition or equality between prices and marginal costs by means<br />
<strong>of</strong> a governmental decree. Even if this were possible, it is doubtful whether it would<br />
be desirable. In modern economies, many markets are characterised by product<br />
differentiation which implies that producers can, to some extent, create their own<br />
markets and have some market power. Moreover, product differentiation is <strong>of</strong>ten to<br />
the benefit <strong>of</strong> the consumer. <strong>The</strong> development <strong>of</strong> new versions <strong>of</strong> a differentiated<br />
product usually requires large investments that are not reflected in the marginal costs<br />
<strong>of</strong> its production. Another kind <strong>of</strong> difficulty is related to the transaction costs incurred<br />
in setting prices equal to marginal costs. <strong>The</strong> administrative cost <strong>of</strong> collecting<br />
marginal cost fees, most <strong>of</strong> which are highly variable, can be rather high. This places<br />
17
a limit on the precision with which rate structures can reflect specific costs, although<br />
new electronic <strong>pricing</strong> systems reduce transaction costs.<br />
When governments are unable to impose marginal cost <strong>pricing</strong> in other markets than<br />
transport, marginal cost <strong>pricing</strong> in transport itself would typically no longer be<br />
optimal. A straightforward example concerns labour taxes that would distort the<br />
labour market. When these exist, it is to be expected that optimal congestion charges<br />
for <strong>road</strong> transport – mainly affecting commuters and hence affecting labour supply<br />
decisions – would not only reflect marginal external congestion costs but in addition<br />
would also reflect the current distortions on the labour market.<br />
Social policy is not only concerned with efficiency, but also with equity. In the<br />
absence <strong>of</strong> instruments that enable the government to redistribute resources without<br />
distortions, this may require prices that deviate from marginal costs, for instance when<br />
luxury goods are taxed heavily (see also Section 2.3.2).<br />
<strong>The</strong> implication <strong>of</strong> this list <strong>of</strong> reasons is that it should not be expected that in actual<br />
economies all prices will be (or can even be) equal to marginal costs. <strong>The</strong> transport<br />
market is characterised by several market imperfections which makes it very unlikely<br />
that the market, without regulation, will set transport prices equal to marginal social<br />
costs and, therefore, social welfare is not optimised. In the following, three specific<br />
market failures that play an import role in the transport market will be discussed;<br />
namely, externalities, cost-related issues (i.e. economies <strong>of</strong> scale, indivisibilities and<br />
common costs), and monopolies. In addition, some remarks will be made on the<br />
question <strong>of</strong> whether it is possible to correct for these market failures and in which<br />
way.<br />
2.4.2 Externalities<br />
<strong>The</strong> essence <strong>of</strong> an externality is that it involves (i) interdependence between two or<br />
more economic agents, and (ii) failure to price that interdependence. Formally,<br />
externalities exist when the activities <strong>of</strong> one group (either consumers or producers)<br />
unintentionally affect the welfare <strong>of</strong> another group, without any payment or<br />
compensation being made (Button, 1993). Most attention in transport is paid to the<br />
negative (costs) externalities, although also positive externalities (benefits) have been<br />
identified (for a discussion on this latter issue, see Verhoef (1996)). It is quite clear<br />
from everyday experience, that there are costs associated with transport that are not<br />
directly borne by those generating them. Transport generates many negative<br />
externalities, including noise, accidents, pollution, and congestion. Road travellers,<br />
for example, impose noise and vibration costs on those living adjacent to highways. In<br />
the introduction we noticed that these costs may be significant. Total congestion costs<br />
may be small compared with other externalities, but marginal congestion costs can be<br />
substantial in comparison to other marginal external costs (e.g. marginal external cost<br />
estimates from a Dutch study indicate that the external congestion costs exceed the<br />
other external cost categories by several orders <strong>of</strong> magnitude (CE, 1999)).<br />
A result <strong>of</strong> the clear presence <strong>of</strong> externalities in transport is that the early neo-classical<br />
writers studying market failures frequently illustrated their viewpoints using transport<br />
examples. Dupuit was the one <strong>of</strong> the first in 1844 to illustrate efficient <strong>pricing</strong> <strong>of</strong><br />
public goods (Button and Verhoef, 1998). Coase (1960) considered the absence <strong>of</strong><br />
property rights in relation to the existence <strong>of</strong> externalities for a railway. Another wellknown<br />
example is that <strong>of</strong> a congested <strong>road</strong>, including optimal congestion charges<br />
(Pigou in 1920). <strong>The</strong>y all showed that the market mechanism fails to allocate<br />
resources efficiently.<br />
18
It should be emphasised that optimality does not imply the total elimination <strong>of</strong><br />
congestion and pollution, but rather the achievement <strong>of</strong> optimal levels <strong>of</strong> external<br />
costs. Ideally, externalities should be contained to the point where the costs <strong>of</strong> further<br />
reductions exceed the marginal social benefits. Let us analyse the problem <strong>of</strong><br />
externalities by examining <strong>road</strong> traffic congestion together with the use <strong>of</strong> <strong>pricing</strong><br />
methods. Similar analyses will also hold for other transport modes and other<br />
externalities, but <strong>road</strong> traffic congestion is, in a marginal sense, a very important<br />
externality, and <strong>of</strong>fers a useful basis for analysis.<br />
Congestion<br />
<strong>The</strong> demand for transport is not constant over time. In large cities there are regular<br />
peaks in commuter travel, while on holiday routes, both within the country and to<br />
overseas destinations, there are seasonal peaks in demand. Transport infrastructure,<br />
although flexible in the long run, has a finite capacity at any given period <strong>of</strong> time.<br />
When users <strong>of</strong> a particular facility begin to interfere with other users because the<br />
capacity <strong>of</strong> the infrastructure is limited, then congestion externalities arise. It should<br />
be added that not only does congestion impose costs on the <strong>road</strong> user in terms <strong>of</strong><br />
wasted time and fuel (also referred to as the ‘pure congestion cost’) but the stopping<br />
and starting it entails can also worsen atmospheric and other forms <strong>of</strong> pollution. This<br />
latter problem is particularly acute with local forms <strong>of</strong> pollution because <strong>road</strong> traffic<br />
congestion tends to be focused in urban areas.<br />
One idea for optimising the level <strong>of</strong> congestion is to use the price mechanism to make<br />
<strong>road</strong> users more fully aware <strong>of</strong> how they impede on another. <strong>The</strong> idea that motorists<br />
should pay for the additional congestion they create, when entering a congested <strong>road</strong><br />
was first suggested by Pigou (Pigou, 1920). Ideally they should pay the actual <strong>road</strong><br />
users affected, but this is impossible in practice, so the idea is that an organisation<br />
(e.g. the relevant <strong>road</strong> authority) should be made responsible for collecting the<br />
charges.<br />
<strong>The</strong> economic costs <strong>of</strong> <strong>road</strong> congestion can be calculated using the engineering<br />
concept <strong>of</strong> the speed-flow relationship. If we take a straight one-way street and<br />
consider traffic flows along it over a period <strong>of</strong> time at different speed levels, then the<br />
relationship between speed and flow would appear as in Figure 2.2. It shows that, as<br />
vehicle numbers entering a <strong>road</strong> increase, average speed does not at first significantly<br />
change as does the flow, measured by vehicles per hour. At low volumes <strong>of</strong> traffic,<br />
when vehicle impedance is zero, high speeds are possible, constrained only by the<br />
capability <strong>of</strong> the vehicle and legal speed limits, but, as the number <strong>of</strong> vehicles trying<br />
to enter the <strong>road</strong> increases (so they interact with existing traffic), drivers will slow one<br />
another down. Up to a point, flow will continue to rise because the effect <strong>of</strong> additional<br />
vehicle numbers outweighs the reduction in average speed. <strong>The</strong> maximum flow is<br />
reached when increased traffic volume ceases to <strong>of</strong>fset the reduced speed (the <strong>road</strong>’s<br />
engineering capacity). <strong>The</strong> absence <strong>of</strong> information causes motorists to continue to<br />
enter the <strong>road</strong> beyond this volume, thus leading to further drops in speed and resulting<br />
in the speed-flow relationship turning back on itself. <strong>The</strong>se levels are known as<br />
‘forced flows’, while economists <strong>of</strong>ten use the term ‘hypercongestion’.<br />
19
Figure 2.2: <strong>The</strong> speed-flow relationship<br />
Source: Button, 1993.<br />
Speed-flow curves can be used to measure the economic costs <strong>of</strong> congestion.<br />
Generalised travel costs include the motoring costs plus the travel time cost for a<br />
certain journey. B<strong>road</strong>ly, faster travel in urban areas means cheaper travel in terms <strong>of</strong><br />
generalised cost – vehicles are used more effectively and travel times are reduced.<br />
<strong>The</strong> average generalised costs <strong>of</strong> a trip will increase as flow increases up to the<br />
maximum flow rate. It will continue to rise as hypercongestion sets in and produces a<br />
reduction in the rate <strong>of</strong> vehicle flow.<br />
Pigou’s economic analysis <strong>of</strong> <strong>road</strong> <strong>pricing</strong> and costs is explained as follows. We use a<br />
simplified framework and are not concerned with matters such as pollution and safety,<br />
and suppose a simple <strong>road</strong> without junctions. In these circumstances, <strong>road</strong> users are<br />
identical, apart from their marginal willingness to pay for a trip, represented by the<br />
demand curve D=MPB=MSB in Figure 2.3 (marginal private and social benefits,<br />
respectively). Individual users entering the <strong>road</strong> will only consider the costs they<br />
personally bear (marginal private costs, MPC), but not the external congestion costs<br />
(marginal social cost, MSC) they impose on other <strong>road</strong> users. <strong>The</strong> difference between<br />
marginal social costs and marginal private costs is caused by congestion. Individual<br />
motorists will only consider the average costs experienced by <strong>road</strong> users and take no<br />
account <strong>of</strong> the impact <strong>of</strong> their trip on other vehicles. Consequently, the marginal<br />
private cost is equal to the average social cost (ASC).<br />
20
Figure 2.3: <strong>The</strong> economics <strong>of</strong> <strong>road</strong> <strong>pricing</strong><br />
Source: Button and Verhoef, 1998.<br />
<strong>The</strong> fact that potential trip makers tend to consider only the private costs <strong>of</strong> any trip<br />
and ignore the external or social costs means that effectively ASC is the decision-<br />
0<br />
making curve for private motorists. This means that <strong>road</strong> utilisation will be N , at<br />
which point, marginal private benefits equals marginal private costs (the free market<br />
equilibrium outcome). This is excessive from a social point <strong>of</strong> view, since at traffic<br />
flow 0<br />
N , the marginal social costs (including congestion costs) is (much) higher. <strong>The</strong><br />
*<br />
socially-optimal level <strong>of</strong> traffic flow is N . To internalise the externality or external<br />
costs <strong>of</strong> congestion, it would be necessary to impose a congestion tax. <strong>The</strong> charge that<br />
*<br />
accomplishes this optimum is the Pigouvian charge r . This is equal to the difference<br />
between the marginal social costs and marginal private costs at the optimum, also<br />
known as the marginal external congestion costs. <strong>The</strong> shaded area reflects the welfare<br />
gain realised through introducing this charge. <strong>The</strong> Pigouvian tax is a charge imposed<br />
on the traveller or car driver, equal to the amount <strong>of</strong> the marginal external cost <strong>of</strong> the<br />
transport activity concerned, ensuring a Pareto-efficient allocation <strong>of</strong> resources.<br />
<strong>The</strong>oretically, this policy strategy is preferable in a market system, but its<br />
implementation may encounter great difficulties as a result <strong>of</strong> high transaction costs<br />
caused by the ‘large number’ case and the circumnavigating behaviour <strong>of</strong> travellers.<br />
Many parts <strong>of</strong> the transport industry experience a systematic pattern <strong>of</strong> demand<br />
fluctuations leading to congestion within a given time period, with the pattern<br />
repeating itself from period to period. <strong>The</strong> duration <strong>of</strong> the fluctuations is too short to<br />
permit capacity to be varied to match them, while it is too expensive to store spare<br />
capacity to meet the requirements <strong>of</strong> the peak demand period. This has led Vickrey<br />
(1969) to assume that traffic congestion takes the form <strong>of</strong> cars queuing behind a<br />
bottleneck. This model endogenised individuals’ departure times which generated a<br />
21
wealth <strong>of</strong> insights into urban rush-hour auto congestion (see for instance Arnott et al.,<br />
1998).<br />
2.4.3 Economies <strong>of</strong> scale, indivisibilities and common costs<br />
<strong>The</strong> presence <strong>of</strong> externalities, discussed above, is one <strong>of</strong> several peculiar<br />
characteristics <strong>of</strong> transportation which causes the failure to apply marginal cost<br />
<strong>pricing</strong>. Transportation facilities and services <strong>of</strong>ten require capital intensive<br />
infrastructure, and vehicle needs leading to certain industry specific characteristics<br />
may cause particular <strong>pricing</strong> problems. Specifically, the large fixed investment costs<br />
and the joint use <strong>of</strong> the facilities and services may result in necessary deviations from<br />
marginal cost <strong>pricing</strong>. We now discuss the presence <strong>of</strong> economies <strong>of</strong> scale in<br />
transport, the implications <strong>of</strong> indivisibilities, and the existence <strong>of</strong> common or joint<br />
costs.<br />
Economies <strong>of</strong> scale<br />
A characteristic <strong>of</strong> physical transport infrastructure is the considerable capital costs,<br />
which are <strong>of</strong>ten higher than the associated operating and maintenance costs for the<br />
infrastructure provider (especially on longer distance infrastructure), and can be very<br />
long lasting (see also Nijkamp and Rienstra, 1995). Once committed, infrastructure<br />
investment usually has few alternative uses and is normally regarded as sunk cost.<br />
This fixed component, such as <strong>road</strong>s, railways, bridges and runways normally give<br />
rise to significant economies <strong>of</strong> scale (marginal costs are below average costs). Once a<br />
rail track is laid, the marginal costs <strong>of</strong> using it falls until a certain capacity level is<br />
reached. Firms with large sunk costs and facing economies <strong>of</strong> scale have marginal<br />
costs that are lower than average costs, so that <strong>pricing</strong> at marginal costs does not<br />
generate enough revenue for the firm to be financially self-sufficient. In addition,<br />
transport vehicles, such as railcars and buses are also subject to scale economies in<br />
operation, though they are generally not as expensive as the infrastructure.<br />
In the long run, however, congestion externalities may show up, resulting in an<br />
increase in marginal costs. A toll should be installed which optimally should equal the<br />
external costs (Pigouvian charge). A major contribution <strong>of</strong> Mohring and Harwitz<br />
(1962) was to show that the revenues from such a congestion toll will just cover the<br />
costs <strong>of</strong> the facility provider so long as there are no economies or diseconomies <strong>of</strong><br />
scale in facility capacity, and the facility provider is investing optimally. This holds<br />
under certain conditions and concerns optimal highway investment in a first-best<br />
world (Lindsey and Verhoef, 2000).<br />
Budgetary problems are especially common in transportation because transport<br />
services <strong>of</strong>ten exhibit economies <strong>of</strong> scale so that marginal cost <strong>pricing</strong> does not<br />
generate enough revenues to cover costs. Ramsey <strong>pricing</strong> is <strong>of</strong>ten suggested to be a<br />
solution in order not to deviate too much from efficient <strong>pricing</strong>. Ramsey <strong>pricing</strong><br />
minimises the distorting effect <strong>of</strong> charging more than marginal cost by increasing<br />
prices more in those markets where demand is least sensitive to price (Nash, 2001).<br />
<strong>The</strong> basic idea is to charge those customers with the least price elastic demand the<br />
largest mark-ups necessary to cover marginal cost and thereby minimise the reduction<br />
in consumption that occurs from charging prices that are higher than marginal cost.<br />
Commuters, for instance, will be charged more than shoppers, and business travellers<br />
more than leisure passengers. It should be noted, however, that this form <strong>of</strong> price<br />
discrimination has itself <strong>of</strong>ten been regarded as unfair as it exploits market power to<br />
raise the price for the captive user. If the view <strong>of</strong> equity is that all users should<br />
22
contribute to the cost <strong>of</strong> that facility in proportion to their use <strong>of</strong> it, then some form <strong>of</strong><br />
average-cost <strong>pricing</strong> is the only admissible <strong>pricing</strong> policy.<br />
Indivisibilities<br />
Problems arise when applying marginal cost <strong>pricing</strong> to transport infrastructure and<br />
services, because capacity can only be increased in relatively large indivisible units.<br />
<strong>The</strong>re are many examples to be found in the transport sector: if the capacity <strong>of</strong> a<br />
railway coach is 60 passengers, then to carry 61 persons requires another coach.<br />
Existing airports at full capacity are another example: expansion requires a new<br />
runway and terminal facilities. It is <strong>of</strong>ten extremely costly to make (small) additions<br />
to physical capacity. <strong>The</strong> issue is one <strong>of</strong> optimal investment timing, since, under<br />
conditions <strong>of</strong> growing demand, there will come a point at which an increase in<br />
capacity will be worthwhile. This brings us to the distinction between short-run and<br />
long-run marginal costs.<br />
In specifying the marginal cost-<strong>pricing</strong> rule, it is important to understand the<br />
distinction between short-run and long-run marginal costs. <strong>The</strong> distinction arises<br />
because different factors <strong>of</strong> production, used in providing transport services, have<br />
differing degrees <strong>of</strong> fixedness or variability over various business planning horizons.<br />
Airports, for example, facing increased demand may be able to increase throughput in<br />
the short term, whereas in the longer term the operator is forced to invest in new<br />
infrastructure (e.g. a terminal or runway). In the very short term, all inputs and costs<br />
are essentially fixed, and, conversely, in the long run, all inputs and costs are<br />
ultimately variable (Braeutigam, 1999). Over a planning horizon, it is important to<br />
identify those costs that can be varied (variable costs) and those which cannot be<br />
varied (fixed costs). Prices should normally be set in relation to short-run marginal<br />
costs, which may lie above, below, or be equal to long-run marginal costs.<br />
What this means for optimal <strong>pricing</strong> and optimal investment can be illustrated with an<br />
airport example (investment in a terminal). <strong>The</strong> initial marginal costs <strong>of</strong> using a<br />
terminal will be very low, so the price is low when set according to short-run marginal<br />
costs (excluding investment costs). <strong>The</strong>re is no need for new investment as there is<br />
spare capacity. If the demand function shifts outwards over time, the marginal costs<br />
will (sharply) increase due to congestion <strong>effects</strong>. A new terminal might be needed<br />
now. When the price in the peak period consists <strong>of</strong> operational costs (including that <strong>of</strong><br />
additional investment), the corresponding demand will give a clear indication <strong>of</strong> the<br />
necessity <strong>of</strong> the investment. Continuation <strong>of</strong> excess demand with these LRMC<br />
charges justifies investment in a new terminal. In the long-run optimum,<br />
SRMC=LRMC may apply (Mohring-Harwitz type <strong>of</strong> equilibrium: see economies <strong>of</strong><br />
scale).<br />
This analysis implies that marginal cost <strong>pricing</strong> could produce market fluctuations in<br />
price before and after capacity adjustments are made. Further, whether or not the<br />
airport makes a pr<strong>of</strong>it depends on whether the price lies above or below the long-run<br />
marginal cost curve, LRMC. At any given point in time, the terminal might be pr<strong>of</strong>it<br />
or loss making; however, over its life, the net present value <strong>of</strong> the investment in<br />
additional capacity should be positive if it is to be worthwhile. Such fluctuations in<br />
prices and pr<strong>of</strong>its are likely to be undesirable, but unavoidable, because any other<br />
<strong>pricing</strong> pattern will produce welfare losses. If the price floor is raised above marginal<br />
running costs during times <strong>of</strong> excess capacity, then underutilisation will occur. If a<br />
price ceiling is set, during periods <strong>of</strong> excess demand, non-price rationing methods will<br />
be required. Similarly, premature investment in capacity is likely to represent a waste<br />
<strong>of</strong> capital resources. It will, however, keep marginal cost-based prices low.<br />
23
Common and joint costs<br />
A related set <strong>of</strong> <strong>pricing</strong> complications occurs because transportation firms <strong>of</strong>ten use<br />
the same facilities, equipment and labour to produce different services: they are multiproduct<br />
firms. This leads to the conceptual and practical problems <strong>of</strong> determining<br />
transport prices associated with fixed and variable costs and choosing the relevant<br />
time period because many costs may also be ‘joint’ or ‘common’ to a number <strong>of</strong><br />
users. Pricing in these circumstances may be difficult, as it is not always clear how to<br />
allocate costs between products. This may make it difficult to determine marginal<br />
costs. Joint costs exist when the provision <strong>of</strong> a specific service necessarily entails the<br />
output <strong>of</strong> some other service or product at little extra expense (Gomez-Ibanez, 1999).<br />
Jointness is a technical feature and exists at all points in time, that is, both before and<br />
after investment or capacity decisions are made. <strong>The</strong> classic example <strong>of</strong> jointness is<br />
the return trip, where the supply <strong>of</strong> a transport service in one direction normally<br />
implies the provision <strong>of</strong> a return service (Button, 1993).<br />
Common costs are similar to joint costs, in that they are incurred as a result <strong>of</strong><br />
providing services to a wide range <strong>of</strong> users, but differ, in that the resources used to<br />
provide one service do not unavoidably result in the production <strong>of</strong> other services<br />
(United Nations, 2001). An airport, for example, faces considerable common costs. A<br />
terminal is used by different types <strong>of</strong> users: terminal retailers and air passengers. <strong>The</strong><br />
same holds for runways, these are used by different types <strong>of</strong> planes. <strong>The</strong> allocation <strong>of</strong><br />
these common costs among users poses particular practical problems, which<br />
consequently also leads to <strong>pricing</strong> problems.<br />
2.4.4 Monopoly<br />
Firms facing the previous mentioned aspects such as high fixed costs and economies<br />
<strong>of</strong> scale, together with significant indivisibilities in the provision <strong>of</strong> capacity, have<br />
limited competition. <strong>The</strong>se circumstances, <strong>of</strong>ten the case in the transport industry<br />
(particularly in terms <strong>of</strong> infrastructure), give rise to monopolies. Under these<br />
conditions, and a fairly small transport market relative to the optimal size, a good or a<br />
service can only be produced at least cost if only one firm is engaged in its production<br />
and a natural monopoly is likely to emerge. Public transport companies are <strong>of</strong>ten<br />
claimed to be a natural monopoly, although there may be little evidence <strong>of</strong> scale<br />
economies (Gomez-Ibanez, 1999). Constraints on competition are intended to avoid<br />
certain problems, but this tends to increase costs and does not provide an incentive for<br />
the development <strong>of</strong> alternatives, such as demand response transport and premium<br />
service commuter buses. A more competitive transport market may therefore result in<br />
benefits to consumers.<br />
Imperfect competition creates a major distortion in the market for transport services.<br />
<strong>The</strong>re is every risk that the monopolist will not provide optimal transport prices and,<br />
an unregulated market will therefore not lead to the maximisation <strong>of</strong> social welfare. In<br />
such circumstances, the government may decide to intervene either by directly<br />
providing the transport services or by regulating prices.<br />
Hence, it is unlikely that prices equate marginal social costs under conditions <strong>of</strong><br />
monopoly. Figure 2.4 illustrates how price and output would be determined under<br />
conditions <strong>of</strong> monopoly, and under competition within an industry subject to<br />
declining costs (e.g. the transit industry). <strong>The</strong> monopolist aiming to maximise pr<strong>of</strong>it<br />
will expand output up to the point at which marginal revenue is equal to marginal cost<br />
– point a in Figure 2.4. <strong>The</strong> corresponding level <strong>of</strong> output, QM, leads the monopolist<br />
to charge a price <strong>of</strong> PM and supply the market at an average cost <strong>of</strong> CM. <strong>The</strong> pr<strong>of</strong>it<br />
24
equals QM (PM- CM). Under perfect competition, demand and supply determine the<br />
price. <strong>The</strong> aggregate marginal cost curves are assumed to represent the industry<br />
supply curve which results in an equilibrium at point b in Figure 2.4 with output QC.<br />
Costs are higher than revenues and, at this point, the firms in the industry will make a<br />
financial loss. This is <strong>of</strong>ten the case in transport due to economies <strong>of</strong> scale.<br />
<strong>The</strong> existence <strong>of</strong> declining average costs in the transport industry is an important<br />
reason for the emergence <strong>of</strong> natural monopolies in many sectors. <strong>The</strong> potential<br />
monopoly power and the possibility <strong>of</strong> abuse <strong>of</strong> this position may be reflected in high<br />
prices (or price discrimination) and has <strong>of</strong>ten led to government price regulation and<br />
public ownership. This is, for instance, the case in the airport industry. Governments<br />
are afraid <strong>of</strong> private airports setting inefficiently high prices. <strong>The</strong>refore airports are<br />
<strong>of</strong>ten in public hands, or privatised airports are (price-)regulated. When governments<br />
take over, and prices are set equal to marginal costs, it is obvious that a subsidy is<br />
needed. It may also be possible to look for <strong>pricing</strong> policy options to assist cost<br />
recovery while at the same time minimising the resulting allocative efficiency losses.<br />
Two-part tariffs (consisting <strong>of</strong> a fixed charge per consumer and a variable charge per<br />
unit consumed) and Ramsey <strong>pricing</strong> have been suggested in these cases.<br />
Figure 2.4: Price determination under monopoly vs perfect competition<br />
2.5 Second-best <strong>pricing</strong> issues<br />
From the previous discussion, it became clear that marginal cost <strong>pricing</strong> maximises<br />
social welfare. <strong>The</strong> standard exposition uses the well-known market diagram that<br />
identifies the free-market equilibrium at the intersection <strong>of</strong> the marginal benefit<br />
(demand) and the marginal private cost function (see Figure 2.1), and the optimum at<br />
the intersection <strong>of</strong> the marginal benefit and the marginal social cost function. When<br />
the existence <strong>of</strong> marginal external costs drives a wedge between marginal private and<br />
marginal social costs, the free market equilibrium and the optimum will not coincide.<br />
A (‘Pigouvian’) tax could then be used, equal to marginal external costs, which<br />
ensures that the consumers are confronted with all the costs <strong>of</strong> their decision. <strong>The</strong>se<br />
<strong>pricing</strong> principles and a Pigouvian tax only hold in a theoretical first best world. This<br />
25
first-best <strong>pricing</strong> is increasingly recognised as being <strong>of</strong> limited practical relevance, but<br />
it might serve as a useful theoretical benchmark.<br />
We have seen that various market circumstances and characteristics hinder the<br />
transport market in setting prices based on marginal costs. In addition, various<br />
constraints and barriers may exist that prevent a regulator from determining prices<br />
that it ideally would like. Verhoef (2002) mentions the following important<br />
constraints:<br />
• Technological and practical constraints: first-best <strong>pricing</strong> requires charges that<br />
vary continuously over time, place, route chosen, type <strong>of</strong> vehicle, driving style,<br />
etc, which might be too sophisticated and not understood by drivers or impossible<br />
to implement under available charging technologies;<br />
• Acceptability constraints: there may be too much resistance and uncertainty (e.g.<br />
about the objective and necessity <strong>of</strong> the measure) that it may seem preferable to<br />
start with a few small-scale demonstration projects;<br />
• Institutional constraints: one example is where local or regional governments<br />
cannot affect some transport charges that are set by a higher level government;<br />
• Legal constraints: ideal prices might not be possible on the basis <strong>of</strong> legal<br />
arguments (e.g. when taxes should be predictable);<br />
• Financial constraints: for instance, the prior definition <strong>of</strong> minimum or maximum<br />
tax revenue sums to be collected;<br />
• Market interaction constraints: transport taxes will have many consequences for<br />
other markets, among the most important is the labour market;<br />
• Political constraints: charges may become a political issue much more than an<br />
economic question.<br />
This has led to some discussion on the practical relevance <strong>of</strong> marginal cost <strong>pricing</strong>.<br />
Rothengatter (2003) argues that marginal cost <strong>pricing</strong> is no longer optimal when<br />
aspects such as acceptability and institutional consequences are introduced into the<br />
analysis, and a real-world <strong>pricing</strong> system can therefore not be based on abstract<br />
economic theory. Nash (2003) replies that indeed difficulties and uncertainties remain<br />
(which should be carefully considered), but that there is no need for a totally different<br />
theoretical approach, marginal social costs are the correct starting point in the<br />
development <strong>of</strong> any efficient <strong>pricing</strong> policy.<br />
Given these constraints and discussions, economic research has focused on setting<br />
prices that are available optimally, under the constraints applying: second-best prices.<br />
Examples <strong>of</strong> second-best tolling include the use <strong>of</strong> toll cordons around cities instead<br />
<strong>of</strong> tolling each <strong>road</strong> in the network, and the use <strong>of</strong> step tolls instead <strong>of</strong> smoothly timevarying<br />
tolls. It is safe to state that second-best <strong>pricing</strong> will be the rule for the<br />
implementation <strong>of</strong> marginal cost-based <strong>pricing</strong> in reality.<br />
2.5.1 Second-best <strong>pricing</strong>: an overview <strong>of</strong> some results<br />
It is clear that some aspects <strong>of</strong> the transport sector do not correspond to first-best<br />
conditions. We then enter the world <strong>of</strong> second-best, where the imperfectness <strong>of</strong> one<br />
variable has consequences for the optimal value <strong>of</strong> others. <strong>The</strong> conclusions that<br />
emerge from second-best analyses are dependent on the details <strong>of</strong> the situation under<br />
consideration, and it is hard to draw general conclusions. A substantial technical<br />
literature has emerged over the last decade that addresses various types <strong>of</strong> second-best<br />
<strong>pricing</strong> schemes (i.e. what do the tax rules look like, how do they deviate from<br />
Pigouvian charges), and analyses the relative efficiency <strong>of</strong> these schemes. Attention<br />
has turned in the recent literature to more realistic types <strong>of</strong> ‘second-best’ <strong>pricing</strong>, in<br />
26
which various costs or constraints deter or prevent the setting <strong>of</strong> first-best tolls. Much<br />
<strong>of</strong> this literature is reviewed in Lindsey and Verhoef (2001), whereas MC-ICAM<br />
(2002) gives insight into the kind <strong>of</strong> analysis. Drawing heavily on both these studies,<br />
three <strong>of</strong> the most relevant second-best problems that have been studied in<br />
transportation (congestion) <strong>pricing</strong> will now be presented.<br />
Networks<br />
First-best <strong>pricing</strong> in a network assumes that each link <strong>of</strong> a <strong>road</strong> network is efficiently<br />
priced. This is <strong>of</strong>ten impossible due to excessive costs, the requirement <strong>of</strong> toll-free<br />
alternatives by governments, and the likeliness <strong>of</strong> incremental implementation rather<br />
than at once. <strong>The</strong> question under study is then how second-best tolls should be set on<br />
toll <strong>road</strong>s, given unpriced congestion on untolled <strong>road</strong>s elsewhere in the network.<br />
This network problem is one <strong>of</strong> the most widely studied where the simplest version<br />
concerns a simple network in which there are two links connecting the same origin<br />
and destination. Verhoef et al. (1996) demonstrate that if one <strong>of</strong> the links is <strong>of</strong>ten<br />
congested, the optimal second-best toll <strong>of</strong> the other link can be negative. This study<br />
also shows that the optimal toll depends on the relative free-flow travel times and<br />
capacities <strong>of</strong> two routes, and on the price elasticity <strong>of</strong> travel demand. Welfare gains<br />
from second-best <strong>pricing</strong> are, according to this study, a small fraction <strong>of</strong> the benefits<br />
from the first-best benchmark (only 10%). Other studies have looked at ways to<br />
enhance efficiency and have incorporated the possibility <strong>of</strong> dynamic (time varying)<br />
tolls, and sorting <strong>of</strong> drivers according to value <strong>of</strong> travel time. This does indeed yield<br />
higher absolute efficiency gains.<br />
Most network studies assume a unimodal network. In reality, a traveller has the<br />
possibility to choose between modes. <strong>The</strong> leading example is the choice between<br />
public transport and the private car. Tabuchi (1993), for example, uses a second-best<br />
framework which is characterised by a <strong>road</strong>, subject to bottleneck congestion, that<br />
runs parallel to a railway. Assuming inelastic demand, and average cost <strong>pricing</strong> <strong>of</strong> rail<br />
trips (to stay in business), it is shown that the <strong>road</strong> share <strong>of</strong> travel is highest with an<br />
optimal (time-varying) <strong>road</strong> toll, and successively lower with a step toll, a uniform<br />
toll, and no toll. Another study that reviews second-best choices in a transport<br />
network with two modes is by Arnott and Yan (2000). <strong>The</strong> main difference between<br />
second-best problems on networks and those for mode choice is that, in the former<br />
case, an assumption <strong>of</strong> perfect substitutability is <strong>of</strong>ten made. Although, at first sight,<br />
the two-mode problem appears to be relatively simple, it has proved to be difficult to<br />
solve (MC-ICAM, 2002). Results are very much restricted by the assumptions made<br />
(such as fixed capacity and a fixed toll) and <strong>of</strong>ten complicated and difficult to<br />
interpret.<br />
Second-best studies have not only addressed the issue <strong>of</strong> the level <strong>of</strong> second-best tolls<br />
in different types <strong>of</strong> networks, but recently the toll location has also been included.<br />
Verhoef (2002) examined the selection <strong>of</strong> individual toll links, and the determination<br />
<strong>of</strong> toll levels using some sensitivity indicators. Yang and Zhang (2002) considered<br />
selection <strong>of</strong> optimal toll levels and optimal locations for achieving maximum social<br />
welfare using a bi-level programming approach with both discrete and continuous<br />
variables. And Shepherd and Sumalee (2004) explored the usefulness <strong>of</strong> solving the<br />
optimal toll problem for a medium scale network.<br />
Heterogeneity<br />
Travellers and <strong>road</strong> vehicles differ in a number <strong>of</strong> characteristics. Vehicles vary, for<br />
example, in the <strong>road</strong> space they occupy, and in weight and acceleration capabilities.<br />
27
Travellers have different values <strong>of</strong> time, desired speed, and so on. First-best <strong>pricing</strong><br />
<strong>of</strong>ten makes it necessary to distinguish between different vehicle types and users<br />
(because <strong>of</strong> different marginal costs). It is important to know whether first-best<br />
congestion <strong>pricing</strong> can still be implemented, given these dimensions <strong>of</strong> heterogeneity,<br />
and if not, how second-best tolls are optimally determined. In this context a<br />
distinction is <strong>of</strong>ten made between anonymous tolling schemes (independent <strong>of</strong> vehicle<br />
type and driver) and non-anonymous (type-specific) tolls.<br />
Many studies have been conducted on the implications <strong>of</strong> the problem <strong>of</strong><br />
heterogeneity and <strong>pricing</strong>. <strong>The</strong> topics range from heterogeneity in drivers’ values <strong>of</strong><br />
time and trip-timing preferences to the heterogeneity in travel speed. Another example<br />
<strong>of</strong> a study that is <strong>of</strong> interest here is that <strong>of</strong> Verhoef and Small (2004), who consider a<br />
differentiation <strong>of</strong> tolls across parallel traffic lanes by using a static model. <strong>The</strong>y show<br />
that an anonymous toll may still be optimal on each lane separately, and efficient<br />
segregation <strong>of</strong> drivers is achieved without regulation. It should be noted that the extra<br />
gains are rather small, so that a second-best single toll applied to the entire highway<br />
does not impose much <strong>of</strong> a welfare loss. Optimal anonymous tolling may entail<br />
segregation <strong>of</strong> vehicle or driver types onto separate routes.<br />
Interactions with other sectors<br />
Imperfections in other sectors <strong>of</strong> the economy have consequences for second-best<br />
optimal <strong>pricing</strong> <strong>of</strong> transport services. Modelling the transport sector typically assumes<br />
that the rest <strong>of</strong> the economy operates under first-best conditions. Although applied<br />
with the aim <strong>of</strong> simplifying the modelling exercise, it is not very realistic. For<br />
example, the existence <strong>of</strong> distortionary taxes on other markets (especially the labour<br />
market) and income distribution (which might be suboptimal) can be motivated by<br />
governmental objectives but have implications for <strong>pricing</strong> in transport. Intersectoral<br />
issues matter because transport <strong>pricing</strong> interacts with other markets that may be<br />
strongly distorted.<br />
<strong>The</strong> existing literature on intersectoral issues shows their importance for optimal<br />
<strong>pricing</strong>: they are almost always relevant (MC-ICAM, 2002). <strong>The</strong> most relevant<br />
relation is with the labour market, which is heavily distorted: labour taxes exist<br />
mainly because the government needs revenues and for equity reasons, but strongly<br />
distort the labour-leisure choice. This implies that, whenever there is a reform in<br />
transport prices, the effect on the labour market distortion should be taken into<br />
account. Moreover, since distributional objectives can hardly be achieved by using<br />
distortionary labour taxes alone, the distributional concern will almost always be<br />
relevant in transport <strong>pricing</strong>.<br />
In this context, the spending <strong>of</strong> revenues from <strong>pricing</strong> schemes is also important for<br />
the overall success <strong>of</strong> the measure. <strong>The</strong>se revenues might be used to subsidise public<br />
transport, but also to reduce labour taxes, to increase government spending on other<br />
services, and so on. <strong>The</strong> <strong>effects</strong> for other sectors should not be neglected when<br />
looking at the <strong>effects</strong> <strong>of</strong> <strong>pricing</strong>. Parry and Bento (1999), for instance, show that the<br />
general equilibrium <strong>effects</strong> <strong>of</strong> <strong>road</strong> <strong>pricing</strong> schemes are sensitive to the spending <strong>of</strong><br />
revenues, and may deviate considerably from partial equilibrium outcomes. This may<br />
have important implications for gaining social acceptance for congestion <strong>pricing</strong><br />
schemes.<br />
2.6 Conclusions<br />
This chapter has aimed to give an overview <strong>of</strong> the economics <strong>of</strong> transport <strong>pricing</strong> and<br />
provide a basic understanding <strong>of</strong> the fundamental issues in transport <strong>pricing</strong>. It<br />
28
addresses a range <strong>of</strong> complexities that arise due to the nature <strong>of</strong> the cost structure and<br />
different market conditions generally observed in the transport sector.<br />
Pricing is a method <strong>of</strong> resource allocation: there is no ‘right price’, rather there are<br />
optimal <strong>pricing</strong> strategies to permit specified aims to be achieved. Several transport<br />
<strong>pricing</strong> objectives can be distinguished, such as economic efficiency, pr<strong>of</strong>itability, and<br />
cost coverage. Whilst there are many transport <strong>pricing</strong> objectives, economists will<br />
usually argue that the pursuance <strong>of</strong> economic efficiency should take precedence.<br />
Optimising the welfare <strong>of</strong> society may even be the most important to governments<br />
involved in setting prices in mobility. <strong>The</strong> concept <strong>of</strong> economic efficiency is derived<br />
from welfare economics, and is concerned with the allocation <strong>of</strong> resources in an<br />
economy. According to this theory, prices should equate with marginal social costs<br />
(throughout the economy) in order to obtain maximum social welfare. Marginal cost<br />
<strong>pricing</strong> results in transport services being provided up to the point where the benefit<br />
for the marginal unit is equated with the costs <strong>of</strong> providing that unit.<br />
This efficient price will only prevail as a market equilibrium under certain conditions,<br />
i.e. all other markets also have efficient <strong>pricing</strong>, there are no constraints on transport<br />
prices, and market failures are non-existent. However, this optimal outcome may not<br />
reflect policy objectives. Distributional goals can be satisfied by making individual<br />
specific transfers, and, if these can be realised without distorting the market, equity<br />
and efficiency can both be reached.<br />
In most cases, however, actual market prices deviate from marginal costs for several<br />
reasons. <strong>The</strong> transport market has some characteristics, which makes it very unlikely<br />
that the market, without regulation, will set transport prices equal to marginal social<br />
costs and, therefore, social welfare is not optimised. Examples <strong>of</strong> these reasons<br />
include imperfect competition (monopoly), increasing returns to scale and<br />
externalities. One <strong>of</strong> the most particular externalities in transport is congestion.<br />
Congestion is, in fact, caused by excessive demand exceeding capacity. <strong>The</strong> price is<br />
not equal to marginal costs because the externality is not reflected in the price to be<br />
paid by the users. A Pigouvian charge would, in a first-best world, be the optimal way<br />
to internalise the external costs <strong>of</strong> congestion resulting in optimal prices.<br />
<strong>The</strong>se characteristics make marginal cost <strong>pricing</strong> unrealistic in a free market.<br />
Governments may want to intervene and set more efficient prices. This is not<br />
straightforward, as the regulator may face several barriers and constraints preventing<br />
it from setting optimal prices (e.g. technical or political in nature). Obviously, the<br />
regulator has then to resort to ‘second-best’ <strong>pricing</strong>: setting prices that are available<br />
optimally under the constraints applying. Recent research has, therefore, focused on<br />
more realistic types <strong>of</strong> second-best <strong>pricing</strong>, in which various costs or constraints deter<br />
or prevent the setting <strong>of</strong> first-best tolls. This latter is <strong>of</strong>ten regarded as a useful<br />
benchmark. Examples <strong>of</strong> second-best problems discussed in this chapter include the<br />
problem <strong>of</strong> networks and the interactions with other markets or sectors. Under<br />
second-best conditions, optimal prices may be said to be marginal cost-based, rather<br />
than identical to marginal costs. It appears that second-best prices are more difficult to<br />
determine and implement, and may lead to considerably lower welfare gains<br />
compared with first-best prices.<br />
29
Part I : Behavioural responses to transport <strong>pricing</strong><br />
31
Chapter 3<br />
Behavioural responses to <strong>road</strong> <strong>pricing</strong><br />
3.1 Introduction<br />
<strong>The</strong> previous chapter has outlined the economic principles <strong>of</strong> transport <strong>pricing</strong>. Economic<br />
theory argues that prices should equate marginal social costs to optimise welfare. Implicit<br />
assumptions on the behavioural changes <strong>of</strong> transport users to transport <strong>pricing</strong> lead to welfare<br />
changes. A Pigouvian charge, for instance, corrects for congestion costs and reduces demand<br />
for <strong>road</strong> space. This is only one type <strong>of</strong> response. This chapter discusses behavioural<br />
responses to <strong>road</strong> <strong>pricing</strong> more generally, not only theoretically but also empirically.<br />
Prices reflect the direct, internal, perceived costs involved in consuming a good, that is, the<br />
factors that individual consumers must trade <strong>of</strong>f when making purchase decisions. <strong>The</strong> term is<br />
sometimes limited to monetary costs, but it can include non-monetary costs such as time,<br />
discomfort, and risk. For example, the price <strong>of</strong> a public transport trip includes not only the<br />
financial cost <strong>of</strong> the ticket, but also expenses for getting to the bus-stop, plus the time and risk<br />
<strong>of</strong> travel. Price changes <strong>of</strong>ten affect consumption decisions. For example, one may consider a<br />
particular product too expensive at its regular price, but might buy it when it is discounted.<br />
Similarly, a price increase may motivate consumers to use less <strong>of</strong> a product or shift to another<br />
brand. Although individually these decisions may be quite variable and difficult to predict, in<br />
aggregate they tend to follow a rather predictable pattern: when prices decline consumption<br />
increases, and when prices increase consumption declines. This is called the “law <strong>of</strong> demand”.<br />
Transportation activities tend to follow this pattern. When the monetary, time, discomfort, or<br />
risk costs <strong>of</strong> travel decline, the amount <strong>of</strong> mobility (measured in trips, person-miles, or tonmiles)<br />
tends to increase.<br />
However, people’s responses to transport <strong>pricing</strong> are not that straightforward. Price increases<br />
may also induce travellers to change their modal use or change their departure time,<br />
depending on the type <strong>of</strong> measure. A wide variety <strong>of</strong> <strong>pricing</strong> measures exists, having different<br />
consequences for travel behaviour. Hence, price measures are seen as one <strong>of</strong> the major tools<br />
for policy makers to influence transport development. <strong>The</strong> design <strong>of</strong> measures will generally<br />
depend on the objectives <strong>of</strong> the government to steer the development <strong>of</strong> transport in a more<br />
desired direction. It is, therefore, important for authorities to have clear insight into the<br />
responses induced by transport <strong>pricing</strong>. This response will to a considerable extent depend on<br />
the exact design <strong>of</strong> the <strong>pricing</strong> scheme (e.g. a yearly tax on car ownership can be expected to<br />
affect the kilometrage <strong>of</strong> a given vehicle relatively weakly, compared with a kilometre<br />
charge). Equally important, however, is the price sensitivity (<strong>of</strong>ten indicated as elasticity by<br />
economists) <strong>of</strong> transport users for the various relevant types <strong>of</strong> behaviour that together define<br />
transport behaviour. People will react differently to various <strong>pricing</strong> schemes.<br />
<strong>The</strong> main aim <strong>of</strong> this chapter is to present an overview <strong>of</strong> the literature on <strong>road</strong> <strong>pricing</strong> <strong>effects</strong><br />
and identify the relevant dimensions <strong>of</strong> behaviour and assess their potential empirical<br />
relevance. It serves as input for the empirical work reported later in Chapters 4 and 5. We will<br />
mostly discuss the <strong>effects</strong> from the economic perspective, but the <strong>effects</strong> <strong>of</strong> <strong>road</strong> <strong>pricing</strong> have<br />
also been studied by other disciplines such as psychology and traffic engineering. <strong>The</strong> work<br />
<strong>of</strong> traffic engineers on <strong>road</strong> <strong>pricing</strong> <strong>effects</strong> is, in terms <strong>of</strong> underlying theoretical concepts and<br />
methods used, very much related to that <strong>of</strong> economists. We have, therefore, decided to<br />
compare the work <strong>of</strong> economists and traffic engineers on the one hand, with that <strong>of</strong><br />
psychologists on the other. It is interesting to compare the research methods that have<br />
predominantly been used, the underlying models <strong>of</strong>/or motivations for behaviour, and the<br />
33
elevant dimensions <strong>of</strong> behaviour. Besides a fundamental understanding <strong>of</strong> the possible<br />
<strong>effects</strong> that <strong>road</strong> <strong>pricing</strong> might have, we may also identify possible (in)consistencies (between<br />
disciplines) and open issues.<br />
<strong>The</strong> link between car costs and behaviour is central in this paper. We will focus on <strong>pricing</strong> in<br />
car transport and provide first an overview <strong>of</strong> possible measures and the ways people may<br />
respond to these price changes. Section 3.3 provides an overview <strong>of</strong> modelling results for<br />
various behavioural dimensions. Section 3.4 proceeds with an overview <strong>of</strong> empirical findings.<br />
Elasticities and practical experiences provide valuable knowledge about the <strong>effects</strong> <strong>of</strong> <strong>road</strong><br />
prices and price sensitivity. <strong>The</strong>se two sections have a strong economic perspective. Section<br />
3.5 continues with a brief overview <strong>of</strong> interesting psychological research and compares the<br />
findings <strong>of</strong> both approaches. Finally, Section 3.6 concludes.<br />
3.2 <strong>The</strong> price <strong>of</strong> car use and behavioural response<br />
Governments are very much involved in the transport market. Hence, transport prices are<br />
<strong>of</strong>ten set or influenced by the public sector. Governments may have several reasons or<br />
objectives for changing prices. Pricing measures are <strong>of</strong>ten used to raise revenues, they assist<br />
in traffic control and contribute towards the internalisation <strong>of</strong> external costs. Most <strong>of</strong>ten it is a<br />
combination <strong>of</strong> these objectives that is behind the implementation <strong>of</strong> a <strong>pricing</strong> scheme.<br />
Transport <strong>pricing</strong> measures can be very diverse and very much targeted towards a certain type<br />
<strong>of</strong> behaviour. B<strong>road</strong>ly speaking, transport <strong>pricing</strong> measures can be divided into five different<br />
types, according to the way charges and payments are applied (CAPRI, 1998):<br />
• Vehicle <strong>pricing</strong>, related to car ownership and usage (independent <strong>of</strong> the <strong>road</strong>s used);<br />
• Road <strong>pricing</strong>, related to use <strong>of</strong> specific <strong>road</strong>s and areas (possibly at specific times);<br />
• Parking <strong>pricing</strong>, related to use <strong>of</strong> parking spaces;<br />
• Public transport <strong>pricing</strong>, related to use <strong>of</strong> public transport;<br />
• Special taxes or subsidies, for instance related to commuting (e.g. tax allowance to deduct<br />
commuting costs when using public transport), real estate, or particular locations (e.g.<br />
near public transport facilities).<br />
This <strong>of</strong>fers governments a wide range <strong>of</strong> direct and indirect price instruments that can be<br />
implemented as part <strong>of</strong> a policy to ensure correct charging for transport. Transport system<br />
users currently do not perceive the full marginal social costs <strong>of</strong> their travel decisions. This<br />
leads to traffic volumes in excess <strong>of</strong> what is socially desirable, and it implies a suboptimal<br />
distribution <strong>of</strong> transport flows over time and space. For dealing with the various types <strong>of</strong><br />
externalities (congestion, noise, and so on) economic theory argues that prices should be set<br />
according to marginal social costs. For various (practical) reasons, this first-best type <strong>of</strong><br />
<strong>pricing</strong> is generally not used or even feasible in transport (see also Chapter 2). However, there<br />
are several policy instruments available to governments which can be used to deal with the<br />
various externalities. Current widely implemented price measures in <strong>road</strong> transport include a<br />
tax on vehicle ownership (either at purchase or on an annual basis), parking fees, and fuel<br />
taxes. Alternative <strong>pricing</strong> measures include distance-related taxes (e.g. a kilometre charge) or<br />
particular emission-based charges. <strong>The</strong> opposite <strong>of</strong> charging, viz. subsidising, is also a price<br />
instrument. Public transport subsidies are, for instance, <strong>of</strong>ten seen as a useful second-best<br />
policy in cases where private <strong>road</strong> transport for some reason cannot be, or is not priced.<br />
Transport users will respond differently to various <strong>pricing</strong> policies; some people change<br />
behaviour, others don’t. When people decide to change, possible outcomes (in terms <strong>of</strong><br />
behavioural responses) <strong>of</strong> <strong>pricing</strong> can be the following:<br />
• trip suppression (travel frequency choice);<br />
• departure time choice (and scheduling <strong>of</strong> daily activities);<br />
• different route choice;<br />
34
• changes in modal split;<br />
• changes in vehicle occupancy;<br />
• spatial choices related to relocation;<br />
• change in driving style (e.g. speed choice);<br />
• vehicle ownership;<br />
• type <strong>of</strong> vehicle/technology choice;<br />
• changes in destination choice;<br />
• class choice (for public transport).<br />
Depending on the desired aim, policy makers may now decide to make use <strong>of</strong> a particular<br />
price instrument that is likely to steer travel behaviour in a more desired direction. However,<br />
it should not be forgotten that the real effect <strong>of</strong> a price change depends on various factors<br />
which makes the predictability <strong>of</strong> the effect <strong>of</strong> a certain measure rather difficult. <strong>The</strong><br />
following sections discuss various behavioural responses to transport <strong>pricing</strong>, including effect<br />
sizes and important factors that affect this price sensitivity. We begin with results from the<br />
theoretical (economic and traffic engineering) literature, where models are used to assess the<br />
impact <strong>of</strong> a certain price measure on one <strong>of</strong> the distinguished dimensions above, and continue<br />
with an overview <strong>of</strong> important empirical findings. Finally, results from the psychological<br />
literature will be evaluated.<br />
3.3 Behavioural responses in theoretical and empirical models<br />
Transport modelling focuses on ways to simplify and abstract important relationships<br />
underlying the provision and use <strong>of</strong> transport. It is concerned with the methods, be they<br />
quantitative or qualitative, which allow us to study the relationships that underlie<br />
transportation decision making. In some cases, models can be purely descriptive, but more<br />
<strong>of</strong>ten there is the explicit aim <strong>of</strong> seeking the key links between causes and <strong>effects</strong> in transport<br />
decision making either by the providers <strong>of</strong> transport services or by the users. This is<br />
particularly important in practice because transport models are used not only by researchers<br />
but also <strong>of</strong>ten by policy makers. <strong>The</strong>y need to know the likely implications <strong>of</strong> their actions on<br />
transport behaviour. Hence, models are mainly used to examine the impacts (in terms <strong>of</strong><br />
efficiency or pr<strong>of</strong>its, for example) <strong>of</strong> particular policy measures, and to determine the<br />
behavioural responses <strong>of</strong> transport users.<br />
A wide variety <strong>of</strong> modelling approaches has been proposed for particular problems. Road<br />
traffic congestion, for instance, is one <strong>of</strong> the transport problems that has been extensively<br />
modelled (for an overview <strong>of</strong> models used to study traffic congestion, see Lindsey and<br />
Verhoef, 2000). One reason is that different (policy) questions related to traffic congestion<br />
require different types <strong>of</strong> models. Moreover, traffic congestion is a complex phenomenon,<br />
involving complicated temporal and spatial dynamics. Economists, however, seek<br />
manageable analytical formulations to characterise the problem studied and to derive<br />
(optimal) results for policy makers.<br />
We are particularly interested in the behavioural responses <strong>of</strong> transport users to <strong>pricing</strong><br />
measures. <strong>The</strong> <strong>effects</strong> <strong>of</strong> a <strong>pricing</strong> measure can be simulated by using a model that tries to<br />
capture most <strong>of</strong> the forces and interrelationships determining transport patterns. Model<br />
parameters, elasticities and functional forms are most <strong>of</strong>ten taken from observed data, as<br />
discussed in the following section. This should ensure that both the qualitative and, to a<br />
certain extent, the quantitative conclusions are applicable in reality, and not just confined to<br />
the particular computer simulation.<br />
Models, developed by economists or traffic engineers, have to make assumptions on the<br />
behavioural responses <strong>of</strong> transport users in order to estimate the <strong>effects</strong> <strong>of</strong> particular <strong>pricing</strong><br />
measures. It is interesting to investigate how this is done and what the particular results <strong>of</strong><br />
35
these modelling experiments are for the various types <strong>of</strong> behavioural responses mentioned in<br />
Section 3.2. We provide a brief overview <strong>of</strong> the treatment <strong>of</strong> behavioural issues in the<br />
modelling literature, and try to gain insight in the direction and size <strong>of</strong> the expected <strong>effects</strong> <strong>of</strong><br />
the measures. Variabilisation (replacement <strong>of</strong> fixed car taxation by a kilometre charge) will be<br />
treated separately given its relevance to our empirical work that will be discussed later in<br />
Chapters 4 and 5. Note that completeness is not the aim: the following subsections only<br />
provide some illustrative research examples <strong>of</strong> those behavioural responses that are also<br />
included in our empirical survey to be discussed in the next two chapters.<br />
3.3.1 Trip suppression<br />
Demand modelling for person travel has been dominated by the four-step model (see for an<br />
overall reference Ortuzar and Willumsen, 1994). <strong>The</strong> first stage <strong>of</strong> this model, trip generation,<br />
defines the magnitude <strong>of</strong> total daily traffic. Since we focus on <strong>pricing</strong>, we discuss trip<br />
suppression, rather than trip generation. Models including an elastic demand function assume<br />
that the number <strong>of</strong> trips made (or kilometres driven) will decline with an increase in prices.<br />
Most static models use an elastic demand function, whereas dynamic models (discussed later<br />
to predict departure time choices) <strong>of</strong>ten have inelastic demand functions. Static-stationary<br />
state economic models have in common that traffic speeds, flows and densities are uniform<br />
across drivers and constant along the <strong>road</strong> and – as it were – over time, in the sense that they<br />
do not change during a driver’s trip (Verhoef, 2002). <strong>The</strong> models proposed differ particularly<br />
in terms <strong>of</strong> the argument deployed in the specification <strong>of</strong> cost (normally a generalised cost<br />
function) and inverse demand functions used for the characterisation <strong>of</strong> free-market and<br />
efficient market equilibria. <strong>The</strong> demand curve is <strong>of</strong>ten assumed to slope downwards to reflect<br />
the fact that, as for most commodities, the number <strong>of</strong> trips people want to make decreases<br />
with the price. In such a setting, Pigou, for instance, derived his optimal toll tax equal to the<br />
marginal congestion costs (Pigou, 1920).<br />
3.3.2 Departure time choice<br />
<strong>The</strong> choice <strong>of</strong> departure time by <strong>road</strong> users has been studied using dynamic models. <strong>The</strong>se<br />
time-dependent models <strong>of</strong> congestion build on time-independent models by adding two<br />
elements: a specification <strong>of</strong> how travel demand depends on time, and a specification <strong>of</strong> how<br />
traffic flows evolve over time and space (Lindsey and Verhoef, 2001). In these models, <strong>road</strong><br />
users typically have a desired arrival time at work, deviations from which imply that schedule<br />
delay costs will be incurred. Each individual decides when to depart from home, so as to<br />
minimise trip price, which, in the absence <strong>of</strong> a toll, consists <strong>of</strong> travel time costs and schedule<br />
delay costs. Equilibrium requires that the trip price be uniform over the departure period and<br />
higher outside this period. In the simplest version <strong>of</strong> the model, each morning commuter<br />
travels from home to work along a single <strong>road</strong> which has a bottleneck <strong>of</strong> fixed flow capacity.<br />
Originally proposed by Vickrey (1969), this specific congestion technology (endogenising<br />
individuals’ departure times) has been made popular especially by the work <strong>of</strong> authors such as<br />
Arnott et al. (1993, 1998) and Small (1992). <strong>The</strong> bottleneck model is simplified by the<br />
assumption that commuters have the same value <strong>of</strong> time, and demand is price inelastic: N<br />
individuals commute, one per vehicle, regardless <strong>of</strong> the trip cost. This implies that the overall<br />
demand for transport will not change when the price changes. <strong>The</strong> price may only affect the<br />
departure time <strong>of</strong> commuters, ideally in such a way that <strong>road</strong> capacity meets demand<br />
throughout the peak period. <strong>The</strong> demand is then equally distributed over time.<br />
In a two-route setting, Arnott et al. (1990) show that in equilibrium without tolls, wasteful<br />
queuing occurs, although the number <strong>of</strong> drivers on each route is the same as in the system<br />
optimum. An optimal time-varying toll eliminates queuing without affecting route usage.<br />
Uniform and step tolls alter route usage, but only slightly. Step tolls generally yield much<br />
36
greater efficiency gains than uniform tolls because they reduce queuing by altering departure<br />
times.<br />
3.3.3 Route choice behaviour<br />
Research has been carried out on the effectiveness <strong>of</strong> <strong>pricing</strong> measures in reallocating traffic<br />
volumes over a network. Economists <strong>of</strong>ten focus on the implications <strong>of</strong> congestion <strong>pricing</strong> on<br />
social welfare. For example, Arnott et al. (1990) study user equilibrium, system optimum, and<br />
various <strong>pricing</strong> regimes for a network <strong>of</strong> two routes in parallel. <strong>The</strong>y use the bottleneck model<br />
in which traffic flow is either uncongested or fixed at a capacity independent <strong>of</strong> traffic<br />
density. Besides departure time, that paper also considers route choices which are assumed to<br />
be governed by the trade-<strong>of</strong>fs between travel time and schedule delay costs. As usual, demand<br />
is inelastic in this model; hence, gross benefits cannot be evaluated using demand functions.<br />
<strong>The</strong> study focuses on first-best analysis and does not consider the case in which efficient tolls<br />
cannot be imposed on both routes. Another study, by Liu and McDonald (1999), considers an<br />
urban highway network consisting <strong>of</strong> two routes connecting an origin and a destination and<br />
analyses travellers’ route choice behaviour. One route is tolled, and on account <strong>of</strong> technical<br />
and/or political constraints, the other route must remain untolled. In addition, the study<br />
considers two time periods: peak and <strong>of</strong>f-peak, to describe travellers’ departure time choice.<br />
Travel costs consist <strong>of</strong> travel time costs (caused by congestion) and schedule-related costs.<br />
<strong>The</strong> demand for transport in one period is a function <strong>of</strong> trip prices in both peak and pre-peak<br />
periods. <strong>The</strong> results show that the optimum second-best tolls can vary appreciably from the<br />
optimal first-best tolls imposed on all routes. Second-best congestion <strong>pricing</strong> is found to have<br />
three major impacts on the allocation <strong>of</strong> traffic volume: (1) diversion <strong>of</strong> peak period traffic to<br />
the free route; (2) shift <strong>of</strong> peak period traffic to the <strong>of</strong>f-peak period; and (3) reduction in total<br />
traffic volume (Liu and McDonald, 1999). Furthermore, it is found that second-best tolls are<br />
less effective in reallocating traffic volume than first-best prices.<br />
3.3.4 Modal split choice<br />
Pricing <strong>of</strong> car travelling may induce people to use other modes <strong>of</strong> transport. Tabuchi (1993),<br />
for example, models a setting in which travellers have a choice between driving and using<br />
public transit. This second-best framework is characterised by a <strong>road</strong>, subject to bottleneck<br />
congestion, that runs parallel to a railway. Railway operating costs include a fixed cost and a<br />
constant marginal cost per traveller. <strong>The</strong> railway is congestion free, but uneconomic to run at<br />
a low number <strong>of</strong> passengers. Assuming inelastic demand, and average cost <strong>pricing</strong> <strong>of</strong> rail trips<br />
(to stay in business), it is shown that the <strong>road</strong> share <strong>of</strong> travel is highest with an optimal (timevarying)<br />
<strong>road</strong> toll and successively lower with a step toll, a uniform toll, and no toll. But<br />
having an uncongested railway as the alternative mode, rather than a congested highway,<br />
changes the relative efficiency gains <strong>of</strong> the various <strong>road</strong> tolls. At sufficiently high levels <strong>of</strong><br />
demand, a uniform toll yields more than half the efficiency gains <strong>of</strong> the optimal toll. <strong>The</strong>se<br />
benefits result from diverting people from the congested <strong>road</strong> to the uncongested rail network.<br />
In estimating location <strong>effects</strong>, Eliasson and Mattsson (2001) (for more detail <strong>of</strong> the model, see<br />
Section 3.3.6 on location <strong>effects</strong>) include a public transport system in their simulation model<br />
<strong>of</strong> a generic city. This study also provides estimated <strong>effects</strong> <strong>of</strong> congestion <strong>pricing</strong> on travel<br />
patterns. <strong>The</strong> implementation <strong>of</strong> general congestion <strong>pricing</strong> leads to less car traffic in terms <strong>of</strong><br />
total distance travelled (about 24% less) and total travel time (about 57% less). <strong>The</strong> use <strong>of</strong><br />
public transport is assumed to increase (by 4 to 5 percentage units higher than without<br />
congestion <strong>pricing</strong>), whereas car shares decline.<br />
37
3.3.5 Vehicle occupancy<br />
Whereas congestion <strong>pricing</strong> and the derivation <strong>of</strong> optimal tolls have received ample attention,<br />
the issue <strong>of</strong> carpooling has largely been neglected in the literature. For instance, Daganzo<br />
(1982) made a first attempt to incorporate carpooling in equilibrium traffic assignment in<br />
general networks, but the demand for carpools is assumed to be fixed. This means that the<br />
model fails to include the mode choice behaviour <strong>of</strong> commuters. Yang and Huang (1999),<br />
however, use a deterministic equilibrium mode choice model with overall elastic demand.<br />
<strong>The</strong>ir analysis concerns the carpooling and congestion <strong>pricing</strong> problem in a multi-lane<br />
highway with HOV (high-occupancy vehicle) lanes. Numerical examples show the efficiency<br />
<strong>of</strong> HOV lanes, first- and second-best <strong>pricing</strong> and their combinations. Despite the fact that the<br />
model is highly simplified, the findings may be relevant for the design and operations <strong>of</strong><br />
combined congestion <strong>pricing</strong> and HOV lanes in practice, such as in California. <strong>The</strong>y found<br />
that marginal cost <strong>pricing</strong> provides the most efficient policy option under either elastic or<br />
inelastic demand. Reserving one or more entire lanes for carpooling vehicles rarely reduces<br />
total costs and nor does it improve social welfare, given marginal cost prices. Nevertheless,<br />
conventional carpool lanes alone can be justified at reasonably high congestion levels.<br />
Differentiation <strong>of</strong> tolls across commuting modes should be cautiously implemented. <strong>The</strong><br />
optimal uniform second-best toll is a weighted sum <strong>of</strong> the marginal external congestion costs<br />
between non-carpooling and carpooling commuters.<br />
3.3.6 Location choices<br />
<strong>The</strong> <strong>effects</strong> <strong>of</strong> <strong>road</strong> <strong>pricing</strong> on transport and location patterns have been much discussed.<br />
Simulation models for a typical city can be used to examine the impacts <strong>of</strong> <strong>road</strong> <strong>pricing</strong> on<br />
transport and location patterns. <strong>The</strong> model city should then be calibrated to replicate typical<br />
observed location and travel patterns. Model parameters, elasticities, functional forms, and so<br />
on can be taken from land use and transport models estimated on observed data. This should<br />
ensure that the conclusions are also applicable in reality. <strong>The</strong> first studies on this issue date<br />
back to the 1970s when Solow and Vickrey (1971) look at traffic patterns, congestion costs,<br />
and land use. <strong>The</strong>y show that, without congestion tolls, the market value <strong>of</strong> land may be a<br />
poor guide to land-use decisions, and lead to an overallocation <strong>of</strong> land to transportation.<br />
Solow (1973) confirms this result by using a simulation model <strong>of</strong> urban activity including the<br />
congestion costs <strong>of</strong> transportation. He shows that rents nearer the city are too low to properly<br />
reflect the social worth <strong>of</strong> transportation costs in the absence <strong>of</strong> congestion tolls. This will<br />
result in more land to be taken for use as <strong>road</strong>s than is socially desirable. It remains unknown<br />
what the consequences are for location patterns. Another topical contribution from this period<br />
compares a model <strong>of</strong> equilibrium land use patterns in the residential ring <strong>of</strong> an urban area with<br />
an optimal one (Oron et al., 1973). <strong>The</strong>y show that scarce resources can be saved by<br />
households moving from the periphery to more central locations in a distorted situation with<br />
suboptimal congestion tolls. Proper <strong>pricing</strong> <strong>of</strong> transportation will most probably lead to less<br />
suburbanisation.<br />
More recently, Eliasson and Mattsson (2001) have developed a simulation model <strong>of</strong> a generic<br />
city to study the <strong>effects</strong> <strong>of</strong> general congestion <strong>pricing</strong> and more specific toll ring <strong>pricing</strong>. <strong>The</strong><br />
city, consisting <strong>of</strong> homogenous zones, contains four types <strong>of</strong> actors: households, employers,<br />
shops, and service establishments. <strong>The</strong> location <strong>of</strong> households is determined by their value <strong>of</strong><br />
plot size and accessibility to workplace, shops and service establishments. Firms locate only<br />
according to accessibility to households. Shops and service establishments locate according to<br />
the accessibility to households with this difference – that they evaluate the expected number<br />
<strong>of</strong> customers in each zone. <strong>The</strong>y also take into account the proximity to working places and<br />
the size <strong>of</strong> the plot. It would go too far to discuss all other assumptions <strong>of</strong> the model at this<br />
point; rather we focus on the outcomes. It appears that the location <strong>effects</strong> <strong>of</strong> congestion<br />
38
<strong>pricing</strong> are quite small when compared with the <strong>effects</strong> on the travel pattern. This is related to<br />
the assumption that a well-functioning public transport system is available. According to their<br />
results, congestion <strong>pricing</strong> makes the city less dispersed. However, it is not primarily the city<br />
centre that grows denser, but the innermost ring <strong>of</strong> suburbs, which gain about 2% more<br />
households and workplaces and about 5% more shops at full congestion <strong>pricing</strong>. <strong>The</strong> authors<br />
claim that the findings are consistent with findings <strong>of</strong> various empirical model studies. <strong>The</strong><br />
location <strong>effects</strong> <strong>of</strong> a toll ring are fairly small and depend strongly on where the toll ring is<br />
located.<br />
3.3.7 Driving behaviour (speed choice)<br />
Most economic models assume traffic congestion to be caused by a technical, exogenouslygiven<br />
speed-flow relation. <strong>The</strong> speed-flow relationship is regarded as a reflection <strong>of</strong> what may<br />
be called ‘traffic technology’. Driver behaviour does not determine this relationship in<br />
conventional modelling. <strong>The</strong> speed choice can, however, have important implications for the<br />
level <strong>of</strong> congestion and, for this reason should not be ignored. Verhoef and Rouwendal (2004)<br />
have included driving behaviour in their analysis by developing a model, in which <strong>road</strong> users<br />
choose an optimal speed, given the situation, so as to minimise generalised travel costs<br />
(including monetary costs (fuel), time costs, and expected accident costs). Road users are<br />
heterogeneous with respect to their willingness to pay for making a trip, so that the demand<br />
function is generally not perfectly inelastic. All <strong>road</strong> users choose a speed so as to minimise<br />
their private generalised cost function. <strong>The</strong> overall welfare optimum in their model requires<br />
tolls to be either accompanied by speed policies, or set as a function <strong>of</strong> speed. This suggests<br />
that speed policies may be a strong instrument in the regulation <strong>of</strong> flow congestion.<br />
3.3.8 Vehicle ownership<br />
It is generally acknowledged that the level <strong>of</strong> car ownership depends on, inter alia, the<br />
available income, basic travel demand due to household structure and the costs <strong>of</strong> car use and<br />
car ownership. However, the relationship between <strong>pricing</strong> and car ownership has only rarely<br />
been studied. <strong>The</strong> vehicle ownership decision is usually not included in simulation modelling,<br />
and the few studies that do incorporate it do so in a rather fragmented way (De Borger, 2001).<br />
One <strong>of</strong> the exemptions is variabilisation modelling, which analyses the consequences <strong>of</strong><br />
decreased fixed prices (e.g. ownership taxes) and increased variable charges (e.g. fuel prices).<br />
Variabilisation will be discussed separately because <strong>of</strong> its relevance for our empirical work.<br />
Van Dender (1996) finds <strong>of</strong> a strong expansion <strong>of</strong> car ownership (and, consequently, a small<br />
decrease <strong>of</strong> mileage) when replacing all fixed type <strong>of</strong> taxes by variable taxes and using a<br />
dynamic model. <strong>The</strong>se rather indecisive results on the <strong>effects</strong> <strong>of</strong> changes in price structures on<br />
car ownership are confirmed by Bates (2000), who concludes, on the basis <strong>of</strong> a review <strong>of</strong> the<br />
international literature that it has been difficult to introduce price terms in car ownership<br />
models. Since the variability <strong>of</strong> prices is usually rather low, it appears difficult to estimate<br />
models that are able to simulate the <strong>effects</strong> <strong>of</strong> changes in price structures on overall car<br />
ownership. It can be concluded, therefore, that there are some contradictory results concerning<br />
car ownership following from the above-mentioned studies. However, more research in this<br />
field is recommended.<br />
3.3.9 Technology choice<br />
Transport in general, and <strong>road</strong> transport in particular, causes a variety <strong>of</strong> external <strong>effects</strong>,<br />
environmental <strong>effects</strong> being one <strong>of</strong> these. <strong>The</strong> basic concept <strong>of</strong> marginal external cost <strong>pricing</strong><br />
is straightforward: wherever efficient prices appear to be lacking, apply the price mechanism<br />
and set appropriate prices. In order to include environmental <strong>effects</strong>, such as noise or<br />
emissions, in prices, cars should be taxed differently and according to the costs they cause.<br />
39
<strong>The</strong> choice for a certain type <strong>of</strong> technology can be influenced by different prices. Verhoef<br />
(2000) demonstrates that marginal external cost <strong>pricing</strong> provides optimal incentives, in both<br />
the short and the long run and, when choosing environmental technology, in the choice <strong>of</strong><br />
vehicle. <strong>The</strong> environmental performance <strong>of</strong> the car stock also depends on the type <strong>of</strong> fuel that<br />
cars use. Depending on the differentiation in the price, the composition <strong>of</strong> the car fleet can be<br />
influenced. A variable charge per kilometre may (partly) be based upon the environmental<br />
performance (e.g. emissions) <strong>of</strong> a car. But the system <strong>of</strong> fixed charges at the moment <strong>of</strong><br />
purchase can also influence this aspect. <strong>The</strong> price <strong>of</strong> a car can be based upon its relative or<br />
absolute environmental performance. More environmentally friendly cars will be purchased<br />
when the costs <strong>of</strong> environmentally-unfriendly cars are increased and/or the costs <strong>of</strong><br />
environmentally friendly cars are decreased. Modelling studies including this type <strong>of</strong><br />
behaviour are scarce in the literature. <strong>The</strong> study <strong>of</strong> MuConsult (1998) outlines that, depending<br />
on the way <strong>of</strong> variabilisation, a bigger car is more <strong>of</strong>ten replaced than an average-sized or<br />
small car. <strong>The</strong>se <strong>effects</strong> are stronger when the charge is higher or differentiated according to<br />
the weight <strong>of</strong> the car. In addition, this study shows that some car drivers will replace their car<br />
by a more fuel efficient one. Depending again on the way <strong>of</strong> variabilisation, between 1.1%<br />
and 2.7% <strong>of</strong> the total vehicle stock will be replaced by a more fuel-efficient type <strong>of</strong> car.<br />
3.3.10 Variabilisation<br />
Since we will study the <strong>effects</strong> <strong>of</strong> different types <strong>of</strong> kilometre charges (including measures<br />
where revenues are used to compensate for the abolishment <strong>of</strong> fixed car taxes), it is interesting<br />
to discuss results from what are called ‘variabilisation studies’. A few studies have been<br />
completed on this issue in the Netherlands, initiated as a result <strong>of</strong> the increasing policy<br />
interest for a kilometre charge.<br />
One <strong>of</strong> the first studies on the mobility <strong>effects</strong> <strong>of</strong> variabilisation was conducted by MuConsult<br />
in 1998 (MuConsult, 1998). A model was used to study the <strong>effects</strong> <strong>of</strong> different kilometre<br />
charges, with the restriction that the revenues for the government remain constant (fixed car<br />
taxation was lowered accordingly or abolished). <strong>The</strong>y show that, depending on the level <strong>of</strong> the<br />
charge, implementation may lead to a considerable reduction in total kilometres driven. A<br />
kilometre charge <strong>of</strong> 7 €cents, for instance, leads to a total reduction <strong>of</strong> 19%. Business traffic is<br />
least affected in this scenario (7%), whereas social traffic (23%) and commuting traffic (19%)<br />
are most sensitive. Most <strong>of</strong> these car kilometres are replaced by bicycle use and car-pooling.<br />
Effects are less strong when the charge is lower. A charge <strong>of</strong> 3 €cents is estimated to decrease<br />
commuting traffic by 5% and social traffic by 8%. A remarkable prediction <strong>of</strong> this study is the<br />
decrease in car ownership for all scenarios considered; apparently the effect <strong>of</strong> the increase in<br />
the variable charge dominates the effect <strong>of</strong> lower ownership costs.<br />
A stated preference survey among both car owners and non-car owners reported in<br />
MuConsult (2002) has also analysed the behavioural responses to different types <strong>of</strong> a<br />
kilometre charge with the abolition <strong>of</strong> fixed taxes. Here, we will discuss their predicted <strong>effects</strong><br />
<strong>of</strong> the replacement <strong>of</strong> the Dutch car ownership tax (the ‘MRB’) only, and <strong>of</strong> both the MRB<br />
and the tax on car purchase (the ‘BPM’). 2 <strong>The</strong> charges were differentiated according to fuel<br />
type, the MRB-only scenario included a charge <strong>of</strong> 2.4 €cents per kilometre for petrol-using<br />
cars (with slightly higher charges for cars running on diesel and gas), whereas the<br />
MRB+BPM scenario included a charge <strong>of</strong> 4.9 €cents (equal levels for other fuel types). In<br />
contrast to the earlier MuConsult study, this study predicts an increase in car ownership levels<br />
for all alternatives considered. <strong>The</strong> car stock is assumed to show stronger growth under the<br />
MRB-only scenario compared with the MRB+BPM scenario (2.8% vs. 1.2%). <strong>The</strong> higher<br />
2 Dutch car taxation consists <strong>of</strong> a fuel tax and two taxes that are independent <strong>of</strong> car use: a car ownership tax<br />
(motorrijtuigenbelasting (MRB)) and a tax to be paid at purchase <strong>of</strong> a new car (belasting op personenauto’s en<br />
motorrijwielen (BPM)).<br />
40
charges in this latter scenario induce relatively more car owners to sell their car (4.6% vs.<br />
1.3%). <strong>The</strong> effect on the second-hand market, where car prices may go down, has not been<br />
included. <strong>The</strong> results in terms <strong>of</strong> kilometres indicate a small reduction for the MRB-only<br />
scenario <strong>of</strong> about 0.9% and a somewhat larger effect <strong>of</strong> 3.4% for the other scenario. <strong>The</strong>se<br />
<strong>effects</strong> include a decrease in kilometres by car owners and an increase <strong>of</strong> kilometres driven by<br />
respondents who indicate they would purchase a new car (estimated around 2% for both<br />
scenarios). In particular, social, shopping and recreational trips will be adjusted, whereas<br />
business traffic and kilometres driven for school or educational purposes remain almost<br />
unchanged. About 30% <strong>of</strong> the commuting trips will be adjusted, but less <strong>of</strong>ten than the social<br />
and shopping trips.<br />
Recently (in a study initiated by a request from the Dutch Minister to search for a new,<br />
widely-approved, <strong>pricing</strong> regime), the traffic <strong>effects</strong> <strong>of</strong> various <strong>road</strong> <strong>pricing</strong> alternatives have<br />
once more been investigated using the LMS (Landelijk Model Systeem) model developed for<br />
the Netherlands (AVV, 2005). This is a network model, whereas previously mentioned model<br />
results are mostly limited to isolated <strong>road</strong> segments. A network can be represented as a set <strong>of</strong><br />
origin-destination pairs, a set <strong>of</strong> routes connecting each OD pair, and a set <strong>of</strong> directed links for<br />
each route, where links may be shared by more than one route. This type <strong>of</strong> models may be<br />
used to forecast traffic flows for a certain region or country. <strong>The</strong>y enable the <strong>effects</strong> <strong>of</strong> various<br />
policy scenarios (on mobility) to be predicted taking into account the zonal characteristics<br />
such as income and size <strong>of</strong> the working population. <strong>The</strong> model shows the <strong>effects</strong> on the<br />
number <strong>of</strong> trips on particular <strong>road</strong>s, departure time choice, modal choice (train,<br />
bus/underground, slow traffic, car, and car occupancy), and destination choice both in the<br />
short run and the long run. One <strong>of</strong> the drawbacks <strong>of</strong> the model is that it is not a dynamic<br />
model. It only shows the end situation; it is unclear how behaviour is adjusting to new<br />
measures in-between.<br />
Of the ten different alternatives that have been evaluated with this model, there were four<br />
variabilisation measures. When all fixed taxes (MRB and BPM) are replaced by a kilometre<br />
charge (with budget neutrality for the government), the model predicts a decrease in car use<br />
(in terms <strong>of</strong> kilometres) <strong>of</strong> 11% (compared with the reference situation in 2020). <strong>The</strong> average<br />
charge per kilometre causing these <strong>effects</strong> was about 5.7 €cents, and depended on fuel type<br />
and weight <strong>of</strong> the car. <strong>The</strong> level <strong>of</strong> congestion in 2020 is assumed to be reduced by 40% (in<br />
terms <strong>of</strong> vehicle hours lost). People will change mode (use <strong>of</strong> train, bus/metro, and slow<br />
transport increases in terms <strong>of</strong> kilometres by about 6%), and there will especially be an<br />
increase in social traffic (29%, in terms <strong>of</strong> car-driven kilometres), and, to a lesser extent,<br />
commuting (9%) will be reduced.<br />
Another considered alternative included variabilisation <strong>of</strong> all car ownership taxes and one<br />
quarter <strong>of</strong> the car purchase taxes. <strong>The</strong> average kilometre charge is consequently lower (3.4<br />
€cents) than the previous measure, but an additional charge <strong>of</strong> 0.11 €cents was levied on<br />
locations and times with severe congestion. <strong>The</strong> LMS model outcomes suggest that growth <strong>of</strong><br />
congestion will be reduced by about 45% (with 5% more reduction in peak periods than the<br />
rest <strong>of</strong> the day). Trip distances will decrease. This effect is limited for commuting trips but<br />
larger for social trips. Business traffic (6%) and freight traffic (1%) are predicted to increase,<br />
but total traffic demand will decrease (by 10%) as a result <strong>of</strong> considerably less commuting<br />
(16%) and social kilometres (25%).<br />
<strong>The</strong> modelling studies predict larger <strong>effects</strong> on car use than the stated preference study <strong>of</strong><br />
MuConsult (2002). However, comparing these studies is not straightforward because <strong>of</strong><br />
differences in the types <strong>of</strong> measures (e.g. differentiation according to weight versus fuel type)<br />
that have been evaluated and their underlying assumptions (e.g. the LMS model does not<br />
include car ownership <strong>effects</strong>). Charge levels in the modelling studies have been on average<br />
41
somewhat higher than in the MuConsult 2002 stated preference study, which may be one<br />
explanation for the larger <strong>effects</strong>.<br />
3.4 Behavioural responses: empirical findings<br />
When policy makers consider the implementation <strong>of</strong> any type <strong>of</strong> measure, they want to be<br />
informed about the <strong>effects</strong>. In the case <strong>of</strong> <strong>road</strong> <strong>pricing</strong>, they might have different possibilities<br />
to obtain knowledge. A set <strong>of</strong> elasticities based on the existing literature, and empirical<br />
experiences elsewhere, can provide indicative answers to the questions about the effectiveness<br />
<strong>of</strong> <strong>pricing</strong> measures. We will discuss both issues in the following subsections.<br />
3.4.1 Elasticities<br />
Changes in prices will normally lead to changes in demand for goods or products. <strong>The</strong> extent<br />
<strong>of</strong> this behavioural response depends on the steepness or flatness <strong>of</strong> the demand curve. <strong>The</strong><br />
sensitivity to price changes is expressed by economists in the concept <strong>of</strong> elasticity. <strong>The</strong> price<br />
elasticity <strong>of</strong> demand is defined as the percentage change in the quantity demanded divided by<br />
the percentage change in price (Stiglitz and Driffill, 2000). <strong>The</strong> elasticity concept is a<br />
dimensionless measure <strong>of</strong> the sensitivity <strong>of</strong> a dependent variable to changes in an independent<br />
variable. So the unit <strong>of</strong> measurement (be it euros or cents and metres or kilometres) <strong>of</strong> the<br />
variables does not make a difference. <strong>The</strong> elasticity value will be the same, regardless <strong>of</strong> how<br />
the variables are expressed, which is an advantage <strong>of</strong> the elasticity concept over other<br />
measures <strong>of</strong> sensitivity. It measures the responsiveness <strong>of</strong> demand to a change in price. An<br />
elasticity can be positive or negative. Price elasticities are usually negative. <strong>The</strong> dependent<br />
variable is called elastic with regard to the independent variable when the absolute value <strong>of</strong><br />
the elasticity exceeds 1. In other cases, the dependent variable is inelastic, while a fixed<br />
‘dependent’ variable is said to be perfectly inelastic.<br />
Although it is possible to derive elasticities directly from empirical data (e.g. a before-andafter<br />
study <strong>of</strong> an infrastructure project), normally models are used to derive elasticities.<br />
Practically all elasticities found in the literature are based on models <strong>of</strong> some kind (De Jong et<br />
al., 1998).<br />
<strong>The</strong> most important distinctions within travel demand models that are used in practice to<br />
derive elasticities, are distinctions with regard to the choice that is modelled and the type <strong>of</strong><br />
data used. Models for the following choices can be found in the literature (De Jong and Gunn,<br />
2001):<br />
• Mode choice;<br />
• Car use;<br />
• Fuel consumption;<br />
• Departure time choice;<br />
• Destination choice;<br />
• Travel frequency choice;<br />
• Car ownership;<br />
• Residential choice.<br />
It is clear from the previous discussion that a wide variety <strong>of</strong> elasticities can be computed, in<br />
view <strong>of</strong> the various <strong>pricing</strong> regimes possible and the large number <strong>of</strong> <strong>effects</strong> that can be<br />
studied. Moreover, one can analyse long-term or short-term <strong>effects</strong>, but it is also possible to<br />
compare different countries, as elasticities are likely to differ from a geographical perspective.<br />
Many studies have been conducted providing many estimates <strong>of</strong> very specific types <strong>of</strong><br />
elasticities. It is not the aim to give a complete overview <strong>of</strong> all transport demand elasticities<br />
that have appeared in the literature in the past (for international reviews <strong>of</strong> travel demand<br />
elasticities, see, e.g., Oum et al., 1992, and Goodwin, 1992). Hence, we will focus on<br />
particular estimates relevant to our study. <strong>The</strong>refore we will have a look at:<br />
42
• Recent studies;<br />
• Both long-term and short-term elasticities;<br />
• Elasticities <strong>of</strong> fuel price changes, annual charges, vehicle kilometre charges, and<br />
purchase taxes;<br />
• Effects on car stock, fuel consumption, car use, route choice, and modal split.<br />
<strong>The</strong> studies included here give a general impression <strong>of</strong> some international estimates (Table<br />
3.2) and particular European estimates found in the literature (Table 3.1). <strong>The</strong> TRACE project<br />
collected many European car cost elasticities <strong>of</strong> demand for car travel and public transport for<br />
different trip purposes. <strong>The</strong> main findings <strong>of</strong> the literature review on these elasticities have<br />
been reported in De Jong and Gunn (2001). <strong>The</strong>se elasticities are unweighted means from<br />
different studies.<br />
Fuel price elasticities<br />
<strong>The</strong> most widely studied elasticities are the direct fuel price elasticities, which indicate the<br />
<strong>effects</strong> <strong>of</strong> an increase or decrease in fuel price. Most studies have looked at the effect <strong>of</strong> fuel<br />
prices on car stock, fuel consumption, and car use.<br />
Looking at the effect <strong>of</strong> an increase in fuel price on fuel consumption, it appears that less fuel<br />
will be used. Note that fuel consumption can be reduced without reducing car use, as a result<br />
<strong>of</strong> changes in driving behaviour or fuel efficiency. This explains larger elasticities related to<br />
fuel consumption than those related to car use (car mileage) or car stock. Brons (2006)<br />
reports, for instance, a large effect on fuel efficiency in a meta-analysis <strong>of</strong> various studies. He<br />
finds a mean <strong>of</strong> -0.53 (both in the short and long run) for the price elasticity <strong>of</strong> demand for<br />
gasoline, which is caused by responses in fuel efficiency (0.22) and car ownership (-0.22),<br />
and to a lesser degree to a response in car use (-0.1).<br />
Summarising international research, Goodwin (1992) estimates the price elasticity <strong>of</strong> gasoline<br />
demand to be -0.27 in the short run and -0.71 in the long run (see Table 3.2). He predicts that<br />
a 10% increase in vehicle fuel prices will have the following <strong>effects</strong>:<br />
• In the short run, it reduces fuel consumption by 2.7%, in part as a result <strong>of</strong> more fuel<br />
efficient driving (such as shifting more driving to a household’s most fuel-efficient<br />
car);<br />
• In the long run, it reduces petroleum consumption by 7% or more, in part as a result <strong>of</strong><br />
the purchase <strong>of</strong> more fuel-efficient vehicles.<br />
Increased fuel prices cause a combination <strong>of</strong> reduced driving and increased fuel efficiency.<br />
Short-term fuel savings consist <strong>of</strong> reduced driving, and a shift toward using more fuelefficient<br />
vehicles, particularly in multi-vehicle households where drivers have short-term<br />
choices. Long-term fuel savings consist primarily <strong>of</strong> purchases <strong>of</strong> more fuel-efficient vehicles.<br />
Other researchers report similar results in both the short term and the long term. Espey<br />
(1998), for instance, summarises a large number <strong>of</strong> studies and finds that short-run price<br />
elasticity estimates for the demand for fuel range from 0 to -1.36, averaging -0.26.<br />
An increase in fuel prices also has <strong>effects</strong> on car use and car ownership as can be seen from<br />
both Table 3.1 and Table 3.2. Goodwin finds a long run price elasticity <strong>of</strong> kilometres driven<br />
with respect to fuel price <strong>of</strong> –0.33, in the short run this is –0.16. This means that a 10% fuel<br />
price increase is likely to reduce driving by 1.6% in the short run, and by 3.3% over the long<br />
run. <strong>The</strong>se results are consistent with other international research (e.g. Johansson and<br />
Schipper (1997) find an effect <strong>of</strong> –0.3 on the mean annual driving distance per car (best<br />
guess)). European estimates (totals) tend to be the same for the short run, but slightly lower in<br />
the long-run (car kilometres with respect to fuel price, see Table 3.1). Car trips are likely to<br />
be less elastic in the long run (elasticity <strong>of</strong> –0.19).<br />
Much international research has been done on the <strong>effects</strong> <strong>of</strong> fuel prices on car stock. <strong>The</strong><br />
<strong>effects</strong> are likely to be modest and lower than the <strong>effects</strong> on fuel consumption. Several<br />
43
estimates are around –0.2, indicating a decrease <strong>of</strong> 2% in car ownership when fuel prices are<br />
increased by 10%. <strong>The</strong> <strong>effects</strong> are only significant in the long run; short-term elasticities are<br />
hardly available.<br />
Cross-fuel-price elasticities with respect to public transport use have been found in the<br />
literature. <strong>The</strong> international literature review by Goodwin (1992) contains evidence on the<br />
impact <strong>of</strong> petrol price on public transport demand (both short and long term and in terms <strong>of</strong><br />
traveller kilometres). <strong>The</strong> quoted elasticity <strong>of</strong> +0.34 is the mean <strong>of</strong> five results from three<br />
studies. European estimates from the TRACE project are considerably lower and range from<br />
+0.07 to +0.10 (see Table 3.1). <strong>The</strong> fuel price elasticity expressed in number <strong>of</strong> public<br />
transport trips is considerably higher in the short run: +0.33.<br />
Elasticities <strong>of</strong> annual charges<br />
<strong>The</strong> <strong>effects</strong> <strong>of</strong> annual charges on car stock, fuel consumption, etc., are less <strong>of</strong>ten studied than<br />
fuel price <strong>effects</strong> and mostly calculated only for the long term (since no short-run impact can<br />
be expected). Johansson and Schipper (1997) estimate the <strong>effects</strong> <strong>of</strong> a change in annual<br />
charges consisting <strong>of</strong> the purchase tax, the import fees, and the present value <strong>of</strong> the annual tax<br />
(on ownership) for a car (average age <strong>of</strong> the car is 15 with an interest rate <strong>of</strong> 6%). <strong>The</strong> longterm<br />
effect according to them (depending on the estimation technique) on the vehicle stock is<br />
about –0.06. In relation to fuel consumption, they found an elasticity <strong>of</strong> –0.11. Also<br />
interesting is the possibility <strong>of</strong> a positive impact <strong>of</strong> annual charges on the mean annual driving<br />
distance per car. This can be explained by the fact that fixed charges have little effect on the<br />
use <strong>of</strong> the vehicle. Some people argue that it may even encourage people to drive because<br />
they have already paid for it. <strong>The</strong> fixed car costs in the study <strong>of</strong> Geurs and van Wee (1997)<br />
consist <strong>of</strong> depreciation charges, insurance fees, <strong>road</strong> or car ownership tax and a part <strong>of</strong> the<br />
costs <strong>of</strong> repair and spare parts. <strong>The</strong>y found an elasticity <strong>of</strong> these annual charges <strong>of</strong> –0.1 on<br />
vehicle kilometres. Table 3.2 also shows that the effect <strong>of</strong> annual charges on the car stock, on<br />
car use and on fuel consumption is considerably lower than the effect <strong>of</strong> fuel taxation. This is<br />
due to the direct effect <strong>of</strong> fuel prices on fuel consumption and car use. <strong>The</strong> small effect <strong>of</strong><br />
annual charges on car stock can partly be explained by the lack <strong>of</strong> awareness <strong>of</strong> annual costs<br />
when the decision to own a car is made.<br />
Elasticities <strong>of</strong> vehicle kilometre charges<br />
Road <strong>pricing</strong> can take several forms, such as a cordon charge, a charge per kilometre, and a<br />
charge based on the level <strong>of</strong> congestion. <strong>The</strong> travel impacts depend on the price structure. <strong>The</strong><br />
consequences <strong>of</strong> <strong>road</strong> <strong>pricing</strong> schemes on car use can be expressed in elasticities <strong>of</strong> vehicle<br />
kilometre charges. <strong>The</strong>re are only a few recent studies which consider the impact <strong>of</strong> kilometre<br />
charges on car use. <strong>The</strong> European Commission has carried out a major survey on <strong>road</strong> <strong>pricing</strong><br />
elasticities (European Commission, 1996). <strong>The</strong> estimated elasticities consider the effect <strong>of</strong><br />
<strong>road</strong> <strong>pricing</strong> on car use, modal split, and route choice. <strong>The</strong> <strong>effects</strong> on car use depend on the<br />
purpose <strong>of</strong> the trip: shopping and social trips have the highest, commuter trips the lowest<br />
elasticities. <strong>The</strong> cross-price elasticities range from +0.05 to +0.4 and depend on the transport<br />
mode considered (rail or metro) and on the level <strong>of</strong> charge applied. It can be expected that<br />
kilometre charges have an effect on alternative routes chosen by travellers. An elasticity <strong>of</strong><br />
0.43 has been found in one city, namely Milan, but has not been included in Table 3.2 as it is<br />
unclear what this suggests. It may be that travelling on the supporting <strong>road</strong> network is<br />
increased (and results in more kilometres) but the explanation <strong>of</strong> this number is unknown.<br />
Nevertheless, the evasive reactions <strong>of</strong> car drivers are important and may reduce the overall<br />
impact <strong>of</strong> the measure.<br />
44
Geurs and van Wee (1997) report the results <strong>of</strong> a variable costs elasticity by using the FACTS<br />
model. <strong>The</strong>y simulate the <strong>effects</strong> <strong>of</strong> a kilometre charge by increasing the variable maintenance<br />
costs by 5 €cents per kilometre. This results in an elasticity <strong>of</strong> around –0,20.<br />
Elasticities <strong>of</strong> purchase taxes<br />
Elasticities <strong>of</strong> purchase taxes are difficult to find, but different studies have analysed the<br />
<strong>effects</strong> <strong>of</strong> car price on car use and car ownership. An increase <strong>of</strong> purchase tax is <strong>of</strong>ten equal to<br />
an increase <strong>of</strong> the price <strong>of</strong> the car, and therefore it may be expected that individuals react to a<br />
car price increase exactly in the same way as to an increase <strong>of</strong> purchase taxes. However, the<br />
car price affects the car stock in the long term much more than taxes do (INFRAS, 2000). It is<br />
interesting that the reactions (car use, fuel consumption) to car price changes seem to be<br />
rather significant in comparison with annual vehicle charges. This has to do with the<br />
definition <strong>of</strong> an elasticity. Annual vehicle taxes are just a small part <strong>of</strong> the annual capital costs<br />
<strong>of</strong> a vehicle, and thus it seems plausible that the corresponding elasticities differ in the<br />
reported manner.<br />
Table 3.1: European Travel Elasticities<br />
Term/<br />
Purpose<br />
Car-trips with<br />
respect to fuel<br />
price<br />
Car-kms with<br />
respect to fuel<br />
price<br />
Traveller kilometres Number <strong>of</strong> public<br />
by public transport transport trips<br />
with respect to fuel with respect to<br />
price<br />
fuel price<br />
Short-term:<br />
Commuting –0.20 –0.12<br />
Home based<br />
business<br />
–0.06 –0.02 0.17<br />
Non-home based –0.06<br />
business<br />
–0.02 0.17<br />
Education –0.22 –0.09<br />
Other –0.20 –0.20 0.48<br />
Total –0.16 –0.16 0.07 0.33<br />
Long term:<br />
Commuting –0.14 –0.23 0.26 0.12<br />
Home-based<br />
business<br />
–0.07 –0.20 0.03<br />
Non-home based –0.17<br />
business<br />
–0.26<br />
Education –0.40 –0.41 0.14<br />
Other –0.15 –0.29 0.07<br />
Total –0.19 –0.26 0.10 0.07<br />
Source: De Jong and Gunn (2001)<br />
45
Table 3.2: Selected price elasticities for changes <strong>of</strong> different charges<br />
Fuel price/taxes Annual charges Vehicle km charges Car price<br />
Effect on<br />
Short-term Long-term Shortterm<br />
Car stock -0.05 k<br />
-0.3 a<br />
-0.15/-0.41 b<br />
-0.2/-0.4 c<br />
-0.2 (-0.1) d<br />
-0.18/0.36 h<br />
-0.18/0.36 j<br />
Fuel consumption -0.27/-0.28 a<br />
-0.20/-0.25 g<br />
-0.26 l<br />
Car use (km) -0.16 a<br />
-0.10/-0.50 k<br />
-0.71/-0.84 a<br />
-0.702 f<br />
-0.54/-0.96 g<br />
-1/-0.4(-0.7) d<br />
-0.58 l<br />
-0.33 a<br />
-0.262 f<br />
-0.55/-0.05(-0.3) d<br />
Long-term Short-term Long-<br />
term<br />
-0.081 f<br />
-0.08/-0.04(-0.06) d<br />
-0.55 f<br />
-0.16/-0.02(-0.11) d<br />
-0.04/0.8 d<br />
-0.05/-0.15 h<br />
-0.1 k<br />
-0.17/-0.20 k<br />
-0.11/-<br />
0.20 k<br />
-0.1/-0.8 h<br />
-0.14/-0.22 k<br />
0.05/0.4 h<br />
Modal split 0.34 a (0.08/0.8)<br />
(public transport vehicle km’s)<br />
Source: INFRAS (2000), adjusted.<br />
a Goodwin (1992) average values <strong>of</strong> different international studies, all time periods and all travel purposes.<br />
b Hensher (1987, in Goodwin, 1992), no explicit distinction between short and long-term.<br />
c Tanner (1981-1983, in Goodwin (1992)), no explicit distinction between short and long-term<br />
d Johansson and Schipper (1997), in brackets= best guess; annual charges=taxation other than fuel (sum <strong>of</strong> purchase taxes and annual taxes).<br />
e Harbour (1987 in Goodwin (1992)), average <strong>of</strong> more than 90 estimates reviewed.<br />
f Storchmann (1998) as quoted in INFRAS (2000), <strong>effects</strong> <strong>of</strong> annual charges and annual depreciation on car stock and on fuel demand per capita.<br />
g Sterner et al. (1992).<br />
h European Commission (1996), elasticity depends on purpose <strong>of</strong> the trip, transport mode, level <strong>of</strong> <strong>road</strong> <strong>pricing</strong>.<br />
i Vaes (1982, as quoted in European Commission (1996))/Bland (1994, as quoted in European Commission (1996)).<br />
j Dargay (1998), elasticities for different income classes, differentiated in purchase costs and running costs (used as fuel price elasticity).<br />
k Geurs and van Wee (1997), overview <strong>of</strong> ranges <strong>of</strong> different price elasticities presented in the Dutch and the international literature.<br />
l Espey (1998), averages <strong>of</strong> 277 long-run price elasticity estimates for gasoline demand and <strong>of</strong> 363 short- or medium-run estimates.<br />
Short-term Long-term<br />
-0.38 i<br />
-0.89 e<br />
-0.253 f<br />
-0.77 i<br />
-0.6 i<br />
-0.28/-0.57 j<br />
-0.529 f<br />
-0.287 f<br />
46
Parking price elasticities<br />
Parking <strong>pricing</strong> means that motorists pay directly for using parking facilities. Parking <strong>pricing</strong><br />
may be implemented as a demand management strategy (to reduce vehicular traffic in an<br />
area), as a parking management strategy (to reduce parking problems in a particular location),<br />
to recover parking facility costs, to generate revenue for other purposes (such as a local<br />
transportation programme or downtown improvement district), or for a combination <strong>of</strong> these<br />
objectives. Most vehicle parking (especially in non-urban areas) is provided free or<br />
significantly subsidised. When parking is priced, there are <strong>of</strong>ten substantial discounts for<br />
long-term leases, and sometimes there is no hourly or daily rental option, leaving motorists<br />
with little financial incentive to use alternative modes part-time.<br />
Motorists appear to be sensitive to parking prices because they are such a direct charge.<br />
Compared with other out-<strong>of</strong>-pocket expenses, parking fees are found to have a greater effect<br />
on vehicle trips, typically by a factor <strong>of</strong> 1.5 to 2.0 (USEPA, 1998). Several studies (see VTPI,<br />
2002 for an overview) provide detailed reviews <strong>of</strong> parking price elasticities. <strong>The</strong>se studies<br />
indicate that the elasticity <strong>of</strong> parking is typically in the –0.1 to –0.3 range, with significant<br />
variation depending on demographic, geographic, mode choice and trip characteristics (which<br />
makes comparison difficult). De Jong et al. (1999) provide detailed estimates <strong>of</strong> the elasticity<br />
<strong>of</strong> various types <strong>of</strong> travel (car-trips, car-kilometres, transit travel, walking/cycling,<br />
commuting, business trips, etc.) with respect to parking price under various conditions (e.g.<br />
level <strong>of</strong> vehicle ownership and transit use, type <strong>of</strong> trip, etc.). <strong>The</strong> table below summarises<br />
long-term elasticities for relatively automobile-oriented urban regions. Table 3.3 can be used<br />
to obtain the following impacts in terms <strong>of</strong> trips and kilometres (<strong>of</strong> trips to destination zones<br />
with paid parking) after a 10% increase in the parking charge (total effect):<br />
• Car travel: –1.6% in the long run in terms <strong>of</strong> trips, –0.7% in terms <strong>of</strong> kilometres;<br />
• Car passengers (other persons in the car than the car driver): +0.3% (trips) and +0.2%<br />
(kilometres): this means that a parking cost increase will stimulate carpooling;<br />
• Public transport use will increase +0.2% (trips) and +0.1% (kilometres);<br />
• Slow modes (walking, cycling): +0.3% in terms <strong>of</strong> both trips and kilometres.<br />
Table 3.3 also shows the difference in sensitivity for the various purposes. Business travellers<br />
and educational trips tend to be less sensitive to price changes compared with other purposes.<br />
Table 3.3: Long term parking price elasticities<br />
Term/Purpose Car Car Public Slow Modes (walking<br />
Driver<br />
Trips<br />
Passenger Transport and cycling)<br />
Commuting –0.08 +0.02 +0.02 +0.02<br />
Business –0.02 +0.01 +0.01 +0.01<br />
Education –0.10 +0.00 +0.00 +0.00<br />
Other –0.30 +0.04 +0.04 +0.05<br />
Total<br />
Kilometres<br />
–0.16 +0.03 +0.02 +0.03<br />
Commuting –0.04 +0.01 +0.01 +0.02<br />
Business –0.03 +0.01 +0.00 +0.01<br />
Education –0.02 +0.00 +0.00 +0.00<br />
Other –0.15 +0.03 +0.02 +0.05<br />
Total –0.07 +0.02 +0.01 +0.03<br />
Source: De Jong et al. (1999)<br />
47
3.4.2 Results from some practical experiences worldwide<br />
For many years, the only example <strong>of</strong> congestion <strong>pricing</strong> was in Singapore. Today, there is<br />
more experience, coming from Norwegian toll cordons and express lanes in the U.S.<br />
Singapore and Orange County, for instance, are interesting and valuable examples <strong>of</strong><br />
situations where <strong>road</strong> <strong>pricing</strong> is actually implemented. We will briefly explain the schemes<br />
and discuss some interesting behavioural responses from these two schemes.<br />
In 1975 Singapore implemented the Area Licence scheme to restrict car ownership and car<br />
use. <strong>The</strong> size and the structure <strong>of</strong> the fee have changed over years. At first, the fee was only<br />
imposed during the morning peak, but in 1989 this was extended to include the afternoon<br />
peak. Public transport was exempted from the charge. Tolls were collected manually from the<br />
very beginning, but recently the tolls were automated and made more variable. <strong>The</strong> <strong>effects</strong> on<br />
traffic have been very significant. Of the commuters travelling to jobs in the restricted zone,<br />
the share commuting in cars with less than four passengers (carpools carrying four or more<br />
people were exempted until 1989) dropped from 48% to 27% during the first few months <strong>of</strong><br />
operation, while the combined modal shares <strong>of</strong> carpools and buses rose from 41% to 62%<br />
(Small and Gomez-Ibanez, 1998). Moreover, the number <strong>of</strong> vehicles <strong>of</strong> all types entering the<br />
zone during peak hours declined, while traffic rose during the half-hour period preceding the<br />
toll period. This shows that the congestion prices clearly affected the departure time choice <strong>of</strong><br />
car users.<br />
Recently (as <strong>of</strong> 1998), a method <strong>of</strong> shoulder <strong>pricing</strong> is used, which involves increasing the<br />
rate in steps every half an hour before the peak and decreasing it after the peak (with charges<br />
depending on vehicle type). It appears that traffic is quite sensitive to the <strong>road</strong> <strong>pricing</strong> system<br />
even though the charges are relatively low – the maximum rate for cars on expressways and to<br />
enter the restricted zone is comparable to a 1-hour parking fee in the city (about €1.50)<br />
(Olszewiski and Xie, 2005). <strong>The</strong> elasticity values shown in Table 3.4 indicate that time <strong>of</strong><br />
driving will change with time-dependent charges. Evening peak traffic flows show the highest<br />
demand sensitivity, with an elasticity <strong>of</strong> -0.32 for cars. <strong>The</strong> low figures for the morning peak<br />
can be explained by arrival time restrictions for commuters, whereas trips home in the<br />
evening can be postponed to avoid the high peak charge. This suggests that time <strong>of</strong> day<br />
charging may lead to considerable departure time and mode choice <strong>effects</strong>, but much depends<br />
on local situations (e.g. public transport availability).<br />
Table 3.4: Elasticities <strong>of</strong> traffic entering the restricted zone by time interval<br />
Time period Cars Other vehicles (motorcycles,<br />
taxis, LGVs, HGVs, buses)<br />
All vehicles<br />
7:30-9:30<br />
–0.106<br />
–0.019<br />
–0.069<br />
9:30-15:00<br />
–0.082<br />
–0.080<br />
–0.083<br />
15:30-17:30 –0.123<br />
–0.151<br />
–0.143<br />
17:30-19:00 –0.324<br />
–0.189<br />
–0.265<br />
7:30-19:00<br />
–0.123<br />
–0.106<br />
–0.118<br />
Source: Olszewski and Xie (2005)<br />
State Route 91 in Orange County (California) has 10 miles <strong>of</strong> express toll lanes, privately<br />
constructed and built, and funded by variable electronic tolls. <strong>The</strong>se tolls vary throughout the<br />
day in relation to demand and to congestion on the parallel freeway, ranging from $0.75 to<br />
$3.50 per trip. Users need to be registered customers and carry transponders. <strong>The</strong>re are<br />
discounted tolls for high-occupancy vehicles (3+). Field data collection included traffic<br />
measurements, vehicle occupancy counts, transit ridership data, and comprehensive travel<br />
surveys with current and former commuters. Data analysis included, inter alia, the time-<strong>of</strong>-<br />
48
day choices <strong>of</strong> commuters as well as vehicle occupancy. <strong>The</strong> express lane is located in what<br />
had been one <strong>of</strong> the most heavily congested freeway corridors <strong>of</strong> California, with typical peak<br />
period delays <strong>of</strong> 30-45 minutes before the project.<br />
It appeared that the traveller’s decision to use the toll lanes is very closely related to hour-byhour<br />
variations in traffic conditions (Sullivan, 2000). <strong>The</strong> analysis shows that peak period<br />
commuters on SR 91 value time at approximately $13-16 per hour, and that demand is<br />
moderately price-sensitive. New toll schedules implemented in 1997 introduce hour-by-hour<br />
toll differences in peak periods. As yet, the fairly small differences in these tolls have not<br />
been accompanied by much flattening <strong>of</strong> the peak period traffic distributions. Within three<br />
months after the opening, peak traffic observations showed a greater than 40% jump in high<br />
occupancy vehicles carrying three or more people. At that time, the lanes were free <strong>of</strong> charge.<br />
When carpool users were charged a 50% toll in January 1998, about a third (about 2000<br />
vehicles a day) <strong>of</strong> the HOV3+ traffic left the lanes.<br />
Models have been used to measure the responses to change in tolls. <strong>The</strong> price elasticity for<br />
use <strong>of</strong> the toll lanes during the 6-hour period <strong>of</strong> heaviest use (morning westbound or afternoon<br />
eastbound) is consistently about –0.7 to –0.8 based on response to uniform percentage toll<br />
changes. This indicates that a 10% across-the-board toll increase would result in about a 7%<br />
or 8% decrease in toll facility use. Table 3.5 shows the expected mode shifts from raising the<br />
tolls. It is shown that doubling all the tolls causes just 0.7% <strong>of</strong> all SOV vehicles to switch to<br />
other modes in the morning. This increases the number <strong>of</strong> higher-occupied vehicles.<br />
Responsiveness in the afternoon is slightly greater. <strong>The</strong>se calculations understate the true<br />
<strong>effects</strong> <strong>of</strong> a toll increase on vehicle demand because they do not include trip generation. Table<br />
3.6 shows that time-<strong>of</strong>-day shifts are small. Increasing the peak <strong>of</strong> the peak tolls (that is at 7-8<br />
a.m. and 5-6 p.m.) by 10%, results in overall shifts out <strong>of</strong> those time periods <strong>of</strong> just 0.5% in<br />
the morning and 0.74% in the afternoon. This illustrates the weak effect <strong>of</strong> imposing a charge<br />
on a paylane on total trips made on the whole <strong>road</strong>.<br />
Table 3.5: Estimated mode response to increase in all tolls on route 91 Express lanes<br />
Morning westbound<br />
SOV vehicles<br />
HOV2 vehicles<br />
HOV3+ vehicles<br />
Total vehicles<br />
Afternoon eastbound<br />
SOV vehicles<br />
HOV2 vehicles<br />
HOV3+ vehicles<br />
Total vehicles<br />
Source: Sullivan (2000)<br />
10% increase in<br />
tolls<br />
–0.09<br />
0.26<br />
0.55<br />
–0.05<br />
–0.11<br />
0.34<br />
0.8<br />
–0.06<br />
50% increase in<br />
tolls<br />
–0.4<br />
1.1<br />
2.47<br />
–0.2<br />
–0.47<br />
1.37<br />
3.54<br />
–0.24<br />
100% increase in<br />
tolls<br />
–0.7<br />
1.9<br />
4.39<br />
–0.35<br />
–0.77<br />
2.18<br />
6.09<br />
–0.4<br />
49
Table 3.6: Estimated time <strong>of</strong> day response to peak single hour toll increase on route 91<br />
Express lanes (in % change <strong>of</strong> total vehicle volumes)<br />
10% increase in 50% increase in 100% increase in<br />
peak <strong>of</strong> peak tolls peak <strong>of</strong> peak tolls peak <strong>of</strong> peak tolls<br />
Morning westbound<br />
4-5 a.m.<br />
0.12<br />
0.54<br />
0.97<br />
5-7 a.m.<br />
0.14<br />
0.64<br />
1.16<br />
7-8 a.m.<br />
–0.50<br />
–2.26<br />
–4.05<br />
8-9 a.m.<br />
0.12<br />
0.52<br />
0.93<br />
9-10 a.m.<br />
0.11<br />
0.50<br />
0.89<br />
peak period (5-9 a.m.)<br />
Afternoon eastbound<br />
–0.04<br />
–0.19<br />
–0.34<br />
2-3 p.m.<br />
0.21<br />
0.92<br />
1.60<br />
3-5 p.m.<br />
0.21<br />
0.93<br />
1.61<br />
5-6 p.m.<br />
–0.74<br />
–3.25<br />
–5.62<br />
6-7 p.m.<br />
0.23<br />
1.00<br />
1.73<br />
7-8 p.m.<br />
0.22<br />
0.98<br />
1.69<br />
peak period (3-7 p.m.)<br />
Source: Sullivan (2000)<br />
–0.06<br />
–0.24<br />
–0.47<br />
3.4.3 Overview<br />
On the basis <strong>of</strong> this overview, we can define the following important factors affecting price<br />
sensitivity:<br />
• Type <strong>of</strong> price change: the different types <strong>of</strong> <strong>pricing</strong> measures can have different impacts<br />
on travel behaviour. Parking charges and <strong>road</strong> tolls may affect travel routes and<br />
destinations. A time-variable fee probably shifts some trips to other times. Fuel price<br />
increases tend to affect the type <strong>of</strong> vehicles purchased more than vehicle usage;<br />
• Type <strong>of</strong> trip and traveller: De Jong and Gunn (2001) find, for instance, that commuting<br />
and business travel is less sensitive to changes in fuel prices than travel for other<br />
purposes;<br />
• Quality and price <strong>of</strong> alternatives (e.g. routes, modes, and destinations): price sensitivity<br />
tends to increase if alternative routes, modes and destinations are <strong>of</strong> good quality and<br />
affordable;<br />
• Price level: the results from variabilisation studies and some empirical case studies have<br />
shown that large price increases tend to have more effect;<br />
• Time period: we have seen that there is a difference between short-term and long-term<br />
price elasticities. Transportation elasticities tend to increase over time, as consumers have<br />
more opportunities to take prices into effect when making long-term decisions (Oum et<br />
al., 1992). Button (1993) reports that short-term elasticities are typically one-third <strong>of</strong> longterm<br />
elasticities. Dargay and Gately (1997) conclude that about 30% <strong>of</strong> the response to a<br />
price change takes place within 1 year, and that virtually all response takes place within<br />
13 years.<br />
Elasticities can provide indicative and useful answers to the questions about the effectiveness<br />
<strong>of</strong> policy measures. However, policy makers must realise the elasticity <strong>of</strong> some measure does<br />
not exist. Elasticities <strong>of</strong> travel demand will vary with circumstances and very much depend on<br />
the contexts. Relevant contexts include geographical scale <strong>of</strong> the study, the short-term or<br />
long-term, existing price levels and alternatives, and the composition <strong>of</strong> the population. <strong>The</strong><br />
types <strong>of</strong> change in travel times and costs might also be relevant (e.g. small or big change,<br />
increase or decrease, and gradual or drastic change). This makes it difficult to compare and<br />
interpret different elasticities. Comparison <strong>of</strong> elasticities only makes sense when there is a<br />
50
clear description <strong>of</strong> the dependent and independent variables (which price changes and what<br />
kind <strong>of</strong> demand are affected).<br />
3.5 Behavioural responses to <strong>road</strong> <strong>pricing</strong>: comparison <strong>of</strong> psychological<br />
and economic perspectives<br />
<strong>The</strong> previous sections have provided an overview <strong>of</strong> <strong>road</strong> <strong>pricing</strong> <strong>effects</strong> studied in the<br />
economic literature. It is now interesting to compare these findings with those <strong>of</strong> another<br />
discipline. Differences between disciplines in research methods and theoretical underpinnings<br />
may lead to considerable differences in <strong>effects</strong> and effect sizes. This section aims to give a<br />
brief review <strong>of</strong> the results from the (theoretical and empirical) psychology literature, and<br />
compare these with the previously discussed economic results. We include issues such as<br />
underlying theoretical concepts and methods used, as these may be relevant for explaining<br />
any differences. We begin with a discussion on the psychological results, followed by a<br />
comparative review identifying differences and similarities.<br />
3.5.1 Results from psychology<br />
Chapter 2 stated that economists use utility theory to explain the changes in transport<br />
behaviour. Psychologists look at the background <strong>of</strong> behavioural determinants, such as social<br />
norms and personal values, in addition to transport environmental pressures and opportunities.<br />
Variations in these determinants form the basis for people’s variations in price sensitivity (in<br />
both the short and the long term) and in their expected utility <strong>of</strong> adopting various transport<br />
alternatives. Moreover, characteristics <strong>of</strong> <strong>pricing</strong> measures (such as type <strong>of</strong> payment, level <strong>of</strong><br />
charge, push or pull measures) have also been identified as important.<br />
In psychological studies, the actual effectiveness <strong>of</strong> transport <strong>pricing</strong> policies in changing<br />
behaviour has hardly been examined. <strong>The</strong> focus is more on the identification <strong>of</strong> those personal<br />
(underlying) factors that affect or explain responses to <strong>pricing</strong> measures, such as abilities,<br />
motivations, and perceptions. First, we will discuss some theoretical concepts that<br />
psychologists use when trying to explain the <strong>effects</strong> <strong>of</strong> <strong>pricing</strong> on transport behaviour. This is<br />
followed by a brief overview <strong>of</strong> empirical studies in this field.<br />
Psychological factors affecting transport behaviour<br />
Psychological research explains behavioural responses by searching for factors that may<br />
explain people’s choices. <strong>The</strong> effectiveness <strong>of</strong> <strong>pricing</strong> policies to change people’s transport<br />
behaviour depends partly on individual characteristics. Different behavioural processes and<br />
determinants may underlie the choices that people make. <strong>The</strong> focus is on internal (personal)<br />
factors that affect behavioural responses. <strong>The</strong>se factors may explain if, why, and how<br />
financial incentives (such as <strong>pricing</strong> or subsidising) will result in behavioural changes. <strong>The</strong>y<br />
may also explain which behavioural processes might undermine the assumed effectiveness <strong>of</strong><br />
financial incentives. In the following we discuss two theories (the theory <strong>of</strong> planned<br />
behaviour and the norm activation model) and the role <strong>of</strong> habits to explain behaviour.<br />
According to the theory <strong>of</strong> planned behaviour (see Ajzen, 1991) people’s intentions drive<br />
behaviour. Attitudes, relevant subjective norms, and perceived behavioural control, all<br />
influence these intentions. <strong>The</strong> relevance <strong>of</strong> these three issues will subsequently be discussed.<br />
People have a stronger intention to exhibit behaviour that they evaluate favourably (positive<br />
attitude) than behaviour that they evaluate unfavourably (negative attitude). People’s attitudes<br />
may be affected by <strong>pricing</strong> policies, because attitudes are based on the weighing <strong>of</strong> the<br />
(perceived) costs and benefits <strong>of</strong> various alternatives. However, besides the financial costs <strong>of</strong><br />
various behavioural options, other aspects (such as comfort, travel time or congestion) <strong>of</strong> car<br />
driving may be important as well. In general, the attitude towards car driving is rather positive<br />
(e.g. Aarts, 1996; Steg, 1991).<br />
51
Subjective norms refer to people’s perception <strong>of</strong> the expectations and opinions <strong>of</strong> relevant<br />
others (e.g. friends or family). Social norms are especially influential when people are<br />
uncertain about which behaviour to perform. Since many people travel by car, car use may be<br />
seen as the social norm. In a situation where people tend to adapt their behaviour to this social<br />
norm, it is unlikely that <strong>pricing</strong> policies will affect people’s behaviour strongly. <strong>The</strong> concept<br />
<strong>of</strong> social comparison is also important in this context. People tend to compare their own<br />
opinions, abilities and performances with those <strong>of</strong> others (Festinger, 1954). People do not<br />
want to differ too much from others, but they do want to be a bit better. People also use cars<br />
to compare themselves with others (Steg et al., 2001). <strong>The</strong> car has become a status symbol<br />
(Slotegraaf et al., 1997). To the extent that people perceive cars as a status symbol, <strong>pricing</strong><br />
policies will not greatly affect transport behaviour. Pricing policies will probably generate<br />
resistance because they hinder people from expressing themselves socially.<br />
Perceived behavioural control refers to a person’s perception <strong>of</strong> the extent to which certain<br />
behaviour is within his or her control or is easy or difficult (Bamberg, 2002). Pricing policies<br />
will be less effective when people perceive behavioural changes as impossible (reflecting<br />
little personal control). If for example a rush-hour charge is introduced, and people perceive<br />
no possibilities to change their trip (e.g. because <strong>of</strong> fixed working hours), they are likely to<br />
pay the charge. Behavioural control refers to the actual and perceived opportunities that<br />
people have. For example, if people judge the quality <strong>of</strong> public transport unfavourably, public<br />
transport will not be perceived as a reasonable option, even though it might be a feasible<br />
alternative.<br />
According to the norm activation model <strong>of</strong> altruistic behaviour (Schwartz, 1977), behaviour is<br />
influenced by personal norms. Personal norms are self-expectations for specific actions in<br />
particular situations, as constructed by the individual (Schwartz, 1977). <strong>The</strong>y refer to a feeling<br />
<strong>of</strong> moral obligation to behave in a certain way. People feel guilty if they do not act in line<br />
with their personal norms. Because <strong>of</strong> this, personal norms may have a strong effect on<br />
behaviour.<br />
Personal norms depend on problem awareness and the ascription <strong>of</strong> responsibility. <strong>The</strong> first <strong>of</strong><br />
these factors is the extent to which people are aware <strong>of</strong> the negative consequences <strong>of</strong> their<br />
transport behaviour for others, e.g. congestion or CO2-emissions. If people are aware <strong>of</strong> the<br />
environmental consequences <strong>of</strong> transport, they are more likely to feel obliged to manifest<br />
behaviour consistent with these concerns (e.g. by purchasing a more energy-efficient car). <strong>The</strong><br />
importance <strong>of</strong> problem awareness in transport behaviour has also been stressed by other<br />
researchers (Garvill, 1999; Vlek et al., 1997). If people are more aware <strong>of</strong> the problems<br />
caused by transport, <strong>pricing</strong> policies aimed at reducing these problems, might be more<br />
effective. In that case, people better understand the long-term benefits that <strong>pricing</strong> policies are<br />
aiming for, such as less congestion or CO2-emissions. <strong>The</strong> second factor in Schwartz’s model<br />
(1977) is the ascription <strong>of</strong> responsibility. <strong>The</strong> more a person feels responsible for the negative<br />
consequences <strong>of</strong> a certain behaviour (e.g. congestion), the more he/she is likely to feel obliged<br />
to change this behaviour (e.g. plan a trip at another time <strong>of</strong> the day). <strong>The</strong> amount <strong>of</strong><br />
responsibility that someone feels depends on the number <strong>of</strong> people involved. <strong>The</strong> effect on<br />
congestion <strong>of</strong> one person giving up driving a car is negligible, which results in a low<br />
(experienced) responsibility for each individual.<br />
<strong>The</strong> cognitive capacity <strong>of</strong> people is limited. <strong>The</strong>refore, people use simplifying ways to<br />
facilitate decision making. One <strong>of</strong> these ways is to repeat choices that have satisfying<br />
outcomes. In other words, people form habits and subsequently rely on them. Previous<br />
decisions may have been based on careful deliberation <strong>of</strong> the advantages and disadvantages <strong>of</strong><br />
the behaviour, and on preferences (Aarts et al., 1997). Behaviour becomes automated when<br />
people no longer explicitly reason about its advantages and disadvantages and their<br />
preferences (the previously mentioned determinants <strong>of</strong> behaviour are no longer seriously<br />
52
considered). Even if (dis)advantages or circumstances change somewhat, people stick to their<br />
habits and will not change their behaviour as long as the outcomes remain satisfying (but may<br />
no longer be optimal). Transport behaviour is <strong>of</strong>ten habitual (see, e.g., Aarts and Dijksterhuis,<br />
2000). To change habitual behaviour by means <strong>of</strong> <strong>pricing</strong> policies, the amount <strong>of</strong> price change<br />
is important. It appears that a small price increase is hardly noticed by most people (Steg,<br />
1996). However, a large price increase does affect people’s behaviour (Linderh<strong>of</strong>, 2001),<br />
because the outcomes <strong>of</strong> their behaviour are no longer satisfying. A drastic price increase may<br />
cause a shock reaction, which may result in renewed reasoning about behaviour. However, the<br />
main reason for avoiding drastic price rises is that they are usually politically unacceptable<br />
(Steg, 2003).<br />
Empirical research<br />
It appears that little empirical psychological research is available on the effectiveness <strong>of</strong><br />
transport <strong>pricing</strong> policies. Most studies address the <strong>effects</strong> <strong>of</strong> <strong>pricing</strong> measures in general, and<br />
focus on their perceived effectiveness. <strong>The</strong>re are studies that deal with the <strong>effects</strong> <strong>of</strong> policy<br />
measures (including <strong>pricing</strong>) on transport behaviour. <strong>The</strong>se focus on car use and <strong>of</strong>ten<br />
distinguish between push and pull measures (e.g. Steg, 1996). Push measures are aimed at<br />
making car use or car ownership less attractive, whereas pull measures stimulate alternatives<br />
for car use. We will briefly describe the results from two empirical studies that explicitly<br />
addressed the effectiveness <strong>of</strong> transport <strong>pricing</strong>.<br />
<strong>The</strong> first study is by Cavalini et al. (1996), who examined the effectiveness <strong>of</strong> several<br />
transport policy measures (including financial measures) for private drivers, commuters, and<br />
business drivers, respectively. Almost 25% <strong>of</strong> the respondents indicated that they would be<br />
able to give up their car, but less than 10% were willing to do so. Although people were less<br />
willing to give up their car, the findings suggest that price measures, like doubling motor<br />
vehicle tax, would be more effective (self-reported) to reduce car ownership than other policy<br />
measures that try to restrain car use (such as information provision on the disadvantages <strong>of</strong><br />
the car). In particular, changes in type <strong>of</strong> car would result from organisational measures (e.g.<br />
the introduction <strong>of</strong> smaller cars with similar performance) and less from price measures<br />
(doubling tax on vehicle ownership, free public transport, and tax on heavy cars or subsidy on<br />
smaller cars). So, price measures do not seem the most effective way to influence the type <strong>of</strong><br />
car that people purchase. More than half <strong>of</strong> the people indicated that they would be able to<br />
reduce their number <strong>of</strong> kilometres driven. One third <strong>of</strong> the respondents indicated that they<br />
would actually do so if the included price measures (fuel-price increment and free public<br />
transport) were introduced. Trips made for business reasons appeared to be less sensitive than<br />
trips made for other purposes (private and commuting). Commuters and business drivers<br />
indicated that legal measures (such as staggered working hours and a ban on private car use<br />
during rush hours) would be most effective. All car users indicated that they were willing to<br />
change their travel route. This would best be accomplished by information measures (e.g. an<br />
electronic signpost system) and price measures (e.g. <strong>road</strong> <strong>pricing</strong>). Finally, people indicated<br />
that they were capable and willing to change their driving style. Legal and organisational<br />
measures (e.g. speed delimiter in car) were more effective in changing driving style than price<br />
measures (e.g. high fines for speed violations).<br />
<strong>The</strong> second study is by Jakobsson et al. (2002), who conducted a quasi-experimental study on<br />
the effectiveness <strong>of</strong> increasing costs per kilometre driven by car. Three groups were charged<br />
and compared with a control group. Respondents had to report behaviour in a log and<br />
payment (budgets) was fictitious. Each participant was <strong>of</strong>fered a sum <strong>of</strong> money necessary to<br />
cover expenses for the usual transport demand in a week. If their number <strong>of</strong> kilometres driven<br />
decreased they could keep the remaining amount <strong>of</strong> money, but if their kilometres driven<br />
increased they did not have to pay more money than the <strong>of</strong>fered sum. <strong>The</strong> general conclusion<br />
53
<strong>of</strong> this study was that even substantial economic disincentives are unlikely to result in any<br />
significant reduction in private car use in the short term. Reductions <strong>of</strong> car use were mainly<br />
due to a reduction both in the number <strong>of</strong> trips and in driving distance, in particular for<br />
shopping purposes.<br />
3.5.2 Comparison with economic findings<br />
We have discussed the findings from two different disciplines; it makes sense to compare<br />
them. Despite the relatively short description <strong>of</strong> the psychological approach and results, it is<br />
interesting to address issues such as the methods that are predominantly used, the underlying<br />
models or motivations for behaviour, and the anticipated effectiveness as shown by the<br />
research results.<br />
Table 3.7 provides an overview <strong>of</strong> concepts, methods, and behavioural dimensions studied by<br />
economists and psychologists. Where economists and traffic engineers use utility theory to<br />
explain these changes in transport behaviour, psychologists look at a b<strong>road</strong>er range <strong>of</strong><br />
behavioural determinants such as beliefs, attitudes, and social norms, in addition to transport<br />
environmental pressures and opportunities. Psychologists also assume that people do not<br />
always make rational choices: habits are important. Economists and engineers try to explain<br />
behaviour by looking more at observable and measurable factors.<br />
<strong>The</strong> disciplines also differ in the methods used to study behavioural responses. Economists<br />
study behavioural responses to <strong>pricing</strong> from both a theoretical and an empirical perspective.<br />
<strong>The</strong>oretical/conceptual models have been developed mainly to analyse the <strong>effects</strong> <strong>of</strong> prices on<br />
welfare (i.e. optimal versus second-best <strong>pricing</strong> policies). Empirical research (stated and<br />
revealed preference techniques) has been used to determine price sensitivity (in terms <strong>of</strong><br />
elasticities) <strong>of</strong> transport users. Engineers and economists use their models to forecast future<br />
situations. Psychologists do not apply modelling techniques: they rely more on individual<br />
questionnaires and quasi-experimental surveys to analyse the present situation.<br />
<strong>The</strong> range <strong>of</strong> responses that are studied varies considerably. Transport economists have<br />
probably studied many <strong>of</strong> the possible behavioural responses compared with psychologists.<br />
Psychologists have hardly (empirically) studied the <strong>effects</strong> <strong>of</strong> transport <strong>pricing</strong> policies. But<br />
when analysing the <strong>effects</strong> <strong>of</strong> <strong>road</strong> <strong>pricing</strong>, they mainly focus on the decision whether or not<br />
to own a car, and whether or not to use it.<br />
<strong>The</strong> relatively few psychological studies suggest that the effectiveness <strong>of</strong> transport <strong>pricing</strong><br />
may be low, although dependent on the type <strong>of</strong> measure and individual characteristics.<br />
Studies <strong>of</strong>ten focus on the use <strong>of</strong> the car and vehicle ownership, which may be those<br />
dimensions where the effect may be relatively small (compared, for instance, with trip timing,<br />
destination choice, etc.). In contrast, the economic discipline shows the potential effectiveness<br />
<strong>of</strong> <strong>road</strong> <strong>pricing</strong> measures. Economic (and traffic engineering) model outcomes, as well as<br />
empirical estimates show that <strong>road</strong> <strong>pricing</strong> may be rather effective and may result in<br />
(depending <strong>of</strong> the type <strong>of</strong> measure) considerable welfare gains. A possible explanation for this<br />
large effectiveness may be hidden in the concept <strong>of</strong> utility maximisation and the marginal<br />
costs and benefits <strong>of</strong> the use <strong>of</strong> a <strong>road</strong> that underlie economic models. Road <strong>pricing</strong> will<br />
increase the costs and affects those drivers who have a relatively low willingness to pay.<br />
Economic theory now assumes that these drivers will change behaviour and decide not to use<br />
the <strong>road</strong> anymore. Psychologists focus in general on the ‘average’ user, who is relatively less<br />
inclined to change. Moreover, economists and engineers tend to focus more strongly on those<br />
behavioural dimensions where adaptations are largest, such as departure time and route<br />
choice.<br />
Finally, the disciplines under study differ in terms <strong>of</strong> the social objectives that are typically<br />
considered. Economists focus on social welfare, whereas psychologists study the <strong>effects</strong> <strong>of</strong><br />
<strong>pricing</strong> measures in terms <strong>of</strong> changing behaviour and quality <strong>of</strong> life (this may be defined as<br />
54
the extent to which the important values and needs <strong>of</strong> people are fulfilled (see, e.g., Steg and<br />
Gifford, 2005). Note that there is a difference between the traffic engineering discipline and<br />
economics on this issue, because engineers are mainly interested in the <strong>effects</strong> that transport<br />
prices will have on the use <strong>of</strong> the transportation system. <strong>The</strong>y use relatively large network<br />
models compared with economists.<br />
Table 3.7: Comparison <strong>of</strong> research methods used to analyse behavioural responses to <strong>road</strong><br />
<strong>pricing</strong><br />
Economics/traffic engineers Psychology<br />
Underlying theoretical Utility maximisation <strong>The</strong>ory based on<br />
concepts<br />
behavioural determinants<br />
(e.g. attitudes, norms)<br />
Methods <strong>The</strong>oretical models,<br />
Stated preference,<br />
stated and revealed preference individual questionnaires,<br />
experimental surveys,<br />
theoretical reasoning<br />
Dimensions <strong>of</strong> behaviour Many (in theoretical models) Few (mainly car use and<br />
studied<br />
car ownership)<br />
Empirical research Considerable Limited<br />
Conclusions on effectiveness Possibly considerable Possibly low, depending on<br />
<strong>of</strong> <strong>pricing</strong><br />
type <strong>of</strong> measure and<br />
individual characteristics<br />
Social objectives typically Welfare maximisation/network Effectiveness and quality<br />
considered<br />
benefits<br />
<strong>of</strong> life<br />
3.6 Conclusions<br />
This chapter has dealt with the behavioural responses <strong>of</strong> transport users induced by transport<br />
prices. It is important to have an adequate overview <strong>of</strong> the literature on this issue before we<br />
begin our own empirical research. We did not restrict ourselves to the economic discipline –<br />
the results from psychology have also been briefly addressed. Both reviews and the<br />
comparison have resulted in the following important insights.<br />
Economists have paid considerable attention to the behavioural responses to transport <strong>pricing</strong>,<br />
theoretically as well as empirically. <strong>The</strong> empirical literature suggests that <strong>road</strong> <strong>pricing</strong> can be<br />
very effective, but much depends on the type <strong>of</strong> price measure. Parking charges and <strong>road</strong> tolls<br />
affect travel routes and destinations, while a time-dependent fee seems to have a considerable<br />
effect on the departure time <strong>of</strong> <strong>road</strong> users. Price sensitivity is also influenced by other factors<br />
such as the quality and price <strong>of</strong> alternative modes and destinations and the type <strong>of</strong> trip and<br />
traveller (e.g. business trips are relatively less elastic than social trips). <strong>The</strong> effectiveness <strong>of</strong><br />
<strong>pricing</strong> measures is also demonstrated by theoretical modelling: they can lead to large welfare<br />
gains. It appeared that different types <strong>of</strong> behaviour have been studied by using simulation<br />
models. Many types <strong>of</strong> models have been used to examine the key links between causes and<br />
<strong>effects</strong> in transport decision making either by the providers <strong>of</strong> transport services or by the<br />
users.<br />
While economists might be convinced about the effectiveness <strong>of</strong> <strong>road</strong> <strong>pricing</strong>, psychologists<br />
tend to be more sceptical. <strong>The</strong> psychology literature addresses the <strong>effects</strong> <strong>of</strong> <strong>pricing</strong>, but<br />
focuses on a smaller set <strong>of</strong> behavioural responses. It also has a different type <strong>of</strong> underlying<br />
theoretical concept: the background <strong>of</strong> behavioural determinants, such as basic needs, social<br />
norms, and personal values, is considered, in addition to transport environmental pressures<br />
and opportunities. Economists focus on utility maximising behaviour and try to forecast<br />
55
future situations. According to psychologists, the effectiveness <strong>of</strong> <strong>pricing</strong> measures depends<br />
not only on the characteristics <strong>of</strong> these measures, but also on individual aspects such as<br />
motivations, habits, and perceptions. A possible explanation for the difference in effectiveness<br />
may be hidden in the concept <strong>of</strong> utility maximisation and the marginal costs and benefits <strong>of</strong><br />
the use <strong>of</strong> a <strong>road</strong> that underlie economic models. Road <strong>pricing</strong> will increase the costs, and<br />
affects those drivers that have a relatively low willingness to pay. Economic theory now<br />
assumes that these drivers will change behaviour and decide not to use the <strong>road</strong> anymore.<br />
Psychologists focus in general on the ‘average’ user, who is relatively less inclined to change.<br />
Economists and engineers tend to focus more strongly on those behavioural dimensions where<br />
adaptations are largest, such as departure time and route choice.<br />
56
Chapter 4<br />
Valuing time, scheduling, and uncertainty: estimations<br />
from discrete choice modelling<br />
4.1 Introduction<br />
<strong>The</strong> previous chapter has shown the different behavioural consequences <strong>road</strong> <strong>pricing</strong> might<br />
have. It is now interesting to explore the potential responses <strong>of</strong> Dutch car drivers to relevant<br />
<strong>road</strong> <strong>pricing</strong> measures considered by policy makers to deal with traffic problems. A kilometre<br />
charge, possibly differentiated according to time, is such a relevant measure, at least in the<br />
Netherlands. Since we do not have revealed preference data available on the <strong>effects</strong> <strong>of</strong> such a<br />
measure, we decided to use a stated preference (SP) type <strong>of</strong> approach. <strong>The</strong> stated preference<br />
method is a general and widely applied method for measuring valuations and preferences, and<br />
for predicting choices between alternatives or goods, especially when it comes to hypothetical<br />
situations. A typical SP experiment confronts the respondent with the choice between two or<br />
more alternatives which differ in one or several aspects. By constructing the characteristics <strong>of</strong><br />
the alternatives in a judicious manner, the relative value <strong>of</strong> the variables can be measured<br />
through statistical analysis. Models can be estimated on the respondents’ choice data that<br />
incorporate the attributes <strong>of</strong> the alternatives, as well as contextual <strong>effects</strong> (external factors)<br />
that influence choices. <strong>The</strong> resulting models are not primarily used to predict demand but<br />
instead make it possible to find trade-<strong>of</strong>fs between paying and travelling under preferred<br />
conditions (in terms <strong>of</strong> specific attributes, e.g. departure time or travel time) versus paying<br />
less or nothing and facing less attractive travel conditions. <strong>The</strong> preferences (and hence the<br />
behavioural responses) <strong>of</strong> travellers can be determined including substitution rates between<br />
different parameters, which may be cost and time, for instance. This means that important<br />
concepts in transport, such as the value <strong>of</strong> time (VOT) <strong>of</strong> certain groups can be measured.<br />
Traditionally, value <strong>of</strong> travel time is considered to be one <strong>of</strong> the largest cost components in<br />
cost-benefit analysis <strong>of</strong> transportation projects, and the reduction <strong>of</strong> travel time is usually<br />
regarded as the main source <strong>of</strong> benefits that travellers receive from the improvement <strong>of</strong> a<br />
transport facility. However, when the seriousness <strong>of</strong> <strong>road</strong> congestion rises considerably, the<br />
reliability <strong>of</strong> travel time may be more important than the savings <strong>of</strong> travel time for the<br />
travellers, particularly when travellers have a schedule constraint. Several reliability-related<br />
components, such as standard deviation <strong>of</strong> travel time, have been considered in mode or route<br />
choice modelling. Numerous studies have shown the importance <strong>of</strong> these reliability factors in<br />
travellers’ choice behaviour, and in some cases reliability becomes an even higher value than<br />
travel time savings (see, e.g., Small et al., 1999; Lam and Small, 2001).<br />
Empirical studies on the monetary VOT are large in number and the results show<br />
convergence. However, the monetary value <strong>of</strong> uncertainty (VUNC) has been studied less<br />
<strong>of</strong>ten, and is therefore less certain, in particular for the Dutch situation. <strong>The</strong>re is also still a<br />
lack <strong>of</strong> a common definition and accurate measurement <strong>of</strong> reliability. Moreover, the model<br />
specifications <strong>of</strong> travellers’ responses to changes in reliability differ over studies. Our<br />
research contributes by providing useful new insights into relatively unknown concepts such<br />
as the value <strong>of</strong> scheduling costs (at least for the Dutch situation), by updating the value <strong>of</strong><br />
time for an important target group (i.e. commuters), and by providing insight into the<br />
valuation <strong>of</strong> uncertainty.<br />
In this chapter, we present outcomes from a stated choice experiment among Dutch car<br />
commuters who experience congestion on a regular basis. Respondents were <strong>of</strong>fered two<br />
different types <strong>of</strong> stated choice questions. <strong>The</strong> first four choice sets contained simple choice<br />
57
structures, <strong>of</strong> varying one single attribute and the cost term, enabling us to estimate interval<br />
values for time, schedule delay (late and early), and uncertainty (or reliability) for each<br />
individual. <strong>The</strong> second set <strong>of</strong> choice alternatives included more attributes, which were varied<br />
in a systematic way, and more choices that had to be made by the respondents (11 screens<br />
were shown). <strong>The</strong> data from both types <strong>of</strong> questions are different in nature and hence require a<br />
different type <strong>of</strong> analysis. We start with the more simple analysis <strong>of</strong> the interval estimates<br />
resulting from the first four choice sets. Next, we will analyse the second set <strong>of</strong> choice data by<br />
estimating different types <strong>of</strong> models. This allows us to compare estimates from both<br />
approaches.<br />
<strong>The</strong> aim <strong>of</strong> this study is tw<strong>of</strong>old. First, it is useful to derive (up-to-date) estimates <strong>of</strong> important<br />
transport concepts such as the VOT and VUNC for this particular group <strong>of</strong> car drivers who<br />
experience congestion. Since we obtain estimates at an individual level it is possible to<br />
include this parameter as an explanatory variable for other type <strong>of</strong> analyses (e.g. when<br />
explaining the level <strong>of</strong> effectiveness in Chapter 9). Secondly, we study the impact <strong>of</strong> the<br />
individual characteristics on these estimates. By allowing those trait variables to interact with<br />
travel time and reliability related attributes, we are able to assess the estimates for different<br />
groups <strong>of</strong> travellers.<br />
<strong>The</strong> remainder <strong>of</strong> this chapter is organised as follows. Section 4.2 describes the choice<br />
experiment and the data used in our empirical assessment. Section 4.3 presents the results<br />
from the first part <strong>of</strong> the stated choice experiment, the interval estimates. It includes a short<br />
statistical analysis in order to search for explanatory variables. Section 4.4 provides some<br />
background by discussing the theoretical framework <strong>of</strong> discrete choice analysis. <strong>The</strong><br />
estimated choice models will be presented in Section 4.5. Finally, Section 4.6 concludes.<br />
4.2 Data sources and survey description<br />
4.2.1 Data collection<br />
<strong>The</strong> data have been obtained by conducting an (interactive) computer-based survey among<br />
Dutch commuters. <strong>The</strong> questionnaire can roughly be divided into three parts. First, we asked<br />
for some socio-economic characteristics concerning the respondent (such as education and<br />
income). Next, the two stated choice experiments were presented to the respondents. And,<br />
finally, we asked for their opinion (on issues such as acceptance and effectiveness) about<br />
different types <strong>of</strong> <strong>road</strong> <strong>pricing</strong> measures. This chapter presents the data analysis <strong>of</strong> the stated<br />
choice experiments.<br />
<strong>The</strong> data collection was carried out by a specialised firm (NIPO), which has a panel <strong>of</strong> over<br />
50,000 respondents. Since the survey was aimed at respondents who use a car for their<br />
commuting journey and also experience congestion on a regular basis, we selected working<br />
respondents, who drive to work by car two or more times per week, and who experience<br />
congestion <strong>of</strong> 10 minutes or more at least two times a week. An initial analysis revealed that a<br />
random sample would result in a relatively low number <strong>of</strong> women and lower income groups.<br />
<strong>The</strong>refore, in order to investigate the role <strong>of</strong> income, it was decided to ‘over-sample’ the<br />
lower income groups and create an equal number <strong>of</strong> respondents over the various income<br />
classes. <strong>The</strong> final sample includes 1115 respondents. <strong>The</strong> data were collected during three<br />
weeks in June 2004.<br />
4.2.2 Survey<br />
As previously explained, the survey started with some general questions asking for important<br />
explanatory variables concerning the characteristics <strong>of</strong> the respondent (such as income,<br />
gender, and education). This provided us with a pr<strong>of</strong>ile <strong>of</strong> the Dutch commuter who<br />
experiences congestion. However, we should not forget that an Internet survey is used, which<br />
58
attracts younger people and respondents who are higher educated. Our sample indicates that<br />
most commuters are men (76%) and relatively highly educated (about 44% have a bachelor’s<br />
or higher degree). <strong>The</strong> characteristics <strong>of</strong> our database have been compared with the general<br />
pr<strong>of</strong>ile <strong>of</strong> the Dutch car driver facing congestion, in order to check representativeness.<br />
Research by Goudappel C<strong>of</strong>feng (1997) suggests that about 75% <strong>of</strong> all drivers in congestion<br />
are men (almost equal to our findings). Our sample includes more respondents aged between<br />
26 and 35 (about 10%), whereas the share <strong>of</strong> persons older than 45 years is lower (as<br />
expected). Moreover, drivers in congestion tend to have a high income and be higher educated<br />
(our sample includes more persons with bachelor’s and master’s degrees (8%) and less junior<br />
secondary general than the Goudappel survey). <strong>The</strong> effect <strong>of</strong> the “over-sampling” <strong>of</strong> lower<br />
income is clearly present. About 21% <strong>of</strong> the drivers in this sample have an income below<br />
€28,500, whereas only 8% drivers <strong>of</strong> the 1997 sample earned an income below the average <strong>of</strong><br />
that time.<br />
Each respondent was asked to distribute 10 (commuting) trips amongst four alternatives in the<br />
choice experiment. <strong>The</strong> attribute levels <strong>of</strong> the alternatives were based on the answers <strong>of</strong><br />
respondents about their current travel behaviour. In total, respondents are confronted with 15<br />
(4+11) screens in the experiment.<br />
<strong>The</strong> first four screens were simpler versions <strong>of</strong> the choice experiment, in which we only<br />
changed the <strong>road</strong> <strong>pricing</strong> fee and one other attribute (travel time, shift to earlier arrival time,<br />
shift to later arrival time, or uncertainty in travel time). <strong>The</strong>se choice questions were designed<br />
in such a way that we can infer interval estimates for individuals’ values <strong>of</strong> time (VOT),<br />
values <strong>of</strong> schedule delay early (VSDE), values <strong>of</strong> schedule delay late (VSDL), and values <strong>of</strong><br />
uncertainty (or reliability, VUNC) from the allocation <strong>of</strong> 10 trips over four alternatives. <strong>The</strong><br />
units for all parameter values are €/hour. <strong>The</strong> choice for a particular trip implies an interval in<br />
which VOT, VSDE, VSDL or VUNC must lie for that particular choice situation. <strong>The</strong> more<br />
concentrated the ten trips are allocated to a particular alternative, the less dispersed that<br />
individual’s VOT, VSDE, VSDL or VUNC apparently is. <strong>The</strong> design <strong>of</strong> the alternatives<br />
developed to derive the VOT estimate is then as follows.<br />
<strong>The</strong> VOT for car commuting trips in the Netherlands, as used by the Dutch government for<br />
2004, was about € 8.3 per hour (see AVV, 2006). Given this value, the following four<br />
intervals were identified:<br />
1. € 0 – 4<br />
2. € 4 – 8<br />
3. € 8 – 12<br />
4. > € 12<br />
In order to allocate responses to the above categories, a choice was <strong>of</strong>fered to the respondent<br />
as presented in Table 4.1.<br />
Table 4.1: Design <strong>of</strong> the first screen: four alternatives to estimate an individual’s VOT<br />
A<br />
B<br />
C<br />
D<br />
(group 4) (group 3) (group 2) (group 1)<br />
Departure time TD TD – 15 min. TD – 30 min. TD – 45 min.<br />
Travel time TF TF + 15 min. TF + 30 min. TF + 45 min.<br />
Arrival time TA TA TA TA<br />
Toll € 6 € 3 € 1 € 0<br />
Note: TD stands for the departure time, TA for the arrival time, and TF for the travel time.<br />
If the respondent chooses alternative C, we can infer that he is willing to pay € 1 to save 15<br />
minutes <strong>of</strong> travel time (C is preferred over D, implying a VOT <strong>of</strong> at least € 4 per hour), but<br />
not more than € 8 per hour (C is preferred over B, indicating that the respondent is not willing<br />
59
to pay € 2 to save 15 minutes). <strong>The</strong> calculation <strong>of</strong> the interval estimates based on the data will<br />
be explained in Section 4.3. We have developed scenarios to estimate the other parameters in<br />
a similar way: these can be found in Appendix 4a. Note that the simplicity <strong>of</strong> the design in<br />
Table 4.1 comes at a price: we are unable to study the question <strong>of</strong> whether the VOT (and<br />
other valuations) depends on the size <strong>of</strong> the travel time gain.<br />
<strong>The</strong> second part <strong>of</strong> the choice experiment consisted <strong>of</strong> 11 screens. This has been developed by<br />
the MD-PIT project consortium 3 . <strong>The</strong> design has 44 choice sets, but can be blocked into 4 sets<br />
<strong>of</strong> 11. Each respondent was assigned a block randomly, and the order <strong>of</strong> the 11 treatments in a<br />
block was randomised as well. <strong>The</strong> levels <strong>of</strong> attributes <strong>of</strong> the constructed alternatives are<br />
based on a fractional factorial design (orthogonal non-linear main <strong>effects</strong> design) using 4<br />
levels for 13 <strong>of</strong> the attributes and 2 levels for two <strong>of</strong> the attributes. <strong>The</strong> attributes are based on<br />
the current behaviour <strong>of</strong> respondents with the aim to design alternatives as close to the reality<br />
<strong>of</strong> the individual respondent as possible (see Appendix 4b for an example). Each <strong>of</strong> the<br />
attributes has a limited number <strong>of</strong> values (levels) and these levels are combined in a<br />
systematic way, such that each attribute is independent <strong>of</strong> one another. Each screen consists <strong>of</strong><br />
4 alternatives with separate attributes (alternative specific attributes, see Table 4.2). Three<br />
alternatives are car-specific; and the remaining alternative is always public transport (even in<br />
cases where the respondent indicated that there is no public transport alternative available; the<br />
choice sets concern hypothesised situations). <strong>The</strong> attribute levels are such that the first car<br />
alternative (A) is based on the preferred travel conditions <strong>of</strong> the respondent paying a relatively<br />
high price. Expected arrival times are relatively close to the preferred arrival time, a large part<br />
<strong>of</strong> the trip is free flow, and uncertainty margins are small compared to alternatives B and C.<br />
<strong>The</strong> other <strong>road</strong> possibilities (alternative B and C) have lower <strong>road</strong> <strong>pricing</strong> fees, but in return<br />
the travel conditions (in terms <strong>of</strong> arrival time, travel time, uncertainty and trip length (C)) are<br />
less attractive.<br />
Table 4.2: Design <strong>of</strong> the second part <strong>of</strong> the stated choice experiment (11 screens)<br />
Alternative Attribute Levels<br />
A: car (pay) Expected arrival time 4 (-10, -5, PAT, +5)<br />
Travel time<br />
4 (85% <strong>of</strong> trip length free flow, 90%, 95% and 100%)<br />
Uncertainty (max. delay) 4 (uncertainty margin * 0.2, 0.4, 0.6 and 0.8)<br />
Trip costs (fuel + charge) 4 (charge depends on distance, distance*0.08, 0.1, 0.12, and 0.14)<br />
B: car (change Expected arrival time 4 (-50, -30, -10, +10)<br />
departure time) Travel time<br />
4 (65% <strong>of</strong> trip length free flow, 70%, 75% and 80%)<br />
Uncertainty (max. delay) 4 (uncertainty margin * 0.8, 1, 1.2 and 1.4)<br />
Trip costs<br />
4 (charge depends on distance, distance * 0.03, 0.04, 0.05, and 0.06)<br />
C: car (change Expected arrival time 4 (-30, -20, -10, PAT)<br />
route)<br />
Travel time<br />
4 (55% <strong>of</strong> trip length free flow, 60%, 65% and 70%)<br />
Uncertainty (max. delay) 4 (uncertainty margin * 0.6, 0.8, 1, and 1.2)<br />
Trip costs<br />
4 (charge depends on distance, distance * 0, 0.01, 0.02, and 0.03)<br />
Trip length<br />
2 (distance * 1.2, and 1.4)<br />
D: public transport Arrival time<br />
4 (-30, -10, +10, +30 compared with PAT)<br />
(change mode) Travel time<br />
2 (based on reported travel time with public transport if available (if not:<br />
1.3 * mean car travel time), no change, and reported travel time * 1.2)<br />
Notes: PAT = preferred arrival time, travel time consists <strong>of</strong> a free flow and a congested part; uncertainty margin<br />
= difference between reported mean travel time and free flow travel time<br />
3<br />
<strong>The</strong> development was coordinated by the Technical University <strong>of</strong> Delft; for a detailed description <strong>of</strong> the<br />
experiment we refer to Amelsfort (2004).<br />
60
4.3 Analysis <strong>of</strong> interval estimates<br />
4.3.1 How to derive interval estimates<br />
<strong>The</strong> previous section described the interval values defined and the design <strong>of</strong> the first four<br />
screens. In order to calculate an average interval estimate for an individual, we need an<br />
expected value for each <strong>of</strong> the four intervals. It is not plausible to assume that the expected<br />
values are the exact middle points <strong>of</strong> their interval, and this is not even defined for the fourth<br />
interval. We therefore hypothesise that there is an underlying statistical distribution that can<br />
be fitted to the actual aggregated trip allocation over the intervals, and approximate the<br />
expected interval values based on this presumed distribution. We have chosen to use the<br />
Gamma distribution. This distribution has been chosen for pragmatic reasons (in particular<br />
because only two parameters have to be estimated) and its non-negativity which is appropriate<br />
here. Note that the distribution is used only to determine the expected value within each<br />
interval, not the expected value for the entire distribution. In order to find the parameters <strong>of</strong><br />
the best-fitting Gamma distribution, we have applied the ordinary least squares method over<br />
the pooled choice probabilities (finding the minimum difference between actual and simulated<br />
distribution).<br />
Table 4.3: Actual frequency <strong>of</strong> choices and the fitted Gamma distribution (parameters <strong>of</strong> the<br />
distribution in brackets)<br />
VOT € 0-4 € 4-8 € 8-12 > € 12 Total<br />
Actual probability 0.2 0.2 0.32 0.27 1.0<br />
Gamma distribution (2.0; 0.2) 0.19 0.28 0.22 0.31 1.0<br />
VSDE € 0-2 € 2-4 € 4-6 > € 6 Total<br />
Actual probability 0.27 0.2 0.27 0.25 1.0<br />
Gamma distribution (1.5; 0.32) 0.27 0.27 0.18 0.28 1.0<br />
VSDL € 0-8 € 8-16 € 16-24 > € 24 Total<br />
Actual probability 0.44 0.18 0.18 0.19 1.0<br />
Gamma distribution (1.0; 0.07) 0.43 0.24 0.14 0.19 1.0<br />
VUNC € 0-3 € 3-6 € 6-9 > € 9 Total<br />
Actual probability 0.36 0.24 0.26 0.14 1.0<br />
Gamma distribution (1.7; 0.31) 0.33 0.32 0.18 0.17 1.0<br />
Table 4.3 shows the frequencies <strong>of</strong> choices over the four intervals and the Gamma distribution<br />
that could be fitted to these observations. With the parameters estimated, the mean interval<br />
values can be determined. Note that the probabilities from the Gamma distribution may<br />
deviate from the observed probabilities. It is therefore important to emphasise that the Gamma<br />
distribution was only used to determine the expected values for each choice. Choice<br />
probabilities used in further calculations are the observed probabilities. It appeared that the<br />
distributions were (slightly) different for income, so that the mean interval value also depends<br />
on the income <strong>of</strong> the respondent. Table 4.4 presents the mean average values for VOT,<br />
VSDE, VSDL, and VUNC for the different income groups.<br />
61
Table 4.4: <strong>The</strong> expected values for VOT, VSDE, VSDL and VUNC, for each interval for the<br />
different income groups (€/hour)<br />
Income<br />
VOT VSDE VSDL VUNC<br />
(gross<br />
yearly)<br />
0-4 4-8 8-12 >12 0-2 2-4 4-6 >6 0-8 8-16 16-24 >24 0-3 3-6 6-9 >9<br />
€68,000 2.7 6.0 9.9 17.9 1.1 2.9 4.9 9.5 3.2 11.6 19.6 38.9 1.6 4.4 7.3 12.9<br />
It is now possible to determine an individual’s VOT as the weighted average <strong>of</strong> the intervals’<br />
expected values, where the individual’s weights are determined by the number <strong>of</strong> trips<br />
allocated to each interval. For instance, when a respondent with an income <strong>of</strong> less than<br />
€28,500 allocates 5 trips to B and 5 trips to C, a VOT estimate <strong>of</strong> 7.8 results<br />
((5*5.9+5*9.8)/10). <strong>The</strong> VSDE, VSDL, and VUNC have been estimated in a similar way,<br />
only the interval values and attribute values were different (see Appendix 4a for the screens<br />
and interval values). Note that the interval boundaries calculated in this way refer to average<br />
VOT, over discrete (non-marginal) travel time gains or losses. This is different from the<br />
conventional definition, which refers to the marginal rate <strong>of</strong> substitution between time and<br />
money.<br />
4.3.2 Results and statistical analysis<br />
Table 4.5 shows the mean values for the various estimates. <strong>The</strong> mean value <strong>of</strong> time is about<br />
€10, which is somewhat higher than the current value that is used in policy documents, <strong>of</strong><br />
about €8.3. <strong>The</strong> 95% confidence interval is between €9.6 and €10.1 which indicates that there<br />
is a significant difference. It is comparable to a recent (median) U.S. estimate <strong>of</strong> $11.9<br />
obtained from a stated preference experiment (Small et al. (2005)). <strong>The</strong> interval estimate <strong>of</strong><br />
the VSDE is considerably lower than the VSDL. This confirms the expectation that people<br />
normally prefer early arrivals over late arrivals. It is rather plausible that the VSDE is lower<br />
than the VOT; otherwise people prefer to stay in the car and drive around, over arriving early.<br />
<strong>The</strong> VUNC has a mean value <strong>of</strong> €5.4. It is difficult to compare this estimate with other<br />
international estimates, given the variety in definitions <strong>of</strong> uncertainty used (see Tseng et al.<br />
2005 for a meta-analysis on reliability ratio’s). AVV (2006) gives a reliability ratio<br />
(VOR/VOT) for the Netherlands <strong>of</strong> 0.8, we find a ratio <strong>of</strong> 0.6. In our case, uncertainty is<br />
measured in units <strong>of</strong> travel time (difference between the maximum and minimum travel time).<br />
It is evident that this ratio is different when the units <strong>of</strong> uncertainty are based on the standard<br />
deviation. <strong>The</strong> minimum and maximum values and the standard deviation shown in Table 4.5<br />
indicate the considerable level <strong>of</strong> variation (especially for the VSDL).<br />
<strong>The</strong> reported VUNC in Table 4.5 is derived from the scenario presented in Appendix 4a.<br />
Uncertainty involves a minimum and maximum arrival time, and hence a (equal) chance <strong>of</strong><br />
arriving earlier or later than the preferred arrival time. As a consequence, the value <strong>of</strong><br />
uncertainty implicitly includes scheduling costs. It therefore makes sense to distinguish<br />
between two different concepts <strong>of</strong> VUNC (with and without correction for expected<br />
scheduling costs), not only for conceptual reasons, but also for comparability with the stated<br />
choice experiment discussed in Section 4.4. We can calculate the pure VUNC (VUNC2 in<br />
Table 4.5) for each individual by reducing the present interval estimate (VUNC) with the<br />
estimated scheduling costs. For the calculation <strong>of</strong> these latter costs we use the individual<br />
VSDE and VSDL. <strong>The</strong> probability <strong>of</strong> arriving earlier is greater than the probability <strong>of</strong> arriving<br />
62
later, 0.75 versus 0.25. <strong>The</strong>se probabilities are multiplied by 0.5 since there is an equal chance<br />
<strong>of</strong> arriving at a certain time for both early and late schedules. So, the VSDE estimates are<br />
multiplied by 0.375, and the VSDL estimates by 0.125. Both costs are then the expected<br />
schedule costs for being late and early, which are deducted from the VUNC for each<br />
individual. <strong>The</strong> average equals 1.82, considerably lower than the VUNC estimate but positive.<br />
<strong>The</strong> minimum value shows that for some respondents the pure VUNC may actually be<br />
negative.<br />
Table 4.5: Descriptive statistics <strong>of</strong> interval estimates for VOT, VSDE, VSDL, and VUNC<br />
(€/hour)<br />
N Minimum Maximum Mean Std. Deviation<br />
VOT 1115 2.5 18.5 9.8 5.0<br />
VSDE 1115 1.1 9.6 4.7 2.8<br />
VSDL 1115 3.6 38.3 14.5 11.8<br />
VUNC 1115 1.7 12.8 5.4 3.3<br />
VUNC2 1115 -7.0 12.4 1.8 2.7<br />
It is then interesting to search for explanatory variables. Since we have information on the<br />
socio-economic characteristics <strong>of</strong> the respondent, it is possible to analyse its impact on the<br />
estimates. <strong>The</strong> literature indicates, for instance, that higher income people tend to have a<br />
higher VOT. Table 4.6 shows the estimates for four different income categories. <strong>The</strong> results<br />
are, however, somewhat ambiguous. As would be expected, the highest income group has the<br />
highest VOT, but the high estimate for the lowest income group is more difficult to explain.<br />
Table 4.6: <strong>The</strong> average values <strong>of</strong> the VOT, the VSDE, the VSDL, and the VUNC for the<br />
different income groups (€/hour)<br />
VOT VSDE VSDL VUNC<br />
€68.000 10.5 5.0 12.6 5.2<br />
<strong>The</strong> effect <strong>of</strong> income and other possibly important explanatory variables has been tested<br />
statistically. We conducted a regression analysis with the interval estimates as the dependent<br />
variable. Table 4.7 shows the results for the four regressions. Despite the very low overall fit<br />
<strong>of</strong> the models, the significance and sign <strong>of</strong> the coefficients give a tentative indication <strong>of</strong> the<br />
impact <strong>of</strong> the various variables. When we first look at income, the previous conclusion for<br />
VOT is confirmed: the impact is not significant (at the 10% level). This is not in line with<br />
previous Dutch findings (1998 estimations in Gunn, 2001). A possible explanation is that<br />
people with higher incomes can nowadays be more productive in the car, due to improved<br />
technical possibilities. Next, those with a very high VOT may already avoid congested times<br />
and are therefore not included in the sample. We hope to be careful with such explanations,<br />
however because the results in Table 4.11 below do show the expected pattern where VOT<br />
rises with income. <strong>The</strong> effect <strong>of</strong> income is only significant at this level for the respondents’<br />
VSDL (with a negative coefficient, which confirms the result <strong>of</strong> Table 4.6). Income and<br />
education (also negatively significant) may be correlated here. A possible explanation for the<br />
negative impact <strong>of</strong> education and income on VSDL is that lower-educated people more <strong>of</strong>ten<br />
have jobs with less flexible working hours.<br />
When we look at the results for VSDE, gender has a significant impact (at the 10% level),<br />
with females having a higher VSDE than male respondents. Respondents who are higher<br />
63
educated tend to have a lower VSDE. <strong>The</strong> explanation may be the same as for VSDL. <strong>The</strong><br />
impact <strong>of</strong> travel-cost compensation by the employer (higher VOT and VSDE for respondents<br />
who are fully compensated) may be explained by the respondents’ assumption that their<br />
employer will also pay for future toll costs. <strong>The</strong> number <strong>of</strong> working hours during a week does<br />
not have an impact on any <strong>of</strong> the dependent variables. <strong>The</strong> composition <strong>of</strong> the household may<br />
have an impact on the different concepts discussed here. Table 4.7 shows, however, that the<br />
impact is rather marginal. Single-person households with children are likely to have a higher<br />
VOT, families without children tend to have a higher VSDE, while single-person households<br />
seem to have a lower VUNC than other type <strong>of</strong> households.<br />
It seems that the variation in the estimations is much more caused by non-observable factors<br />
than the observed factors that have been included in the regressions. This is confirmed by the<br />
very low overall fit.<br />
Table 4.7: Regression results for VOT, VSDE, VSDL, and VUNC<br />
VOT VSDE VSDL VUNC<br />
B t stat. B t stat. B t stat. B t. stat<br />
Constant<br />
Gender (dummy, female=1)<br />
Education<br />
Gross yearly income<br />
Cost comp1 (dummy)<br />
Cost comp2 (dummy)<br />
Household comp1 (dummy)<br />
Household comp2 (dummy)<br />
Household comp3 (dummy)<br />
Working hours a week<br />
8.90<br />
.517<br />
-.156<br />
.095<br />
-.791<br />
-.657<br />
-.029<br />
2.072<br />
.521<br />
.038<br />
8.9***<br />
1.3<br />
-1.5<br />
1.6<br />
-1.6<br />
-2.0**<br />
-.07<br />
2.3**<br />
1.5<br />
.31<br />
4.013<br />
.427<br />
.-.137<br />
.055<br />
-.111<br />
-.370<br />
.174<br />
.574<br />
.348<br />
.086<br />
6.9***<br />
1.8*<br />
-2.3**<br />
1.6<br />
-.38<br />
-1.9**<br />
.69<br />
1.1<br />
1.8*<br />
1.2<br />
25.17<br />
.236<br />
-.933<br />
-.478<br />
2.293<br />
.092<br />
-1.773<br />
-.543<br />
1.263<br />
.161<br />
9.6***<br />
.22<br />
-3.4***<br />
-3.1***<br />
1.7*<br />
.11<br />
-1.6<br />
-.23<br />
1.4<br />
.49<br />
7.258<br />
.355<br />
-.164<br />
-.068<br />
-.134<br />
7.04E-05<br />
-.609<br />
-.156<br />
.170<br />
-.073<br />
R square .017 .018 .040 .016<br />
Notes: Cost comp1: respondents receive no compensation from employer, cost comp2: respondents are partly<br />
compensated, cost comp3 respondents are fully compensated by employer; household composition1 = single,<br />
household 2 = single with child, household 3 = couple without children, household 4 = couple with child(ren).<br />
Significance is indicated by ***, **, and *, referring to significance at the 99%, 95%, and 90% levels,<br />
respectively.<br />
4.4 Stated choice experiment: theoretical framework<br />
10.3***<br />
1.2<br />
-2.2**<br />
-1.6<br />
.38<br />
.00<br />
-1.9**<br />
-.24<br />
.71<br />
-.82<br />
4.4.1 Discrete choice models<br />
<strong>The</strong> individual traveller’s choice behaviour is commonly analysed using discrete choice<br />
models (e.g. Ben-Akiva and Lerman, 1987). Most models used in practice are based on<br />
random utility theory (RUT), which assumes that the individual’s preference/taste can be<br />
described by a deterministic (systematic) part <strong>of</strong> utility, V ij , and a stochastic component, ε ij .<br />
<strong>The</strong> conventional random utility specification in the case <strong>of</strong> respondent i choosing among J<br />
alternatives is expressed in Eq. (1).<br />
U ( choice j for individual i)<br />
= U ij = Vij<br />
+ ε ij , j = 1,...,<br />
J.<br />
(1)<br />
<strong>The</strong> systematic component is assumed to be the part <strong>of</strong> utility contributed by attributes that<br />
can be observed by researchers, while the random component is the part <strong>of</strong> utility contributed<br />
by attributes unobserved by researchers. <strong>The</strong> observed part <strong>of</strong> systematic utility V ij is a<br />
function <strong>of</strong> attributes in the alternative and characteristics <strong>of</strong> the decision maker. A linear<br />
function, which is specified by a vector <strong>of</strong> the decision maker’s taste β , can be denoted<br />
K<br />
as Vij = ∑ β k X ijk in the case <strong>of</strong> generic parameters (Ben-Akiva and Lerman, 1987). Utility<br />
= 1<br />
k<br />
64
maximisation theory assumes that an individual chooses the alternative that yields the highest<br />
utility level.<br />
<strong>The</strong> empirical specification <strong>of</strong> V ij is crucial to modelling the individual’s choice behaviour<br />
because the utility function not only reflects the individual’s decision-making process given<br />
the socio-economic environment, but also determines the predictive capability <strong>of</strong> the choice<br />
model.<br />
In making the choice model operational, the random terms (unobserved by the analysts), also<br />
play a crucial role. Different assumptions on the joint distribution <strong>of</strong> random terms in the<br />
utility function result in different models. <strong>The</strong> most extensively used model in transportation<br />
studies is the Multinomial Logit (MNL) model, which assumes that the random terms are<br />
independently and identically distributed according to an extreme value type I distribution.<br />
Under these assumptions, the choice probability for respondent i to choose alternative j<br />
becomes:<br />
exp( Vij<br />
)<br />
Pr obij<br />
= (2)<br />
J<br />
∑ exp( V<br />
l=<br />
1 ij )<br />
<strong>The</strong> above assumption is most restrictive in that it does not allow for the error components <strong>of</strong><br />
different alternatives to be correlated. However, in a situation <strong>of</strong> repeated choices by<br />
individuals this is not the case. For each choice situation n, the specification then becomes:<br />
U = V + ε , with (3)<br />
ijn<br />
ijn<br />
K<br />
∑<br />
k = 1<br />
V = β X<br />
ijn<br />
k<br />
ijn<br />
ijnk<br />
This model can be solved using a maximum likelihood estimation method. <strong>The</strong> log likelihood<br />
function is given as:<br />
I<br />
J<br />
N<br />
∑∑∑<br />
log L = d log Pr ob<br />
(4)<br />
i=<br />
1 j=<br />
1 n=<br />
1<br />
ijn<br />
ijn<br />
In this present study, the dependent variable is the choice proportions allocated among four<br />
alternatives. Thus, d ijn is defined as the choice proportion distributed by respondent i to<br />
alternative j in each choice n, and we have ∑ d = 1<br />
j ijn under each choice pr<strong>of</strong>ile (Greene,<br />
1993). <strong>The</strong> respondent makes several choices in 11 choice situations.<br />
4.4.2 Choice model specification<br />
Apart from travel time and travel-cost elements, scheduling (trip-timing) convenience is also<br />
found to be one <strong>of</strong> the important determinants <strong>of</strong> commuters’ travel behaviour. Utility<br />
functions with explicit scheduling delay costs specification (see, e.g., Small (1982);<br />
Hendrickson and Plank (1984); Wilson (1989); Chin (1990)) have been tested extensively in<br />
modelling travellers’ route/mode and departure time choices.<br />
Small (1982) introduced the schedule delay (SD) variable to measure the difference between<br />
the traveler’s actual arrival time and preferred arrival time (PAT). Since people may value<br />
early and late arrivals differently due to their different consequences, the SD variable can be<br />
evaluated as two separate terms, schedule delay early (SDE) and schedule delay late (SDL).<br />
SDE is defined as the amount <strong>of</strong> time arriving earlier at the destination than the PAT, while<br />
SDL is the amount <strong>of</strong> time arriving later than the PAT. This gives the relationship in the<br />
utility expression (V) as follows:<br />
V = β T ⋅T<br />
+ β C ⋅C<br />
+ β E ⋅ SDE + β L ⋅ SDL + θ ⋅ DL<br />
, (5)<br />
where T denotes the travel time, and C gives the travel cost. Travel cost may include fuel cost<br />
and/or toll cost. SDE is defined as Max(0, PAT minus actual arrival time), SDL is defined as<br />
65
Max(0, actual arrival time minus PAT); and D L is the lateness dummy, which is equal to 1<br />
when SDL ≥ 0 , and 0 otherwise. <strong>The</strong> coefficients <strong>of</strong> β and θ measure the marginal disutilities<br />
<strong>of</strong> being early and late, while θ represents a fixed penalty for late arrival. Since C, T, SDE<br />
and SDL are disutilities, the coefficients are assumed to be negative. Small’s (1982) empirical<br />
finding is that | β L | > | βT<br />
| > | β E | , which means that people prefer early arrival to additional<br />
travel time, and prefer additional travel time to late arrival (similar to the findings in Section<br />
4.3 above).<br />
<strong>The</strong> model proposed by Noland and Small in 1995 extended Small’s 1982 trip-scheduling<br />
model (see Eq.(5)) by considering the probability distribution <strong>of</strong> travel time and adding an<br />
additional random component depicting the uncertainty effect, that is, apart from the<br />
scheduling constraint. <strong>The</strong> result is presented as Eq.(6), this is called Maximum Expected<br />
Utility (MEU) theory.<br />
E( U ) = β T ⋅ E(<br />
T ) + β C ⋅C<br />
+ β E ⋅ E(<br />
SDE)<br />
+ β L ⋅ E(<br />
SDL)<br />
+ θ ⋅ PL<br />
(6)<br />
where E (T ) is the expected travel time; E (SDE)<br />
is the expected schedule delay early;<br />
E (SDL)<br />
is the expected schedule delay late, and PL ≡ E(<br />
DL<br />
) is the expected lateness. Note<br />
that, with a random arrival time, expected schedule delay early and late can both be positive<br />
when the expected arrival time is at the PAT.<br />
Once the model is estimated, it is possible to derive the marginal rate <strong>of</strong> substitution between<br />
any pair <strong>of</strong> the attributes in the bundle. Obtaining such measures is a common objective in the<br />
use <strong>of</strong> discrete choice models. For example, the monetary value <strong>of</strong> travel time (VOT), an<br />
important economic indicator in transportation studies, is defined as the marginal substitution<br />
rate between travel time and costs, and, hence, as the ratio <strong>of</strong> the respective coefficients (see<br />
Eq.(7)). It is important to define the cost component. A VOT based on toll costs is typically<br />
different from one based on fuel costs, given a difference in attitude <strong>of</strong> respondents.<br />
∂U<br />
/ ∂T<br />
βT<br />
VOT = =<br />
(7)<br />
∂U<br />
/ ∂C<br />
βC<br />
Similarly, the VSDE, VSDL, and VUNC can be derived.<br />
4.5 Estimation results <strong>of</strong> stated choice experiment (SCE) data<br />
<strong>The</strong> previous section described the basics <strong>of</strong> maximum likelihood estimation <strong>of</strong> the utility<br />
parameters <strong>of</strong> one discrete choice model: the MNL model. This section discusses the<br />
application to our data. We study the trade-<strong>of</strong>fs between paying and travelling under preferred<br />
conditions versus paying less and facing less attractive travel conditions in terms <strong>of</strong> departure<br />
time, uncertainty, route length, travel time, and mode <strong>of</strong> transport. We have estimated various<br />
specifications <strong>of</strong> this choice model, and will only present those estimates that have a clear<br />
interpretation. First, the basic model is outlined, including the resulting estimates <strong>of</strong> VOT,<br />
VSDE, VSDL, and VUNC. Next, we will include heterogeneity into the estimation <strong>of</strong> the<br />
models.<br />
4.5.1 <strong>The</strong> basic multinomial logit (MNL) model<br />
As a starting point, we analyse the respondents’ overall trade-<strong>of</strong>fs for mean travel time,<br />
uncertainty <strong>of</strong> travel time, and travel cost. This is similar to the ‘mean-variance’ modelling<br />
approach proposed by Jackson and Jucker (1981), where travellers were supposed to make a<br />
trade-<strong>of</strong>f between mean travel time and variance <strong>of</strong> travel time. This gives estimates <strong>of</strong> how<br />
people evaluate travel time and uncertainty with respect to the monetary cost. <strong>The</strong> choice<br />
experiment included three different car alternatives and one public transport alternative. It<br />
makes sense to assume that all car alternatives have the same parameters. This is not the case<br />
for the public transport alternative compared with the car alternative. <strong>The</strong>refore, we have<br />
66
defined two utility expressions: one for the car alternatives, and one for public transport. <strong>The</strong><br />
utility expressions <strong>of</strong> car ( V C ) and public transport modes ( V PT ) are given by:<br />
= β C ⋅C<br />
+ βT<br />
⋅ E[<br />
T ] + β ⋅UNC<br />
+ EDT + VEDT + VVEDT<br />
= ASC + β ⋅C<br />
+ β ⋅ E[<br />
T ] + EDT + VEDT + VVEDT<br />
(8)<br />
VCAR UNC<br />
VPT PT C<br />
T<br />
where C is the travel cost (in our experiment consisting <strong>of</strong> both fuel and toll costs for the car, and<br />
ticket price for public transport); E[T] is the mean travel time, and UNC is the amount <strong>of</strong><br />
uncertain travel time 4 . ASC PT is the alternative specific constant <strong>of</strong> public transport, added to<br />
capture the effect <strong>of</strong> respondents’ difference in preference for car or public transport. Our<br />
experiment also involves different departure time conditions implied by different mode and route<br />
alternatives. <strong>The</strong>refore, we specify a set <strong>of</strong> dummy variables, EDT, VEDT, and VVEDT, to<br />
explain the utility difference incurred by chosen different departure time slots. EDT denotes the<br />
dummy for ‘early departure’, and captures the disutility when the respondent’s departure time is<br />
30 to 60 minutes earlier than his/her preferred departure time (PDT); VEDT is the dummy <strong>of</strong><br />
‘very early departure’, accounting for the disutility when the respondent’s departure time is 60-<br />
90 minutes earlier than his/her PDT; and VVEDT gives the ‘very very early departure’ dummy<br />
when the departure time is more than 90 minutes earlier than the PDT. Here, we use <strong>effects</strong><br />
coding for the early departure variables <strong>of</strong> EDT, VEDT, and VVEDT. This implies that, instead<br />
<strong>of</strong> coding the base level 5 0 across the newly created variables, the base level is -1 across each <strong>of</strong><br />
these new variables. Since the basis is different between ASC and the early departure variables,<br />
we are able to distinguish the estimated ASC and the value <strong>of</strong> these early departure variables 6 .<br />
Next, we estimate a more complete model incorporating the scheduling variables based on<br />
Eq.(6). This model illustrates that the individual accounts for the following attributes in their<br />
decision making: travel cost, C; mean travel time E[T]; expected schedule delay early,<br />
E[SDE]; expected schedule delay late, E[SDL]; probability <strong>of</strong> arriving later than the preferred<br />
arrival time, PL 7 ; and amount <strong>of</strong> uncertain travel time (UNC). We include both schedule delay<br />
early and early departure time. <strong>The</strong> early departure "dummies" capture the extra penalty that<br />
travelers depart too earlier than their (reported) preferred departure time, which differs over<br />
respondents. <strong>The</strong>se are dummy (discrete) variables (and not time unites as is the case with<br />
schedule delay); correlation between travel time, early departure time and schedule delay is<br />
therefore not much <strong>of</strong> an issue.<br />
<strong>The</strong> generic indirect utility functions <strong>of</strong> car ( V CAR ) and public transport modes ( V PT ) are given<br />
as follows:<br />
VCAR L<br />
UNC<br />
= β C ⋅C<br />
+ βT<br />
⋅ E[<br />
T ] + β SDE ⋅ E[<br />
SDE]<br />
+ β SDL ⋅ E[<br />
SDL]<br />
+ β P<br />
+ EDT + VEDT + VVEDT<br />
⋅ PL<br />
+ β ⋅UNC<br />
= ASC + β ⋅C<br />
+ β ⋅ E[<br />
T ] + β ⋅ E[<br />
SDE]<br />
+ β ⋅ E[<br />
SDL]<br />
+ β ⋅ P<br />
VPT PT C<br />
T<br />
SDE<br />
SDL<br />
PL<br />
L<br />
+ EDT + VEDT + VVEDT<br />
4<br />
<strong>The</strong> mean travel time is defined as the ‘mean value <strong>of</strong> minimum and maximum total travel time in the choice<br />
experiment’, while uncertainty is the ‘difference between maximum and minimum total travel time’.<br />
5<br />
<strong>The</strong> base level <strong>of</strong> early departure variables is set as: the departure time is less than 30 minutes earlier than the<br />
PDT.<br />
6<br />
Interpreting the parameters with <strong>effects</strong> coding is different from doing so with dummy coding because the base<br />
level <strong>of</strong> effect coding variables is no longer zero. <strong>The</strong> positive coefficient for EDT can still be interpreted as a<br />
disutility.<br />
7<br />
<strong>The</strong> computation <strong>of</strong> E[SDE], E[SDL], and PL is given in Appendix 4c.<br />
(9)<br />
67
Uncertainty <strong>of</strong> travel time is also included as an independent variable in this model. However,<br />
it is likely to be <strong>of</strong> limited relevance, since most <strong>of</strong> the uncertainty <strong>effects</strong> are captured by<br />
E(SDE), E(SDL), and PL (recall the discussion about VUNC and VUNC2 in Section 4.3).<br />
<strong>The</strong> first two columns <strong>of</strong> Table 4.8 show the MNL estimates <strong>of</strong> the mean-variance modelling<br />
and the trip-scheduling modelling approach. <strong>The</strong> unit <strong>of</strong> all time-related attributes is in<br />
minutes, and travel cost is in euros. A general finding obtained from these two models is the<br />
negative sign for the alternative specific public transport coefficient. This suggests that, in<br />
general, respondents prefer the car over the public transport alternative, because the ASC<br />
represents individuals’ taste in choosing that alternative. A possible explanation for this<br />
phenomenon is that the sample consists <strong>of</strong> car users, who implicitly have a preference for the<br />
car. Shifting departure time to earlier time periods is less preferred for all models.<br />
Table 4.8: Estimation results <strong>of</strong> the basic models for SCE data<br />
Explanatory variables Model 1 Model 2 Model 3 Model 4 Model 5<br />
ASC <strong>of</strong> public transport alternative -1.07*** -0.77*** -0.78*** -0.78*** -0.75***<br />
A_PT (-22.0) (-14.8) (-7.8) (-14.9) (-8.2)<br />
Travel cost -0.09*** -0.09*** -0.09*** -0.09*** -0.09***<br />
C (-16.7) (-16.5) (-16.6) (-16.5) (-16.5)<br />
Mean travel time E[T] -0.01*** -0.01*** -0.01*** -0.01*** -0.01***<br />
E[T] (-11.5) (-9.6) (-8.9) (-9.6) (-8.8)<br />
E[T]*Public transport dummy -0.002** -0.002**<br />
E[T]*PT (-2.2) (-2.1)<br />
Expected schedule delay early -0.02*** -0.02*** -0.008<br />
E[SDE] (-8.6) (-8.7) (-1.2)<br />
Expected schedule delay early squared<br />
E[(SDE)<br />
-0.0002* -0.0004***<br />
2 ] (-1.6) (-8.6)<br />
E[SDE]*Public transport dummy 0.009**<br />
E[SDE]*PT (2.4)<br />
Expected schedule delay early<br />
0.0003**<br />
squared*public transport dummy<br />
E[(SDE) 2 ]*PT (2.3)<br />
Expected schedule delay late -0.02*** -0.02*** -0.02*** -0.02***<br />
E[SDL] (-9.4) (-9.2) (-5.6) (-9.6)<br />
Expected schedule delay late squared<br />
E[(SDL)<br />
0.0001<br />
2 ] (0.97)<br />
E[SDL]*Public transport dummy 0.01** 0.009**<br />
E[SDL]*PT (2.5) (2.5)<br />
Probability <strong>of</strong> late arrival (later than PAT) -0.09* -0.07 0.007 0.05<br />
PL (-1.9) (-1.4) (0.1) (1.3)<br />
Uncertainty -0.007*** 0.002 0.001 0.002 0.002<br />
UNC (-5.2) (1.3) (1.0) (1.1) (1.1)<br />
Dummy for departing 30-59 min earlier than<br />
preferred departure time (PDT)<br />
0.34*** 0.29*** 0.29*** 0.28*** 0.28***<br />
EDT (12.1) (8.9) (8.7) (8.5) (8.2)<br />
Dummy for departing 60-89 min earlier than<br />
-0.21*** -0.14*** -0.15*** -0.13*** -0.14***<br />
PDT<br />
VEDT (-6.4) (-3.7) (-3.8) (-3.6) (-3.8)<br />
Dummy for departing more than 90 min PDT -0.53*** -0.52*** -0.51*** -0.52*** -0.53<br />
VVEDT (-7.3) (-5.9) (-5.8) (-6.0) (-6.3)<br />
Log likelihood -15549.72 -15420.39 -15413.53 -15418.60 -15413.53<br />
R-sqrd Adjusted 0.08 0.09 0.09 0.09 0.09<br />
Note: t-statistics are shown in parenthesis. Significance is indicated by ***, **, and *, referring to significance<br />
at the 99%, 95%, and 90% levels, respectively.<br />
When comparing these first two model estimations, we see that uncertainty is only significant<br />
in Model 1. In Model 2, with the work scheduling consideration taken into account,<br />
uncertainty is no longer significant. This result suggests that uncertainty may be explained by<br />
the scheduling constraints. Small et al. (1999) obtained a similar result for the estimate <strong>of</strong><br />
68
standard deviation <strong>of</strong> travel time in the scheduling specification utility function. <strong>The</strong> authors<br />
argue that when the scheduling costs are fully specified in a model, it is unnecessary to add an<br />
additional cost for unreliability (uncertainty) <strong>of</strong> travel. Our results confirm this.<br />
Based on the specification in Equation (9), we extend our analysis and investigate the modespecific<br />
<strong>effects</strong> by interacting the travel time and scheduling variables with a public transport<br />
dummy. This leads to the following general specification:<br />
V = PT ⋅ ASC + β ⋅ C + β ⋅ E[<br />
T ] + β<br />
+ β<br />
PT<br />
⋅ PT ⋅ E[<br />
T ] + β<br />
PSDE<br />
⋅ PT ⋅ E[<br />
SDE]<br />
+ β<br />
⋅ E[<br />
SDE]<br />
+ β<br />
PSDL<br />
⋅ E[<br />
SDL]<br />
+ β<br />
C T<br />
SDE<br />
SDL<br />
PL<br />
⋅ P<br />
UNC<br />
⋅UNC<br />
⋅ PT ⋅ E[<br />
SDL]<br />
+ EDT + VEDT + VVEDT<br />
where PT = 1 if the alternative is public transport, and 0 otherwise.<br />
<strong>The</strong> aim is to analyse whether respondents evaluate the attributes <strong>of</strong> public transport and <strong>road</strong><br />
transport with different values. By checking the significance <strong>of</strong> the coefficients <strong>of</strong> these<br />
interaction terms, we can examine whether the valuation <strong>of</strong> public transport significantly<br />
differs from <strong>road</strong> transport. <strong>The</strong> results <strong>of</strong> Model 3 (Table 4.8) do indeed show that there is a<br />
difference in the disutility attributed to travel time and schedule delay. Surprisingly, travel<br />
time becomes more important and scheduling deviations less important for public transport<br />
relative to the car.<br />
Finally, we considered the nonlinear <strong>effects</strong> <strong>of</strong> scheduling variables, such as E[SDE] and<br />
E[SDL], by including the quadratic terms <strong>of</strong> these variables in our indirect utility function<br />
(Models 4 and 5). <strong>The</strong> coefficient <strong>of</strong> this quadratic term <strong>of</strong> SDE is negative and significant,<br />
indicating the non-linear effect. It indicates that people’s aversion to arriving early is<br />
increasing non-linearly as their schedule delay early time increases. Based on the findings <strong>of</strong><br />
Model 4, the public transport interaction terms are re-inserted in Model 5. Because there is<br />
almost no explanatory power <strong>of</strong> the variables E[SDE] and E[(SDL) 2 ] in Model 4, we omit<br />
these two variables in Model 5.<br />
Table 4.9: <strong>The</strong> VOT, VSDE,VSDL, and VUNC <strong>of</strong> Models 1-5(€/hour)<br />
Model 1 Model 2 Model 3 Model 4 Model 5<br />
VOT generic 8.87 8.88 - 8.94 -<br />
VOT for car - - 8.35* - 8.35*<br />
VOT for public transport - - 9.66* - 9.63*<br />
VSDE generic<br />
At SDE=10 min<br />
At SDE=20 min<br />
At SDE=30 min<br />
VSDE for car<br />
At SDE=10 min<br />
At SDE=20 min<br />
At SDE=30 min<br />
VSDE for public transport<br />
At SDE=10 min<br />
At SDE=20 min<br />
At SDE=30 min<br />
- 12.01<br />
- 12.30*<br />
- 6.43*<br />
-<br />
L<br />
3.17<br />
6.34<br />
9.51<br />
-<br />
-<br />
+ β<br />
-<br />
5.52*<br />
11.04*<br />
16.56*<br />
2.29*<br />
4.59*<br />
6.88*<br />
VSDL generic - 14.58 - 17.29 -<br />
VSDL for car - - 16.07* - 16.60*<br />
VSDL for public transport - - 9.69* - 10.73*<br />
VUNC generic 4.24 - - - -<br />
Note: all monetary values given in this table have significance levels within the 90% interval, whereas * is the<br />
indication to show that the difference between car and public transport is significant at the 90% level.<br />
69<br />
(10)
<strong>The</strong> resulting parameter values (VOT, VSDE, VSDL, and VUNC) from these models are<br />
summarised in Table 4.9. <strong>The</strong> generic VOT values <strong>of</strong> around € 8.9 seem reasonable and in<br />
between the value used in Dutch policy documents and the (mean) interval estimates<br />
presented in Section 4.3. Similar results are found for VSDL. <strong>The</strong> value <strong>of</strong> uncertainty is<br />
somewhat lower than the interval estimate (only significant when scheduling costs are<br />
excluded).<br />
<strong>The</strong> results for Model 2 indicate a considerable higher estimate for VSDE than the interval<br />
estimate. This value (12.07) is even higher than VOT, which is rather implausible. People<br />
would then prefer extra travel time over early arrival at work. <strong>The</strong> high VSDE may be<br />
explained by the non-linear effect <strong>of</strong> the SDE variable. We have seen that inclusion <strong>of</strong> the<br />
quadratic terms <strong>of</strong> SDE (Model 4) leads to a coefficient <strong>of</strong> E[(SDE) 2 ] that is negative and<br />
significant. Because expected SDE appears as a quadratic term in the utility function, the<br />
marginal cost <strong>of</strong> SDE rises with SDE. Consequently, VSDE is within a reasonable range<br />
when the expected schedule delay early time is within 20 minutes. This finding is plausible,<br />
as similar results are also obtained in previous studies (Hendrickson and Plank, 1984; Small et<br />
al. 1999). It is also in line with the interval estimate.<br />
<strong>The</strong> estimated coefficients <strong>of</strong> the interaction terms in Model 3 and Model 5 indicate that the<br />
valuations <strong>of</strong> travel time and scheduling attributes in public transport are significantly<br />
different from those in car transport. Figures for VOT, derived from Models 3 and 5, are<br />
significantly higher for public transport than for <strong>road</strong> transport. Jiang and Morikawa (2004)<br />
theoretically analysed the variation <strong>of</strong> VOT and they find that the value <strong>of</strong> travel time savings<br />
is higher for a slower mode if the marginal utility decreases with travel time. This is the case<br />
in our experiment. Public transport is designed as a slower mode and marginal utility is likely<br />
to decrease when travel time rises. Another possible explanation is that public transport is<br />
generally less comfortable, people are willing to pay relatively more to reduce public<br />
transport travel time than time spent in a car. It is in this context <strong>of</strong> importance to emphasise<br />
that we are dealing here with valuations <strong>of</strong> car users. For VSDE and VSDL, car transport has<br />
(significantly) higher estimates than public transport. A possible explanation is that public<br />
transport usage may be perceived as a relatively easy excuse to arrive early or late at work<br />
compared with the car alternative. Private car users may therefore be willing to pay more to<br />
save early or late arrival time.<br />
4.5.2 Observed heterogeneity: multinomial logit model with a set <strong>of</strong> covariates<br />
This section elaborates the analysis by allowing the travel time and scheduling related<br />
attributes to interact with behavioural indicators, such as restriction <strong>of</strong> work starting time and<br />
restriction <strong>of</strong> home departure time, and with some socio-economic indicators, such as gender,<br />
income, education, and travel cost compensation. <strong>The</strong> sample characteristics <strong>of</strong> these<br />
variables can be found in Appendix 4f. Our starting point is the scheduling specification <strong>of</strong><br />
Model 2 (Eq.(9)).<br />
Behavioural indicators: <strong>effects</strong> <strong>of</strong> departure and arrival time restrictions<br />
Intuitively, individuals’ flexibility <strong>of</strong> arrival time at work and departure time from home will<br />
have some impact on VOT and scheduling costs. Numerous empirical studies have confirmed<br />
that work starting time flexibility has a significant impact on the schedule delay estimates<br />
(e.g. Small 1982; Small et al. 1999). Most studies have focused on arrival time restrictions;<br />
less studies have explicitly addressed the impact <strong>of</strong> departure time flexibility on schedule<br />
delay costs. Our data contains information on both issues. We have therefore specified the<br />
interaction terms for these restriction dummies with time and scheduling attributes, and<br />
analyse the significance <strong>of</strong> both <strong>effects</strong>.<br />
70
Table 4.10: Monetary values implied by Model 10 (shown in appendix 4d) (€/hour)<br />
VOT VSDE VSDL Penalty<br />
(later or earlier<br />
than restriction)<br />
No restriction a 8.47 9.80 11.25 -<br />
Cannot arrive at work later than restriction 7.57 12.61* 15.34** 6.39***<br />
Cannot depart from home before restriction 10.29 18.29*** 11.22 1.49<br />
Cannot depart from home after restriction 13.25*** 7.87 10.57 3.13**<br />
Note: ***, **, and *, indicate that the difference between one particular group and the reference group is<br />
significant at the 99%, 95%, and 90% levels, respectively. a No restriction on departure and arrival time is taken<br />
as the reference group for comparison.<br />
Table 4.10 shows the VOT, VSDE, and VSDL (the underlying MNL models can be found in<br />
Appendix 4d). It appears that restrictions do matter as may be expected. Respondents with<br />
restricted starting times at work have a significantly higher VSDE and VSDL, and they also<br />
incur a penalty for arriving later than the restricted time (included by means <strong>of</strong> a dummy<br />
variable). <strong>The</strong>se respondents are willing to pay about €6.4 to arrive before the restriction. For<br />
the restrictions <strong>of</strong> individuals’ departure time, the <strong>effects</strong> are different between early and late<br />
departure constraints. Commuters tend to have a higher VSDE when it is impossible to<br />
change their departure time to an earlier time slot. Commuters who cannot change departure<br />
time to a later moment have a higher VOT.<br />
Travel environment and socio-economic indicators<br />
<strong>The</strong>re is ample evidence that VOT, VSDE, and VSDL vary with travel environment and<br />
socio-economic variables such as trip length, income, and gender (see, e.g., Small et al., 1999;<br />
Lam and Small, 2001). Here, we investigate the <strong>effects</strong> <strong>of</strong> trip length, income, gender,<br />
education, and travel cost compensation by the employer on our estimates <strong>of</strong> interest. <strong>The</strong><br />
estimation results can be found in Appendix 4e, while the summarised monetary values are<br />
given in Table 4.11.<br />
Table 4.11: Monetary values implied by Models 11 to 15 (€/hour)<br />
VOT VSDE VSDL<br />
Trip length 30 km or less a 6.66 14.85 19.57<br />
Trip length 30-60 km 6.57 9.51*** 10.91***<br />
Trip length 60 km or more 11.09*** 11.11* 9.06***<br />
Household yearly income €28,500 or less a 5.29 14.27 18.47<br />
Household yearly income €28,500-45,000 6.49 11.22 16.48<br />
Household yearly income €45,000-68,000 12.72*** 9.72** 10.26***<br />
Household yearly income €68,000 or more 10.48*** 12.35 11.74***<br />
Male a 8.51 10.35 15.02<br />
Female 10.72** 17.31*** 14.37<br />
Lower education (HAVO or less) a 8.91 11.20 16.94<br />
Higher education (HBO or above) 8.95 13.24 12.05**<br />
No travel cost compensation a - b 11.00 15.74<br />
Partial travel cost compensation 9.74*** 8.54 10.88*<br />
Full travel cost compensation 12.50*** 13.03 13.06<br />
Note: ***, **, and *, indicate that the difference between one particular group and the reference group are significant at the<br />
99%, 95%, and 90% levels, respectively.<br />
a This is taken as the reference group for comparison.<br />
b <strong>The</strong> travel time coefficient is not significant.<br />
71
Most <strong>of</strong> the findings are in line with the literature, such as a positive trip length effect on<br />
values <strong>of</strong> time (Gunn, 2001); positive income <strong>effects</strong> on values <strong>of</strong> time (Small et al, 1999) and<br />
positive female <strong>effects</strong> on schedule delay cost (Lam and Small, 2001). Particularly, we also<br />
find that scheduling costs are lower for respondents with a higher income and a higher<br />
educational level (similar to what we found with the interval estimates). This may be<br />
explained by the fact that higher educated people have higher status jobs, which generally<br />
have less restricted working times. <strong>The</strong> impact <strong>of</strong> income on VOT is different from the<br />
interval estimates where we did not find a positive relation. <strong>The</strong> compensation <strong>of</strong> travel costs<br />
by the employer seems most relevant for the VOT. Compensated commuters tend to have a<br />
higher VOT than uncompensated drivers. <strong>The</strong> results <strong>of</strong> the interval estimates were less strong<br />
on this issue; there was only a difference between fully and partially compensated<br />
respondents.<br />
4.6 Conclusions<br />
Policy makers are usually very interested in the up-to-date VOT <strong>of</strong> <strong>road</strong> users. This concept is<br />
an important input to the cost-benefit analysis <strong>of</strong> new <strong>road</strong>s. Recently, with the increasing<br />
levels <strong>of</strong> congestion, other concepts have also gained in importance in the policy arena.<br />
Reliability (reaching a destination within a certain period <strong>of</strong> time), for instance, has recently<br />
been proposed as an important indicator for the performance <strong>of</strong> the Dutch <strong>road</strong> infrastructure.<br />
In addition, the estimated choice models can be integrated in models, which predict car<br />
drivers’ responses to changing travel times or to the imposition <strong>of</strong> <strong>road</strong> user charging.<br />
<strong>The</strong> aim was to find trade-<strong>of</strong>fs between paying and travelling under attractive conditions (in<br />
terms <strong>of</strong> arrival time, travel time, etc.) versus paying less (or nothing) and facing less<br />
attractive travel conditions in terms <strong>of</strong> departure time, route length, and mode. We estimated<br />
choice models to estimate values for the above mentioned concepts and assessed the impact <strong>of</strong><br />
individual characteristics on these.<br />
Two different types <strong>of</strong> choice experiments were carried out. <strong>The</strong> first, relatively simple,<br />
choice experiment was developed to find individual (interval) estimates for each type <strong>of</strong><br />
parameter value. In line with other empirical results, we found that VSDL has the highest<br />
value (a mean value <strong>of</strong> €14), followed by the VOT (about €10). However, this latter value is<br />
slightly higher than the value used in 2004 for commuting traffic (€8.3) by Dutch policy<br />
makers. Commuters seem to attach less value to arriving too early and uncertain travel times.<br />
<strong>The</strong> importance <strong>of</strong> socio-economic characteristics is rather modest. Income, <strong>of</strong>ten cited as<br />
important for VOT, only explains some <strong>of</strong> the variation in the VSDL estimate. Whether<br />
employers compensate for travel costs or not influences some <strong>of</strong> the parameter values. VOT<br />
and VSDE tend to be higher for fully-compensated respondents. Those respondents probably<br />
think that the <strong>road</strong> tolls will also be compensated by their employer.<br />
<strong>The</strong> second experiment consisted <strong>of</strong> 11 choice sets, and again respondents were asked to<br />
allocate 10 trips over four alternatives. It was a labelled experiment in which the alternatives<br />
consisted <strong>of</strong> different attributes (15 in total), which were based on the current behaviour <strong>of</strong><br />
each individual. We estimated various choice models by using the choice proportions set-up.<br />
<strong>The</strong> respondents preferred the car alternative over the public transport alternative. When we<br />
include scheduling costs into the estimations, “pure uncertainty” becomes insignificant. This<br />
has also been found by others, and it suggests that it is unnecessary to add an additional cost<br />
for unreliability (or uncertainty) <strong>of</strong> travel when scheduling costs are fully specified. <strong>The</strong><br />
nonlinear <strong>effects</strong> <strong>of</strong> scheduling variables have also been addressed in our model estimations.<br />
<strong>The</strong> analysis indicates that people’s aversion to arriving early increases non-linearly as their<br />
schedule delay early time increases.<br />
<strong>The</strong> resulting parameter values for VOT and VSDL seem rather plausible. <strong>The</strong> size is<br />
comparable to the interval estimates, with the VOT being somewhat lower (comparable with<br />
72
the previously mentioned 2004 value used in policy documents). <strong>The</strong> generic VSDE estimates<br />
for car and public transport were rather high. This may be explained by the non-linear effect<br />
<strong>of</strong> the SDE variable. VSDE decreases (to a more reasonable value) when the expected<br />
schedule delay early time is within 20 minutes. Note that VOT, VSDE and VSDL <strong>of</strong> public<br />
transport are significantly different from those in car transport. <strong>The</strong> VOT <strong>of</strong> car users is lower,<br />
whereas their VSDE and VSDL is significantly higher.<br />
We have also included personal variables in the utility functions to study heterogeneity. It is<br />
found that the presence <strong>of</strong> departure or arrival time restrictions is important for the parameter<br />
values. People with restricted starting times at work have higher VSDE and VSDL, and they<br />
also incur a penalty for arriving later than the restricted time. For the restrictions <strong>of</strong><br />
individuals’ commuting departure time, the <strong>effects</strong> are different between early and late<br />
departure constraints. Moreover, trip length seems to have an impact, especially on VSDE and<br />
VSDL. Respondents making longer commuting trips generally attach a lower value to<br />
arriving earlier or later than the preferred time. <strong>The</strong> VSDL is lower for people with a higher<br />
income, which is similar to the findings with the interval estimates. Travel cost compensation<br />
only seems to have an impact on VOT, with fully-compensated commuters generally having a<br />
higher VOT. This is similar to what we found with the first experiment. <strong>The</strong>se respondents<br />
may assume that future <strong>road</strong> charged will also be compensated by their employers, which can<br />
explain their willingness to pay for travel time savings.<br />
73
Appendix 4A<br />
Scenarios to obtain VSDE, VSDL, and VUNC interval<br />
estimates<br />
<strong>The</strong> literature suggests that the VSDE is about half <strong>of</strong> the VOT. <strong>The</strong>refore, we defined the<br />
following 4 intervals:<br />
1. € 0 – 2<br />
2. € 2 – 4<br />
3. € 4 – 6<br />
4. > € 6<br />
A<br />
B<br />
C<br />
D<br />
(group 4) (group 3) (group 2) (group 1)<br />
Departure time TD TD – 15 min. TD – 30 min. TD – 45 min.<br />
Travel time Tf Tf Tf Tf<br />
Arrival time TA TA – 15 min. TA – 30 min. TA – 45 min.<br />
Toll € 3 € 1.50 € 0.50 € 0<br />
According to the literature VSDL is about twice the VOT. <strong>The</strong>refore, we defined the<br />
following 4 intervals:<br />
1. € 0 – 8<br />
2. € 8 – 16<br />
3. € 16 – 24<br />
4. > € 24<br />
A<br />
B<br />
C<br />
D<br />
(group 4) (group 3) (group 2) (group 1)<br />
Departure time TD TD + 10 min. TD + 20 min. TD + 30 min.<br />
Travel time Tf Tf Tf Tf<br />
Arrival time TA TA + 10 min. TA + 20 min. TA + 30 min.<br />
Toll € 8 € 4 € 1.33 € 0<br />
We have defined, rather arbitrarily, the following intervals for the VUNC:<br />
1. € 0 – 3<br />
2. € 3 – 6<br />
3. € 6 – 9<br />
4. > € 9<br />
A<br />
B<br />
C<br />
D<br />
(group 4) (group 3) (group 2) (group 1)<br />
Departure time TD – 30 min. TD – 30 min. TD – 30 min. TD – 30 min.<br />
Min. travel time Tf + 30 min. Tf + 5 min. Tf + 0 min. Tf<br />
Max. travel time Tf + 30 min. Tf + 35 min. Tf + 40 min. Tf + 55 min.<br />
Min. arrival time TA TA – 15 min. TA – 30 min. TA – 45 min.<br />
Max. arrival time TA TA + 5 min. TA + 10 min. TA + 15 min.<br />
Tol € 6 € 3 € 1 € 0<br />
74
Appendix 4B<br />
Example <strong>of</strong> one screen (with 4 alternatives) <strong>of</strong> the second<br />
part <strong>of</strong> the SC-experiment as presented to the respondent<br />
(levels are indicative)<br />
Alternative A Alternative B Alternative C Alternative D<br />
Mode <strong>of</strong> transport: car Mode <strong>of</strong> transport: car Mode <strong>of</strong> transport: car Mode <strong>of</strong> transport:<br />
public transport<br />
Trip length : 35 km Trip length: 35 km Trip length: 49 km Trip length: 35 km<br />
Travel costs: € 8.10 Travel costs: € 4.60 Travel costs: € 6.20 Price <strong>of</strong> a ticket: € 3.18<br />
<strong>of</strong> which:<br />
<strong>of</strong> which:<br />
<strong>of</strong> which:<br />
− fuel: €3.20<br />
− fuel: €3.20<br />
− fuel: €4.20<br />
− charge: €4.90 − charge: €1.40 − charge: €2.00<br />
Departure time: 08.10 Departure time: 08.25 Departure time: 08.00 Departure time: 07.25<br />
Total travel time between Total travel time between Total travel time between Total travel time:<br />
40 and 50 minutes 50 and 60 minutes 55 and 65 minutes 72 minutes<br />
<strong>of</strong> which:<br />
<strong>of</strong> which:<br />
<strong>of</strong> which:<br />
− free flow: 25 min. − free flow: 25 min. − free flow: 40 min.<br />
− minimum time in − minimum time in − minimum time in<br />
congestion: 15 min. congestion: 25 min. congestion: 15 min.<br />
− maximum time in − maximum time in − maximum time in<br />
congestion: 25 min. congestion: 35 min. congestion: 25 min.<br />
Arrival time is hence Arrival time is hence Arrival time is hence Arrival time:<br />
between:<br />
between:<br />
between:<br />
08.37<br />
8.50 and 9.00<br />
9.15 and 9.25<br />
8.55 and 9.05<br />
Number <strong>of</strong> trips ….. Number <strong>of</strong> trips …. Number <strong>of</strong> trips … Number <strong>of</strong> trips …<br />
75
Appendix 4C<br />
Computation <strong>of</strong> E[SDE] and E[SDL]<br />
SDE is defined to be positive for early arrivals and zero otherwise; while SDL is positive for<br />
late arrivals and zero otherwise. PL represents the probability <strong>of</strong> arriving later than the<br />
preferred arrival time.<br />
= max{<br />
PAT , 0}<br />
= max{<br />
AT<br />
( AT > PAT )<br />
, 0}<br />
SDE( AT )<br />
− AT<br />
SDL( AT ) − PAT<br />
= Pr ob<br />
,<br />
P L<br />
where AT denotes the arrival time and PAT is the preferred arrival time.<br />
To compute the E[SDE], E[SDL], and PL we can distinguish the following three cases:<br />
Case 1:<br />
Case2:<br />
Case3:<br />
where ATmin is the earliest arrival time and ATmax is the latest arrival time<br />
Case 1: AT max ≤ PAT<br />
1<br />
E [ SDE]<br />
= PAT − AT min+<br />
AT max<br />
2<br />
E [ SDL]<br />
= 0<br />
P = 0 .<br />
L<br />
( )<br />
Case 2: AT min ≥ PAT<br />
E [ SDE]<br />
= 0<br />
1<br />
E[ SDL]<br />
=<br />
2<br />
AT min+<br />
AT max −<br />
P = 1.<br />
L<br />
( ) PAT<br />
Case 3: AT min < PAT & AT max > PAT<br />
1<br />
E[ SDE]<br />
= ( PAT − AT min)<br />
* ( 1−<br />
PL<br />
)<br />
2<br />
1<br />
E [ SDL]<br />
= ( AT max−<br />
PAT ) * PL<br />
2<br />
AT max−<br />
PAT<br />
PL = .<br />
AT max−<br />
AT min<br />
PAT<br />
ATmin ATmax<br />
Time<br />
PAT<br />
ATmin<br />
PAT<br />
ATmax<br />
Time<br />
ATmin ATmax<br />
Time<br />
76
Appendix 4D<br />
Estimation results <strong>of</strong> scheduling restriction <strong>effects</strong> based<br />
on Model 2<br />
Explanatory variables<br />
Model<br />
6<br />
Model<br />
7<br />
Model<br />
8<br />
Model<br />
9<br />
Model<br />
10<br />
ASC <strong>of</strong> public transport alternative -0.77*** -0.77*** -0.77*** -0.77*** -0.78***<br />
(-14.9) (-14.9) (-14.8) (-14.9) (-14.9)<br />
Travel cost C -0.09*** -0.09*** -0.09*** -0.09*** -0.09***<br />
(-16.5) (-16.4) (-16.4) (-16.6) (-16.4)<br />
E[T] -0.01*** -0.01*** -0.01*** -0.01*** -0.01***<br />
(-9.3) (-8.9) (-8.9) (-8.9) (-8.2)<br />
E[T]*arriving later than work restr. 0.0009 0.001<br />
(0.7) (1.1)<br />
E[T]*departing earlier than home restr. -0.005*** -0.003<br />
(-2.7) (-1.3)<br />
E[T]*departing later than home restr. -0.006*** -0.007***<br />
(-3.1) (-3.8)<br />
E[SDE] -0.0186*** -0.017*** -0.02*** -0.02*** -0.01***<br />
(-8.5) (-6.4) (-7.6) (-8.5) (-5.8)<br />
E[SDE]*arriving later than work restr. -0.004 -0.004*<br />
(-1.6) (-1.7)<br />
E[SDE]*departing earlier than home restr. -0.01*** -0.01***<br />
(-3.7) (-3.3)<br />
E[SDE]*departing later than home restr. 0.003 0.003<br />
(0.7) (0.8)<br />
E[SDL] -0.02*** -0.018*** -0.02*** -0.02*** -0.018***<br />
(-8.6) (-6.1) (-9.3) (-8.9) (-5.9)<br />
E[SDL]*arriving later than work restr. -0.01*** -0.006**<br />
(-3.3) (-1.9)<br />
E[SDL]*departing earlier than home restr. 0.003 0.0001<br />
(0.7) (0.01)<br />
E[SDL]*departing later than home restr. -0.0037 0.001<br />
(-0.778) (0.2)<br />
Probability <strong>of</strong> late arrival (later than PAT) -0.094* -0.08* -0.09* -0.09* -0.09*<br />
(-1.9) (-1.8) (-1.9) (-1.9) (-1.9)<br />
Uncertainty 0.002 0.002 0.002 0.002 0.002<br />
(1.2) (1.2) (1.3) (1.3) (1.1)<br />
Dummy for arriving later than work restr. -0.63*** -0.6***<br />
(-6.2) (-5.7)<br />
Dummy for departing earlier than home restr. -0.32*** -0.14<br />
(-4.4) (-1.5)<br />
Dummy for departing later than home restr. -0.18* -0.27**<br />
(-1.2) (-2.3)<br />
Dummy for departing 30-59 min earlier than PDT 0.29*** 0.29** 0.30*** 0.29*** 0.29***<br />
(8.9) (8.9) (9.1) (8.9) (8.8)<br />
Dummy for departing 60-89 min earlier than PDT -0.13*** -0.14*** -0.14*** -0.14*** -0.13***<br />
(-3.6) (-3.7) (-3.7) (-3.7) (-3.6)<br />
Dummy for departing more than 90 min PDT -0.52*** -0.52*** -0.5*** -0.52*** -0.52***<br />
(-6.0) (-5.9) (-6.1) (-5.9) (-5.9)<br />
Log likelihood -15387.63 -15414.93 -15399.98 -15413.79 -15367.50<br />
R-sqrd Adjusted 0.09 0.09 0.09 0.09 0.09<br />
Note: t-statistics are shown in parenthesis. Significance is indicated by ***, **, and *, referring to significance<br />
at the 99%, 95%, and 90% levels, respectively.<br />
77
Appendix 4E<br />
Estimation results <strong>of</strong> trip length, income, gender, education, and cost compensation <strong>effects</strong><br />
Explanatory variables<br />
Model 11<br />
Est. b t-stats.<br />
Model 12<br />
Est. b t-stats.<br />
Model 13<br />
Est. b t-stats.<br />
Model 14<br />
Est. b t-stats.<br />
Model 15<br />
Est. b t-stats.<br />
ASC <strong>of</strong> public transport alternative -0.84*** (-15.4) -0.77*** (-14.8) -0.77*** (-14.7) -0.77*** (-14.8) -0.82*** (-15.5)<br />
Travel cost C -0.11*** (-16.5) -0.1*** (-17.0) -0.092*** (-16.1) -0.09*** (-16.5) -0.11*** (-18.6)<br />
E[T] -0.012*** (-5.9) -0.009*** (-4.7) -0.01*** (-8.7) -0.01*** (-9.1) 0.004 (1.6)<br />
E[T]*Trip length L2 (30-60 km) 0.0002 (0.08)<br />
E[T]*Trip length L3 (>60 km) -0.0078*** (-3.8)<br />
E[T]*Income2 (household inc. €28,500-45,000) -0.002 (-1.08)<br />
E[T]*Income3 (household inc. €45,000-68,000) -0.01*** (-6.6)<br />
E[T]*Income4 (household inc. >€68,000) -0.008*** (-4.9)<br />
E[T]*Female -0.003** (-2.0)<br />
E[T]*Higher education (HBO and above) -0.0001 (-0.050)<br />
E[T]*Fully compensation <strong>of</strong> travel cost -0.02*** (-7.6)<br />
E[T]*Partial compensation <strong>of</strong> travel cost -0.02*** (-9.9)<br />
E[SDE] -0.02*** (-9.3) -0.02*** (-7.9) -0.016*** (-6.9) -0.018*** (-7.2) -0.02*** (-5.2)<br />
E[SDE]*Trip length L2 (30-60 km) 0.009*** (3.2)<br />
E[SDE]*Trip length L3 (>60 km) 0.006* (1.8)<br />
E[SDE]*Income2 (household inc. €28,500-45,000) 0.005 (1.5)<br />
E[SDE]*Income3 (household inc. €45,000-68,000) 0.007** (2.2)<br />
E[SDE]*Income4 (household inc. >€68,000) 0.003 (1.2)<br />
E[SDE]*Female -0.011*** (-3.5)<br />
E[SDE]*Higher education (HBO and above) -0.0032 (-1.2)<br />
E[SDE]*Fully compensation <strong>of</strong> travel cost 0.0045 (1.1)<br />
E[SDE]*Partial compensation <strong>of</strong> travel cost -0.0037 (-0.9)<br />
E[SDL] -0.03*** (-9.5) 0.0299*** (-8.022) -0.02*** (-8.981) -0.03*** (-9.295) -0.029*** (-5.8)<br />
E[SDL]*Trip length L2 (30-60 km) 0.01*** (3.8)<br />
E[SDL]*Trip length L3 (>60 km) 0.02*** (4.4)<br />
E[SDL]*Income2 (household inc. €28,500-45,000) 0.0032 (0.733)<br />
E[SDL]*Income3 (household inc. €45,000-68,000) 0.0133*** (2.948)<br />
E[SDL]*Income4 (household inc. >€68,000) 0.0109*** (2.718)<br />
E[SDL]*Female 0.001 (0.262)<br />
E[SDL]*Higher education (HBO and above) 0.008** (2.440)<br />
E[SDL]*Fully compensation <strong>of</strong> travel cost 0.009* (1.7)<br />
E[SDL]*Partial compensation <strong>of</strong> travel cost 0.005 (0.9)<br />
Probability <strong>of</strong> late arrival (later than PAT) -0.08* (-1.7) -0.0932* (-1.9) -0.09* (-1.8) -0.09* (-1.864) -0.1** (-2.0)<br />
Uncertainty 0.001 (0.7) 0.0014 (1.5) 0.002 (1.2) 0.002 (1.405) 0.0015 (1.0)<br />
Dummy for departing 30-59 min earlier than PDT 0.2*** (6.5) 0.29*** (8.8) 0.31*** (9.4) 0.29** (8.8) 0.26*** (7.9)<br />
Dummy for departing 60-89 min earlier than PDT -0.14*** (-3.6) -0.14*** (-3.8) -0.14*** (-3.8) -0.14*** (-3.7) -0.15*** (-4.0)<br />
Dummy for departing more than 90 min PDT -0.39*** (-4.3) -0.51*** (-5.8) -0.55*** (-6.25) -0.52 (-5.9) -0.46*** (-5.3)<br />
Log likelihood -15390.69 -15384.71 -15405.94 -15413.49 -15355.98<br />
R-sqrd Adjusted 0.09 0.09 0.09 0.09 0.09<br />
Note: t-statistics are shown in parenthesis. Significance is indicated by ***, **, and *, referring to significance at the 99%, 95%, and 90% levels, respectively.<br />
79
Appendix 4F<br />
Explanation and population share <strong>of</strong> explanatory (dummy)<br />
variables <strong>of</strong> data set (N=1115)<br />
Categories Definitions and population share<br />
Gender<br />
Education<br />
Income<br />
Trip length<br />
Late arrival time restriction<br />
Early departure time restriction<br />
Late departure time restriction<br />
Male = 1 if male (76.23%)<br />
Female = 1 if female (23.77%)<br />
Lower education = 1 if senior general secondary (HAVO/VWO) or lower (55.25%)<br />
Higher education = 1 if Bachelor (HBO/WO) or higher (44.75)<br />
Income 1 = 1 if household gross yearly income is less than 28,500 euros (20.72%)<br />
Income 2 = 1 if household gross yearly income is 28,500 – 45,000 euros (26.73%)<br />
Income 3 = 1 if household gross yearly income is 45,000 – 68,000 euros (26.10%)<br />
Income 4 = 1 if household gross yearly income is more than 68,000 euros (26.46%)<br />
Trip length L1 = 1 if the usual commuting distance is less than 30 km (35.16%)<br />
Trip length L2 = 1 if the usual commuting distance is 30 - 60 km (36.95%)<br />
Trip length L3 = 1 if the usual commuting distance is more than 60 km (27.89%)<br />
Late arrival time restriction =1 if commuters cannot arrive at work later than certain<br />
time (54.71%)<br />
Early departure time restriction =1 if commuters cannot depart from home earlier<br />
than certain time (15.07%)<br />
Late departure time restriction = 1 if commuters cannot depart from home later than<br />
certain time (14.44%)<br />
80
Chapter 5<br />
<strong>The</strong> <strong>effects</strong> <strong>of</strong> <strong>road</strong> <strong>pricing</strong>: short-term responses and car<br />
ownership from a survey among car owners<br />
5.1 Introduction<br />
People’s responses to transport <strong>pricing</strong> are not straightforward. Price increases may not<br />
necessarily lead to trip suppression, they may also induce travellers to change their modal use<br />
or change their departure time, depending on the type <strong>of</strong> measure. Chapter 3 provided a<br />
literature overview <strong>of</strong> the <strong>effects</strong> <strong>of</strong> <strong>road</strong> <strong>pricing</strong>, which revealed that <strong>pricing</strong> may affect many<br />
behavioural dimensions, many <strong>of</strong> which have been studied, both theoretically and empirically.<br />
Empirical studies are <strong>of</strong>ten limited to conventional <strong>pricing</strong> measures, such as fuel taxes and<br />
parking <strong>pricing</strong>, and the practical experiences <strong>of</strong> <strong>road</strong> tolls. This is relevant in many<br />
situations. But the Dutch situation may call for a more applied approach, given the interest in<br />
a kilometre charge combined with hypothecation <strong>of</strong> the revenues. <strong>The</strong> present study does this<br />
by systematically analysing the behavioural responses to different forms <strong>of</strong> <strong>road</strong> <strong>pricing</strong>,<br />
including a specification <strong>of</strong> revenue use. While previous studies have looked at the <strong>effects</strong> on<br />
car use, less attention has been given to what people will do when they decide not to use their<br />
car anymore. <strong>The</strong>re is even less knowledge on how to explain the different types <strong>of</strong> responses;<br />
this will also be included here.<br />
This chapter presents the results from an empirical survey among car owners in the<br />
Netherlands (<strong>of</strong> whom half have participated in the questionnaire described in Chapter 4: car<br />
commuters who experience congestion). We study effect sizes and type <strong>of</strong> responses to<br />
different types <strong>of</strong> <strong>road</strong> <strong>pricing</strong> measures. Given the policy relevance (in particular for the<br />
Dutch situation), we have evaluated three different variants <strong>of</strong> a kilometre charge. We will<br />
analyse the short-term behavioural responses in terms <strong>of</strong> sensitivity and type <strong>of</strong> change for<br />
three different trip purposes. Furthermore, the aim is to find important explanatory variables<br />
for the level <strong>of</strong> effectiveness (expressed as the share <strong>of</strong> trips that will be changed). A more<br />
long-term response, car ownership, will be analysed separately.<br />
This chapter is organised as follows. Section 5.2 explains the structure <strong>of</strong> the questionnaire<br />
and the type <strong>of</strong> <strong>pricing</strong> measures that were evaluated by the respondents. <strong>The</strong>n Section 5.3<br />
presents the effectiveness outcomes in terms <strong>of</strong> car trips that will be replaced by the<br />
respondents (including how these trips will be changed). A statistical analysis is conducted in<br />
Section 5.4, which identifies important explanatory variables (positive or negative) for the<br />
level <strong>of</strong> effectiveness <strong>of</strong> each type <strong>of</strong> measure. Section 5.5 focuses on car ownership. It<br />
analyses the probability that respondents will sell their car if different price measures are<br />
implemented. Section 5.6 concludes.<br />
5.2 Data collection and survey description<br />
5.2.1 Data collection<br />
<strong>The</strong> data have been obtained through an (interactive) internet survey among Dutch car<br />
owners. <strong>The</strong> total sample consists <strong>of</strong> 562 respondents, <strong>of</strong> whom half are car commuters who<br />
experience congestion on a regular basis, as investigated in an earlier questionnaire. 8 <strong>The</strong>se<br />
respondents were confronted with three different <strong>road</strong> <strong>pricing</strong> measures, and we asked them if<br />
and how they would expect to change their behaviour in response to these measures. <strong>The</strong><br />
8 <strong>The</strong>se respondents have been selected from the sample presented in Chapter 4. Note that this survey was ‘oversampled’<br />
in the lower income groups so as to obtain a sufficient number <strong>of</strong> observations.<br />
81
focus is first on the short-term responses; the long-term decision with respect to car ownership<br />
and car change will be analysed in Section 5.5. <strong>The</strong> actual data collection was carried out by a<br />
specialised firm (NIPO), which has a panel <strong>of</strong> over 50,000 respondents. <strong>The</strong> data were<br />
collected during three weeks in February 2005.<br />
5.2.2 Survey<br />
Three different <strong>pricing</strong> measures will be considered, each in multiple variants. Table 5.1<br />
shows the various measures that have been developed: 6 different variants for measure 1, 2<br />
variants for measure 2, and again 6 variants <strong>of</strong> the third measure (a more detailed description<br />
<strong>of</strong> these measures can be found in Appendix 5a). <strong>The</strong> variants were divided randomly over the<br />
respondents, and each respondent evaluated one variant <strong>of</strong> each measure (so three in total). As<br />
a result, we obtained at least 88 observations for each variant <strong>of</strong> measure 1 (see also Table<br />
5.3), 282 for measure 2A, and 280 for measure 2B, and about 95 for each variant <strong>of</strong> measure 3<br />
(see also Table 5.7).<br />
Table 5.1: Short description <strong>of</strong> the <strong>road</strong> <strong>pricing</strong> measures presented to the respondents<br />
Measure Variant<br />
1: Flat kilometre charge with<br />
different charge levels and<br />
different revenue use<br />
2: Differentiated kilometre<br />
charge with different charge<br />
levels and different revenue use<br />
3: Crude peak/<strong>of</strong>f-peak<br />
kilometre charge with different<br />
charge levels and different<br />
revenue use<br />
A: 3 €cents, abolition <strong>of</strong> car ownership taxes<br />
B: 6 €cents, abolition <strong>of</strong> existing car taxation (purchase and ownership)<br />
C: 12 €cents, abolition <strong>of</strong> existing car taxation and investment in new <strong>road</strong>s<br />
D: 3 €cents, revenues used to lower income taxes<br />
E: 6 €cents, revenues used to lower income taxes<br />
F: 12 €cents, revenues used to lower income taxes<br />
A: 2 €cents with multi-step (morning and evening) peak time toll on bottlenecks, revenues<br />
used to abolish car ownership taxes<br />
B: differentiated according to weight <strong>of</strong> the car, revenues used to abolish existing car<br />
taxation<br />
A: 2 €cents outside peak times and 6 €cents in peak, abolition <strong>of</strong> car ownership taxes<br />
B: 4 €cents outside peak times and 12 €cents in peak, abolition <strong>of</strong> existing car taxation<br />
C: 8 €cents outside peak times and 24 €cents in peak, abolition <strong>of</strong> existing car taxation and<br />
new <strong>road</strong>s<br />
D: 2 €cents outside peak times and 6 €cents in peak, revenues used to lower income taxes<br />
E: 4 €cents outside peak times and 12 €cents in peak, revenues used to lower income taxes<br />
F: 8 €cents outside peak times and 24 €cents in peak, revenues used to lower income taxes<br />
All descriptions <strong>of</strong> the measures, as shown to respondents, consisted <strong>of</strong> two major<br />
components: we explained both the structure and level <strong>of</strong> the charge, and the allocation <strong>of</strong> the<br />
revenues. Furthermore, we provided each respondent individually with an estimation <strong>of</strong> the<br />
financial consequences <strong>of</strong> the implementation <strong>of</strong> the proposed measure (on the basis <strong>of</strong> selfreported<br />
current travel behaviour and car ownership for unchanged behaviour). This<br />
estimation depends on the charge level (costs) and on the type <strong>of</strong> revenue use (benefits). We<br />
assume that each respondent will make a cost calculation based on their present situation.<br />
Information on the annual number <strong>of</strong> kilometres driven, and for some measures also on the<br />
type <strong>of</strong> vehicle (measure 2B) and time <strong>of</strong> driving (measures 2A and 3)) is the input for the<br />
cost estimation based on present behaviour. <strong>The</strong> financial benefits shown to the respondent<br />
depend on the type <strong>of</strong> revenue use. Because it was impossible to give respondents a personal<br />
estimate <strong>of</strong> the financial benefits resulting from recycling <strong>of</strong> revenues via lower income<br />
taxation, we only presented the savings for those measures where existing car taxes are<br />
abolished to help the respondents with their cost-benefit assessment 9 . We also explained some<br />
practical issues that were meant to prevent various practical considerations from affecting the<br />
9 <strong>The</strong> benefits from paying less car taxation depend on the type <strong>of</strong> car the respondents own (i.e. on fuel type and<br />
weight). We have estimated average savings for nine categories (a combination <strong>of</strong> three fuel types and three<br />
weight categories), for an abolition <strong>of</strong> annual car ownership taxes (MRB) only and an abolition <strong>of</strong> all existing car<br />
taxation; namely, MRB and the fixed purchase tax (BPM).<br />
82
esponse: the privacy <strong>of</strong> car users is guaranteed, electronic equipment registers the toll, and<br />
the driver can choose freely the payment method (e.g. credit card, bank transfer, etc.).<br />
<strong>The</strong> survey began with some general questions asking the respondent for important<br />
background variables. <strong>The</strong>se variables may help explain the differences in reported<br />
effectiveness levels. <strong>The</strong> variables included in our statistical analyses are explained in more<br />
detail in Appendix 5b, which shows the pr<strong>of</strong>ile <strong>of</strong> our sample.<br />
All respondents own a car, which is used for different trip purposes. <strong>The</strong>se are not necessarily<br />
commuting because not all respondents have a job (17.6% are not employed: see Appendix<br />
5b). <strong>The</strong> educational level <strong>of</strong> our sample seems relatively high. About 29% <strong>of</strong> the Dutch car<br />
owners have a bachelor’s or master’s degree (based on CBS data for 2003), but in our survey<br />
this share is considerably higher (40%). CBS statistical data also suggests that car ownership<br />
increases with income. About 20% <strong>of</strong> the car owners in this sample have an income below<br />
€28,500 (with 9% having no income). Younger people seem to be overrepresented in our<br />
survey. About 30% <strong>of</strong> the car owners in the Netherlands are older than 55, while this share is<br />
only 16% in this survey. Most <strong>of</strong> the respondents are located in the Randstad area (the<br />
category rest west and three large cities in our sample), the northern part <strong>of</strong> the Netherlands is<br />
only modestly represented with 6.4%.<br />
Whether respondents have the possibility to work at home or not may have an impact on the<br />
effectiveness <strong>of</strong> a <strong>road</strong> <strong>pricing</strong> measure. Since we have information on this, it has been<br />
included into the analysis. About 62% <strong>of</strong> the employed respondents who use their car for their<br />
commuting trip do not have the possibility to work at home. Respondents who do not make<br />
car commuting kilometres or do not have a job have not answered this question (they form the<br />
‘unknown’ group: about 32% <strong>of</strong> the sample). We also asked whether the respondents received<br />
compensation for their commuting costs from their employer. Most car owners are at least<br />
partly compensated. A small group incurs no commuting costs: these may be people who do<br />
their work at home but it may also be respondents who have misinterpreted the question and,<br />
in fact, are completely compensated by their employer (because they indicated that they do<br />
drive commuting kilometres).<br />
After a brief description <strong>of</strong> each measure, the respondents were asked whether they would<br />
change the number <strong>of</strong> car trips for the following three different trip purposes (only in those<br />
cases where the respondent indicates that he/she actually makes this type <strong>of</strong> trip):<br />
− Commuting trips (made at least sometimes by 70.8% <strong>of</strong> the respondents);<br />
− Trips to visit people (made at least sometimes by 80.1% <strong>of</strong> the respondents);<br />
− Other type <strong>of</strong> trips (e.g. shopping, sports activities, etc., made at least sometimes by<br />
92.9% <strong>of</strong> the respondents).<br />
Commuting trips are only made by 71% <strong>of</strong> the respondents, but the intensity <strong>of</strong> these trips<br />
during the week is relatively higher compared with the other types <strong>of</strong> trips.<br />
If respondents indicated that they did expect to adjust their travel behaviour 10 , they were next<br />
asked to indicate the share <strong>of</strong> trips that will be changed, and also how these will be changed.<br />
Depending on the type <strong>of</strong> measure (it makes little sense to ask whether respondents will<br />
change their departure time when a flat kilometre charge is presented), various possibilities<br />
were presented:<br />
− Public transport;<br />
− Non-motorised transport (walking, bicycle);<br />
− Motorised private transport (motorbike, motor);<br />
− Carpool (only asked for commuting trips);<br />
− Work at home (only asked for commuting trips);<br />
10<br />
It is possible that people indicate that they intended to make more car trips, and in that case we only asked<br />
how many extra trips this person would make.<br />
83
− Travel at other times (only when measure is time dependent);<br />
− Give up the trip.<br />
In order to analyse the behavioural responses to the proposed <strong>pricing</strong> measure in a<br />
quantitative way, we asked the respondents to indicate for each purpose how many trips they<br />
made in a normal week. Because some (types <strong>of</strong>) trips are only made once a week, we asked<br />
the respondents to indicate how many trips they would change in a period <strong>of</strong> 4 weeks (by<br />
presenting their total number <strong>of</strong> trips made for each purpose (4 times the number <strong>of</strong> trips in a<br />
week)). Hence, a respondent indicating that he/she makes 5 commuting trips a week can<br />
change 20 trips at most. Next it was asked how these trips would be changed. Respondents<br />
had to make sure that the number <strong>of</strong> trips changed was equal to the number <strong>of</strong> trips allocated<br />
over the different alternatives.<br />
This approach, as with most research on future, hypothetical situations, may involve some<br />
drawbacks. Respondents may answer strategically (‘I want this measure not to be<br />
implemented, so I will not change behaviour’) or give socially desirable answers. It may also<br />
be the case that the questions are too difficult to understand for the respondents (e.g. as a<br />
consequence <strong>of</strong> many uncertainties), which may give problems with interpretation <strong>of</strong> the<br />
answers. We have tried to obviate this by giving detailed information about the policy<br />
measure and the future costs for each individual. <strong>The</strong>se issues should be taken into account<br />
when explaining the results.<br />
5.3 Effectiveness <strong>of</strong> different <strong>pricing</strong> regimes<br />
<strong>The</strong> aim <strong>of</strong> this survey is to analyse the behavioural responses to realistic and policy-relevant<br />
<strong>road</strong> <strong>pricing</strong> measures 11 . This section focuses on the sensitivity and type <strong>of</strong> effect <strong>of</strong> the shortterm<br />
responses to three different <strong>road</strong> <strong>pricing</strong> measures presented to the respondents for three<br />
different trip purposes (i.e. commuting, social travel (visits), and other (e.g. shopping)). <strong>The</strong><br />
overview at the end <strong>of</strong> this section gives a short comparison with findings in the previous<br />
literature (discussed in Chapter 3) on this subject whenever possible and relevant.<br />
We have information on the behavioural responses in terms <strong>of</strong> number <strong>of</strong> trips that an<br />
individual would adjust, and how these would be adjusted. Since we also have an individual<br />
estimation <strong>of</strong> the yearly number <strong>of</strong> kilometres driven for each trip purpose, it is also possible<br />
to express changes in terms <strong>of</strong> kilometres. Information on both outcomes will be presented<br />
below.<br />
5.3.1 Measure 1: flat kilometre charge (3, 6 and 12 €cents) and different revenue use<br />
<strong>The</strong> number <strong>of</strong> respondents who indicated they would adjust their car trips if measure 1<br />
became a reality was 45 for commuting (11% <strong>of</strong> commuters change trips), 119 (26%) for<br />
visits and 125 (24%) for other trip purposes. After weighting these adjustments by numbers <strong>of</strong><br />
trips made and by the length <strong>of</strong> these trips, we can transform these figures into changes in the<br />
number <strong>of</strong> trips and kilometres. Table 5.2 shows the aggregated outcomes for all variants<br />
together; Appendix 5c gives the detailed results for each measure separately.<br />
<strong>The</strong> numbers vary considerably over the various trip purposes. <strong>The</strong> proposed kilometre charge<br />
is relatively most effective for trips made to visit people, and least effective for commuting<br />
trips. This is in line with the findings for price elasticities that were presented in Chapter 3. It<br />
may be explained by the fact that a trip suppression is not a serious alternative for commuting<br />
trips (only 0.5% <strong>of</strong> trips to be adjusted will not be made anymore), whereas for other reasons<br />
people can seriously consider the alternative <strong>of</strong> not making the trip. Popular alternatives (for<br />
all purposes) for car trips include slow transport and public transport. Cycling and walking are<br />
11<br />
At this moment, policy makers in the Netherlands are seriously considering the implementation <strong>of</strong> a kilometre<br />
charge that replaces current car taxation.<br />
84
in particular an alternative for visits and other trips, as apparently these trips are <strong>of</strong>ten <strong>of</strong> short<br />
distance. <strong>The</strong> effectiveness in terms <strong>of</strong> adjusted number <strong>of</strong> kilometres is smaller than for<br />
numbers <strong>of</strong> trips; probably people driving relatively less adjust their behaviour.<br />
Table 5.2: Aggregated outcomes and variation <strong>of</strong> behavioural responses to measure 1: a flat<br />
kilometre charge<br />
Commuting Visits Other<br />
Total number <strong>of</strong> trips (driven in 4 weeks) 6800 3620 7780<br />
Number <strong>of</strong> trips adjusted<br />
Of which:<br />
Public transport<br />
Non-motorised transport<br />
Motorised<br />
Carpool<br />
Working at home<br />
Not making trip<br />
400 (5.9%)<br />
31.8%<br />
32.2%<br />
9.5%<br />
19.5%<br />
6.5%<br />
0.5%<br />
513 (14.2%)<br />
17.8%<br />
44.6%<br />
8.9%<br />
not relevant<br />
not relevant<br />
28.6%<br />
846 (10.9%)<br />
13.3%<br />
64.9%<br />
1.8%<br />
not relevant<br />
not relevant<br />
19.9%<br />
Kilometres adjusted (as a % <strong>of</strong> total) 3.9% 11.6% 9.2%<br />
Trip purpose Variance 0.042 0.056 0.041<br />
population<br />
(N=398) (N=450) (N=522)<br />
Skewness (st. error) 3.50 (.122) 1.90 (.115) 2.07 (.107)<br />
Population Variance 0.099 0.051 0.039<br />
adjusting trips<br />
(N=45) (N=119) (N=125)<br />
Skewness (st. error) 0.15 (.354) 0.66 (.222) 0.82 (.217)<br />
While it is useful to present aggregated results, these mask the variations among individual<br />
responses. In fact, they may be skewed as a result <strong>of</strong> extreme responses by some individuals<br />
and sampling biases. It is therefore important to report variation measures <strong>of</strong> individual<br />
responses. We report the skewness and the variance for two different samples: 1) those<br />
respondents who indicate that they made a particular type <strong>of</strong> trip (including the large group<br />
who indicated they would not change); and 2) those respondents who indicate to change<br />
behaviour. <strong>The</strong> large sample has a positive (to the right) skewness with considerably smaller<br />
standard errors, which can be explained by the large number <strong>of</strong> zeros in this sample. <strong>The</strong><br />
variances for both populations are not very different from each other. Similar patterns have<br />
been found for the other two measures, but these will only be reported and not discussed.<br />
It is also interesting to consider the relative effectiveness <strong>of</strong> the various variants <strong>of</strong> measure 1.<br />
As expected and confirmed by previous studies, a kilometre charge <strong>of</strong> 12 €cents has more<br />
effect than a similar measure with lower charges. Table 5.3 shows the impact <strong>of</strong> each variant<br />
for the various purposes. Some results are different than expected: a measure with a higher<br />
charge is not always more effective. For instance, measure 1D (with a charge <strong>of</strong> 3 €cents)<br />
seems slightly more effective than measure 1E (6 €cents) for particular trip purposes. Measure<br />
1F induces the strongest trip changes. Variants A, B, and C are measures where car taxation is<br />
abolished, which seem to be less effective than those measures where revenues are used to<br />
lower income taxes. <strong>The</strong> perceived higher costs for each individual involved with the latter<br />
measures, stemming from our inability to predict the reduction in income tax, may provide an<br />
explanation for this. None <strong>of</strong> the 96 respondents who evaluated measure 1A (with the low<br />
toll) indicated that they would change their commuting trips.<br />
85
Table 5.3: Effectiveness related to the variants <strong>of</strong> measure 1: a flat kilometre charge<br />
Measure Number <strong>of</strong> % <strong>of</strong> total trips adjusted<br />
respondents Commuting Visits Other<br />
1A (3 €cents/MRB)<br />
96<br />
0 9.5 13.6<br />
1B (6 €cents/MRB+BPM)<br />
94<br />
5.0 9.4 9.5<br />
1C (12 €cents/MRB+BPM+new <strong>road</strong>s) 88<br />
11.3 20.3 17.6<br />
1D (3 €cents/income taxes)<br />
101 25.0 15.0 21.2<br />
1E (6 €cents/income taxes)<br />
91<br />
19.7 20.5 16.7<br />
1F (12 €cents/income taxes)<br />
92<br />
39.0 25.3 21.5<br />
5.3.2 Measure 2: kilometre charge with multi-step bottleneck toll (2A), and kilometre<br />
charge differentiated according to weight <strong>of</strong> the vehicle (2B)<br />
Table 5.4 shows the behavioural responses for both variants <strong>of</strong> the second measure separately,<br />
because these are very different. <strong>The</strong> first variant is a peak-period charge combined with a flat<br />
kilometre fee, while measure 2B is differentiated according to weight <strong>of</strong> the vehicle.<br />
Compared with the previous measure, we see that one type <strong>of</strong> response has been added: travel<br />
at other times. Because only measure 2A is differentiated according to time, this type <strong>of</strong><br />
behavioural response is only relevant for that variant. Changing travel time is very attractive<br />
for all trip purposes: people prefer car use at other times over public transport and non<br />
motorised travel, especially for commuting trips. <strong>The</strong> respondents will try to avoid the<br />
bottlenecks at certain times, and are less inclined to give up trips for social or other purposes<br />
(relative to measure 2B). Note that this variant has a fine differentiation compared with<br />
measure 3, and only applies to certain (bottleneck) locations. Measure 2B seems relatively<br />
less effective for commuting trips, only 4% <strong>of</strong> the total number <strong>of</strong> commuting trips will be<br />
changed. Table 5.5 confirms this. It shows that measure 2A is responsible for almost threequarters<br />
<strong>of</strong> the adjusted commuting trips. Finally, it appears that slower travel modes are an<br />
attractive alternative especially for social purposes. <strong>The</strong>se trips probably <strong>of</strong>ten have nearby<br />
destinations.<br />
Table 5.4: Behavioural responses to measure 2A (multi-step toll), and 2B (km charge/weight<br />
vehicle)<br />
Measure Measure 2A Measure 2B<br />
Trip purpose Commuting Visits Other Commuting Visits Other<br />
Total number <strong>of</strong> trips<br />
(driven in 4 weeks)<br />
3188 1824 3892 3612 1796 3888<br />
Trips adjusted (% total)<br />
Of which:<br />
358 (11.2%) 166 (9.1%) 359 (9.2%) 145 (4.0%) 150 (8.4%) 308 (7.9%)<br />
Public transport 22.3% 16.9% 13.1% 13.8% 14.0% 9.7%<br />
Non-motorised travel 8.9% 29.5% 38.7% 26.2% 46.7% 66.6%<br />
Motorised<br />
2.5% 1.4% 1.7% 38.6% 8.7% 1.0%<br />
Car pooling<br />
10.6% NR NR 12.4% NR NR<br />
Travel at other times 51.1% 42.2% 38.2% NR NR NR<br />
Working at home 4.2% NR NR 6.9% NR NR<br />
Not making the trip 0.3% 10.2% 8.3% 2.1% 30.7% 22.7%<br />
kilometres adjusted (as a<br />
% <strong>of</strong> total)<br />
11.3% 10.3 8.2 2.5 6.7 7.4<br />
NR = not relevant, measure may not be differentiated according to time (2B) or alternative is not relevant for trip<br />
purpose.<br />
86
Table 5.5: Effectiveness related to both variants <strong>of</strong> measure 2, and variation in responses<br />
Number <strong>of</strong><br />
% <strong>of</strong> total trips adjusted<br />
respondents Commuting Visits Other<br />
2A: multi-step bottleneck toll 282<br />
71.2<br />
52.5<br />
53.8<br />
2B: km charge/weight vehicle 280<br />
28.8<br />
47.5<br />
46.2<br />
Variation for aggregated outcomes<br />
Trip purpose<br />
Variance 0.048 0.034 0.060<br />
population<br />
(N=398) (N=450) (N=522)<br />
Skewness (st. error) 3.01 (.122) 3.81 (.115) 2.07 (.107)<br />
Population adjusting Variance 0.094 0.067 0.060<br />
trips<br />
(N=56) (N=81) (N=97)<br />
Skewness (st. error) 0.20 (.319) 0.72 (.267) 0.81 (.245)<br />
5.3.3 Measure 3: peak and <strong>of</strong>f peak kilometre charge with different revenue use<br />
<strong>The</strong> third measure is a kilometre charge differentiated crudely according to time (peak and<br />
<strong>of</strong>f-peak only) with different revenue use allocations. Compared with the previous measures,<br />
this measure is, in terms <strong>of</strong> total number adjusted trips (for all purposes), most effective<br />
(14.1% versus 9.7% (measure 1) and 7.6% (measure 2)). This measure has relatively more<br />
impact on commuting trips. <strong>The</strong> number <strong>of</strong> commuting trips changed is 1004 (about 15% <strong>of</strong><br />
the total trips made for commuting reasons), considerably more than 400 (measure 1) and 503<br />
(measure 2). Almost half <strong>of</strong> the trips that would be adjusted would be replaced by trips made<br />
<strong>of</strong>f-peak (see Table 5.6, and Appendix 5c for the disaggregated results). Non-motorised travel<br />
is also an attractive alternative, but again only for the non-commuting purposes. <strong>The</strong> motor or<br />
motorbike is not a serious alternative for the respondents, and the same holds for carpooling.<br />
<strong>The</strong> findings for variation in responses are similar to those <strong>of</strong> measure 1: the distribution for<br />
the large sample is skew to the right as may be expected.<br />
<strong>The</strong> pattern shown in Table 5.7 is somewhat different from what could be expected. This<br />
measure combines different charge levels with different types <strong>of</strong> revenue use. Variants C and<br />
F have the highest charges, considerably higher than A and D. <strong>The</strong> estimated benefits <strong>of</strong><br />
revenue use for variants A to C were presented to the respondents, but this was not done for<br />
the variants where revenues are used to lower income taxes (D to F). Since higher charges<br />
tend to have more effect, variants C and F may be expected to have more effect than the other<br />
alternatives, and B and E again more than A and D. However, this is not found here. Measure<br />
3B, for instance, is considerably less effective than measure 3A for all purposes. <strong>The</strong> effect <strong>of</strong><br />
revenue use (not only MRB, but also BPM) may be responsible for this. A similar pattern is<br />
found for measure 3E (compared with 3D), but in this case the allocation <strong>of</strong> revenues was<br />
unchanged. Most remarkable is that the variants with the lowest charge levels (A and D) are<br />
even more effective than variants C and F for certain purposes. But the answers remain<br />
responses to hypothetical situations. <strong>The</strong> findings for the impact <strong>of</strong> revenue use (abolition <strong>of</strong><br />
car taxation vs. income tax reductions) are for most trip purposes equal to the results for<br />
measure 1: variabilisation is said to be less effective. Only the outcomes found for measures<br />
3C (visits) and 3A (other purposes) are different in this context, revenues hypothecated to<br />
reduce car taxation dominates income tax compensation in terms <strong>of</strong> effectiveness. We will<br />
analyse the impact <strong>of</strong> the type <strong>of</strong> measure (distinction between revenue use and charge level)<br />
in a more detailed way by conducting a statistical analysis in Section 5.4.<br />
87
Table 5.6: Aggregated outcomes <strong>of</strong> behavioural responses to measure 3 including variation:<br />
peak and <strong>of</strong>f-peak kilometre charge<br />
Commuting Visits Other<br />
Total number <strong>of</strong> trips<br />
6800 3620 7780<br />
(driven in 4 weeks)<br />
Number <strong>of</strong> trips adjusted<br />
Of which:<br />
Public transport<br />
Non-motorised transport<br />
Motorised<br />
Carpool<br />
Travel at other times<br />
Working at home<br />
Not making trip<br />
1004 (14.8%)<br />
17.6%<br />
12.7%<br />
8.8%<br />
4.5%<br />
47.7%<br />
7.9%<br />
0.6%<br />
529 (14.6%)<br />
13.6%<br />
28%<br />
1.7%<br />
not relevant<br />
47.8%<br />
not relevant<br />
8.9%<br />
1028 (13.2%)<br />
14.1%<br />
28.9%<br />
1.5%<br />
not relevant<br />
47.3%<br />
not relevant<br />
8.3%<br />
Kilometres adjusted (in % <strong>of</strong> total) 14.6% 13.2% 11.2%<br />
Trip purpose Variance 0.099<br />
0.091<br />
0.069<br />
population<br />
(N=398) (N=450) (N=522)<br />
Skewness (st. error) 1.93 (.122) 1.88 (.115) 2.20 (.107)<br />
Population Variance 0.125<br />
0.090<br />
0.081<br />
adjusting<br />
(N=102) (N=114) (N=116)<br />
trips Skewness (st. error) -0.15 (.239) 0.10 (.226) 0.33 (.225)<br />
When we look at the <strong>effects</strong> <strong>of</strong> the measure for trip purposes, it seems that measure 3C has<br />
more effect on social visiting trips than for the other purposes. <strong>The</strong> reverse holds for the same<br />
purpose for measure 3F. Measure 3D tends to be less effective for other trips, while, on the<br />
other hand measure 3A seems most effective for this type <strong>of</strong> trips. <strong>The</strong>re does not seem much<br />
difference over trip purposes for the other measures.<br />
Table 5.7: Effectiveness related to the variants <strong>of</strong> measure 3: peak and <strong>of</strong>f-peak kilometre<br />
charge<br />
Measure Number <strong>of</strong> % <strong>of</strong> total trips adjusted<br />
respondents Commuting Visits Other<br />
3A: 2/6 €cents (<strong>of</strong>f-peak/peak), MRB<br />
96 16.0 14.2 21.6<br />
3B: 4/12 €cents, MRB+BPM<br />
91 13.8 10.0 12.1<br />
3C: 8/24 €cents, car taxation and new <strong>road</strong>s 97 15.8 25.9 13.1<br />
3D: 2/6 €cents, income taxes<br />
96 19.0 18.9 14.4<br />
3E: 4/12 €cents, income taxes<br />
94 13.9 14.4 15.7<br />
3F: 8/24 €cents, income taxes<br />
88 21.3 16.6 23.2<br />
5.3.4 Overview<br />
In terms <strong>of</strong> trips, the effectiveness <strong>of</strong> the measures is in the range <strong>of</strong> 6% to 15% for all trip<br />
purposes. <strong>The</strong> effect in terms <strong>of</strong> kilometres is somewhat smaller. It is <strong>of</strong>ten difficult to<br />
compare these results with the previous literature because <strong>of</strong> differences in the measures<br />
analysed and the research methods applied (modelling vs. stated preference). <strong>The</strong> work<br />
discussed here probably comes closest to the research by MuConsult (2002), although that<br />
study also included respondents not owning a car. <strong>The</strong> outcomes in terms <strong>of</strong> kilometres for<br />
measure 1A and 1B may be compared with the results <strong>of</strong> the MuConsult study. Our results<br />
then show stronger <strong>effects</strong>, which cannot entirely be explained by the fact that we have not<br />
included non-car owners.<br />
88
In Chapter 3 we discussed the properties <strong>of</strong> elasticities and showed literature estimates. <strong>The</strong><br />
structure <strong>of</strong> the previously described experiment allows us to derive elasticities (although not<br />
for every measure), since both changes in demand and prices are available. Table 5.8 shows<br />
elasticity values for measure 1 and 3 (the percentage change in quantity divided by the<br />
percentage change in price). We assume that the present level <strong>of</strong> variable cost <strong>of</strong> driving<br />
equals the fuel cost (€1.50/litre which is about €0.11/kilometre for an average petrol car, we<br />
neglect differences between fuel types and maintenance costs). <strong>The</strong> difference in the price<br />
measure (‘delta p’) is straightforward for measure 1: the level <strong>of</strong> the kilometre charge. <strong>The</strong><br />
percentage change in demand is equal to the number <strong>of</strong> trips adjusted for each variant as a<br />
fraction <strong>of</strong> the total number <strong>of</strong> trips made (which differs for each trip purpose, see appendix<br />
5c). Measure 3 is a time differentiated measure, which makes things slightly more<br />
complicated. We decided to focus on the trip timing effect <strong>of</strong> the additional peak period<br />
charge, and exclude other behavioural responses. <strong>The</strong>refore Table 5.8 presents peak period<br />
demand elasticities for measure 3. We assume that all ‘travel at other times’ trips will be<br />
outside the defined peak period with the additional charge (so there is no ‘return to the peak’<br />
effect). In addition, we assume that 46% <strong>of</strong> the commuting trips, 18% <strong>of</strong> the visit type <strong>of</strong> trips,<br />
and 14% <strong>of</strong> the ‘other’ trips is presently driven within those peak periods (based on CBS data<br />
available for the Netherlands).<br />
Table 5.8: Elasticities for measures 1 and 3<br />
Commuting Visits Other<br />
1A: 3 €cents<br />
1B: 6 €cents<br />
1C: 12 €cents<br />
1D: 3 €cents<br />
1E: 6 €cents<br />
1F: 12 €cents<br />
3A: peak charge <strong>of</strong> 6 €cents<br />
3B: peak charge <strong>of</strong> 12 €cents<br />
3C: peak charge <strong>of</strong> 24 €cents<br />
3D: peak charge <strong>of</strong> 6 €cents<br />
3E: peak charge <strong>of</strong> 12 €cents<br />
3F: peak charge <strong>of</strong> 24 €cents<br />
0<br />
-0.03<br />
-0.04<br />
-0.30<br />
-0.12<br />
-0.14<br />
-0.36<br />
-0.11<br />
-0.02<br />
-0.38<br />
-0.14<br />
-0.08<br />
-0.32<br />
-0.13<br />
-0.15<br />
-0.48<br />
-0.32<br />
-0.20<br />
-0.54<br />
-0.33<br />
-0.21<br />
-0.83<br />
-0.40<br />
-0.14<br />
-0.28<br />
-0.12<br />
-0.12<br />
-0.47<br />
-0.19<br />
-0.13<br />
-1.00<br />
-0.32<br />
-0.17<br />
-0.72<br />
-0.43<br />
-0.21<br />
<strong>The</strong> range <strong>of</strong> estimates (between 0 and -1.0) is comparable to the literature estimates<br />
presented in Table 3.2. However, direct comparison is not possible since our car use<br />
elasticities are in number <strong>of</strong> trips, while those <strong>of</strong> Chapter 3 are in car kilometres. <strong>The</strong> variety<br />
between measures is considerable. <strong>The</strong> elasticity estimates decrease when price changes<br />
become larger. This is explained by the considerable changes in prices, and the relatively<br />
small differences in demand changes. It indicates that a kilometre charge with low charge<br />
levels is, in a relative sense, more effective. We should note that an additional charge <strong>of</strong> €0.03<br />
(as in measure 1A and 1D) is already a price increase <strong>of</strong> 28%, which is substantial. Additional<br />
increases are not very effective anymore. This is not in line with research by MuConsult<br />
(1997), which suggests that fuel price elasticities (<strong>of</strong> the demand for car kilometres) increase<br />
with price increases (up till 60% <strong>of</strong> price changes).<br />
For measure 3 we find, again, elasticities decreasing with (peak) charges. <strong>The</strong> considerable<br />
elasticities for ‘visit’ and ‘other’ type <strong>of</strong> trips is explained by the relative small number <strong>of</strong><br />
trips made in the peak. <strong>The</strong> estimates may implicitly include an underestimation as well as an<br />
overestimation <strong>of</strong> the effectiveness <strong>of</strong> peak period <strong>pricing</strong>. Overestimation, because we do not<br />
include extra trips made in the peak period (due to improved <strong>road</strong> conditions).<br />
Underestimation, because we only consider one type <strong>of</strong> response, car owners may also decide<br />
to use public transport instead.<br />
89
<strong>The</strong>re are considerable differences between trip purposes. Measures 1 and 2 seem to have less<br />
effect on commuting trips, which is a rather usual result (e.g. see the literature results on<br />
elasticities and modelling outcomes in Chapter 3). In contrast, measures 3 and 2A do seem to<br />
have a stronger effect on commuting trips. A common characteristic <strong>of</strong> both these measures is<br />
the differentiation according to time. Measure 3 seems to be most effective overall, especially<br />
for commuting trips.<br />
Non-motorised transport is a popular alternative for trips to visit people or shopping trips,<br />
especially when it concerns a flat kilometre charge. This suggests that people <strong>of</strong>ten take the<br />
car for short trips that can easily be replaced by walking or cycling. Driving at different times<br />
than before is also a popular alternative, especially for the (car dependent) commuting trips.<br />
Commuting trips are hard to suppress (working at home or not making the trip are not serious<br />
options for most <strong>of</strong> the respondents), but there does seem to be some flexibility to allow the<br />
rescheduling <strong>of</strong> trips. This is confirmed by the empirical results from Singapore (see<br />
Olszewski and Xie, 2005) and time-dependent modelling studies (see Chapter 3).<br />
<strong>The</strong> impact <strong>of</strong> the type <strong>of</strong> measure is not straightforward. Previous research and common<br />
sense suggest that higher kilometre charges have more impact. Our own results are, however,<br />
somewhat mixed on this issue and are difficult to explain. However, the statistical analysis <strong>of</strong><br />
Section 5.4 does not confirm statistically that measures with lower charge levels may be more<br />
effective. <strong>The</strong>re are <strong>of</strong> course two opposing <strong>effects</strong>: a price increase caused by the kilometre<br />
tax and the indirect subsidy <strong>of</strong> revenue spending. <strong>The</strong> abolition <strong>of</strong> present taxation may be<br />
considered as an income effect that gives purchasing power to the consumer (countervailing<br />
force). Given the nature <strong>of</strong> the measures – revenue neutral to the government – the level <strong>of</strong><br />
compensation <strong>of</strong> both types <strong>of</strong> revenue use is similar. But we do find a difference in<br />
effectiveness: those measures with revenues allocated to lower income taxes generally have<br />
more effect on car use. Although difficult to explain, it may be caused by the difference in<br />
perception <strong>of</strong> both types <strong>of</strong> income compensation. <strong>The</strong> financial consequences <strong>of</strong> the abolition<br />
<strong>of</strong> car taxation have been estimated and presented to the individuals. This has not been the<br />
case for those variants where income taxation was lowered. In addition, respondents may<br />
reserve a certain budget for travel related expenses. It may then be justified to spent transport<br />
related bonuses on transport matters, and keeping the number <strong>of</strong> kilometres travelled constant.<br />
Compensation by means <strong>of</strong> income taxation may earlier be used for purposes outside the<br />
transport area reducing the travel budget relatively more.<br />
5.4 Statistical analysis on effectiveness <strong>of</strong> <strong>pricing</strong> measures<br />
<strong>The</strong> previous section discussed the behavioural responses <strong>of</strong> the respondents to three different<br />
<strong>road</strong> <strong>pricing</strong> measures. It appeared that there are differences between purposes and between<br />
measures. But it is unknown whether these aspects have a significantly different impact on the<br />
effectiveness levels <strong>of</strong> the different measures. Moreover, responses may differ by such factors<br />
as income, age, etc. <strong>The</strong> aim <strong>of</strong> this section is to find and interpret factors that have an impact<br />
on the level <strong>of</strong> effectiveness. We will link socio-economic characteristics <strong>of</strong> the respondents,<br />
type <strong>of</strong> measure evaluated and other information available (answers to other questions) to the<br />
trip changes reported by the respondents. We first explain the methodology in Section 5.4.1.<br />
This is followed by the results <strong>of</strong> our analysis.<br />
5.4.1 Methodology<br />
<strong>The</strong> methodology to be applied is motivated by the structure <strong>of</strong> the data. <strong>The</strong> aim is to explain<br />
the level <strong>of</strong> self-reported effectiveness for the various measures. <strong>The</strong> dependent variable is the<br />
fraction <strong>of</strong> the total trips made during 4 weeks that will be adjusted as indicated by the<br />
respondents, i.e. a number between 0 (no change) and 1 (all car trips will be adjusted). Hence,<br />
the effectiveness <strong>of</strong> the measures is defined as the fraction <strong>of</strong> current trips adjusted as a result<br />
90
<strong>of</strong> <strong>pricing</strong>. We have chosen to use the fraction <strong>of</strong> trips for reliability reasons. It was very<br />
difficult for respondents to give an approximation <strong>of</strong> kilometres driven for the various<br />
purposes, let alone the amount that would be changed. <strong>The</strong> information on reported behaviour<br />
is only available for a trip when the respondent indicated that they made that type <strong>of</strong> trip. We<br />
have, therefore, information on behavioural changes for 398 respondents who made<br />
commuting trips, 450 who made social (visits) trips, and 522 respondents who use the car to<br />
go shopping or participate in sports.<br />
<strong>The</strong> dependent variable is not <strong>of</strong> an ordinary type. Because most <strong>of</strong> the people indicate no<br />
change in behaviour, the effectiveness variable is <strong>of</strong>ten a ‘0’. This has consequences for the<br />
appropriate methodology for this type <strong>of</strong> analysis. In order to increase the number <strong>of</strong><br />
observations, we pool the three (for each trip purpose) observations. We keep the data for<br />
each measure (1, 2 and 3) separated. <strong>The</strong>se pooled data sets contain 1370 observations. This<br />
increases the sample size for each measure, while we still have the possibility to correct for<br />
different trip purposes.<br />
<strong>The</strong> structure <strong>of</strong> the dependent variable is such that a standard type <strong>of</strong> regression analysis<br />
(assuming a normal distribution <strong>of</strong> the dependent variable) is not applicable because <strong>of</strong> the<br />
large number <strong>of</strong> zero value observations. Instead, censored regression models, in which the<br />
dependent variable is observed in only some <strong>of</strong> the ranges, are more appropriate. Tobin<br />
(1958) analysed this problem, and formulated a regression model that was later called the<br />
Tobit model. This model is defined as follows when censoring takes places at zero, as in our<br />
case (Maddala, p 151, 1983):<br />
y i = β ' xi<br />
+ ui<br />
if RHS > 0<br />
y = 0 otherwise,<br />
i<br />
where in our case y i is the effect <strong>of</strong> the measure (fraction <strong>of</strong> trips changed) as reported by<br />
individual i; x i is a set <strong>of</strong> explanatory variables; β ' is a vector <strong>of</strong> coefficients to be estimated;<br />
and u i are residuals that are independently and normally distributed, with mean zero and a<br />
common variance. This implies that we consider y i as the observed realisation <strong>of</strong> an<br />
underlying latent variable that describes the intention <strong>of</strong> a respondent to change behaviour.<br />
When this intention is positive, we equate the observed variable to the latent variable. When<br />
the latent variable is zero or smaller than zero, our measurement variable equals zero,<br />
thus y i = 0 . We imposed an upper limit <strong>of</strong> 1 to the dependent variable, since all values <strong>of</strong> the<br />
dependent variable are between 0 and 1. We used the computer program Limdep to obtain the<br />
maximum-likelihood estimates <strong>of</strong> the parameter values for the explanatory variables.<br />
Various specifications <strong>of</strong> the model for all measures (by including variables that may be<br />
expected to have some explanatory power) have been estimated. <strong>The</strong> following tables present<br />
our preferred specifications <strong>of</strong> the Tobit analyses. <strong>The</strong> results presented are the marginal<br />
<strong>effects</strong> on the observed effectiveness (the standard errors also refer to these marginal <strong>effects</strong>).<br />
<strong>The</strong>se coefficients can more easily be interpreted than the standard output <strong>of</strong> the maximumlikelihood<br />
estimates which relate to the latent variable (we refer to Greene (1993) for the<br />
differences in computations). <strong>The</strong> estimations for each type <strong>of</strong> measure have been made with<br />
the same explanatory variables (except for the ‘type <strong>of</strong> measure’ variable), in order to<br />
maximise comparability between the models.<br />
91
5.4.2 Results for measure 1: a kilometre charge (3, 6 and 12 €cents,) and different types <strong>of</strong><br />
revenue use<br />
Table 5.9 presents the estimation results for measure 1. <strong>The</strong> data set contains 1081 zero<br />
observations, leaving 289 observations <strong>of</strong> changed behaviour. <strong>The</strong> first column <strong>of</strong> Table 5.8<br />
presents all explanatory variables that have been included in the estimation. It appears that the<br />
type <strong>of</strong> measure (split into charge level and type <strong>of</strong> revenue use) has a significant impact on<br />
the individual effectiveness scores. As expected, the measures with lower charge levels (3<br />
€cents and 6 €cents compared with 12 €cents) are in general less effective. Abolition <strong>of</strong> car<br />
taxation seems less effective than when revenues are used to lower income taxes. This can be<br />
explained by the fact that with the latter types <strong>of</strong> measures only the extra costs <strong>of</strong> the charge<br />
were presented to the respondent (it was not possible to present a realistic estimation <strong>of</strong> the<br />
benefits <strong>of</strong> lower income taxes). <strong>The</strong> purpose <strong>of</strong> the trips has an impact on the level <strong>of</strong><br />
effectiveness. <strong>The</strong> findings presented in Section 5.3.1 are here confirmed in terms <strong>of</strong> marginal<br />
<strong>effects</strong>. Commuting trips appear significantly less sensitive to <strong>pricing</strong> than ‘other’ and<br />
‘visiting’ trips.<br />
Table 5.9: Estimation results (marginal <strong>effects</strong> on the observed effectiveness) <strong>of</strong> Tobit<br />
analysis with the effectiveness <strong>of</strong> measure 1 as the dependent variable<br />
Variable Tobit y measure 1 Sign.<br />
Constant<br />
Number <strong>of</strong> kilometres driven yearly<br />
Age<br />
Weekly number <strong>of</strong> times in congestion<br />
Income (dummy inc1 ( €68,000)<br />
Type <strong>of</strong> measure (dummy charge 12 = base)<br />
Dummy charge 3 €cents<br />
Dummy charge 6 €cents<br />
Type <strong>of</strong> measure (dummy <strong>road</strong> taxes = base)<br />
Dummy income taxes<br />
Trip purpose (dummy other = base)<br />
Dummy commuting<br />
Dummy visiting<br />
Employed<br />
Dummy yes<br />
Possibility to work at home (dummy not possible<br />
(home2) and unknown (home3) = base)<br />
Working home1 (possible)<br />
Compensation for commuting costs (dummy no<br />
commuting costs or unknown = base)<br />
Comp1 (no costs paid by employer)<br />
Comp2 (costs partly compensated)<br />
Comp3 (full compensation)<br />
Children in household (Yes = base)<br />
No children<br />
-.048 (.315)<br />
-.374E-06 (.31E-06)<br />
-.472E-03 (.45E-03)<br />
-.760E-03 (.45E-03)<br />
-.119 (.048)<br />
.016 (.013)<br />
.003 (.014)<br />
-.047 (.019)<br />
-.052 (.012)<br />
-.033 (.012)<br />
.040 (.010)<br />
-.062 (.014)<br />
.017 (.012)<br />
-.023 (.012)<br />
.027 (.013)<br />
.026 (.019)<br />
.035 (.015)<br />
-.024 (.018)<br />
-.021 (.010) **<br />
N 1370<br />
Log-likelihood -713.946<br />
Notes: <strong>The</strong> standard errors are shown in brackets. *, ** and *** denote significance at the 10%, 5% and 1%<br />
level, respectively, (two-sided t-test).<br />
We have included a dummy for working respondents; but in fact they do not seem to respond<br />
differently from non-working respondents. Within the group <strong>of</strong> employed people driving from<br />
home to work, it does make a difference whether they have the opportunity to work at home<br />
on certain days. This group is more flexible and hence tends to change behaviour sooner than<br />
others who do not have this possibility. Respondents driving to work (at least once a week)<br />
*<br />
**<br />
**<br />
***<br />
***<br />
***<br />
***<br />
**<br />
**<br />
92
who obtain partial compensation for their costs tend to change behaviour sooner than drivers<br />
who have no commuting costs at all (this group may work at home for instance). This result<br />
may have been anticipated for the first group who receive no compensation at all. One<br />
explanation might be that compensation is in many cases rather modest.<br />
Respondents in the highest income category tend to be less price sensitive, and this is also<br />
what we find here. People without children are also less inclined to change behaviour. Other<br />
variables, such as age, car usage (yearly number <strong>of</strong> kilometres), frequency <strong>of</strong> experiencing<br />
congestion, gender (not included) or education (not included and correlated with income) do<br />
not seem to have an important impact on the level <strong>of</strong> self-reported effectiveness.<br />
5.4.3 Results for measure 2: a kilometre charge with multi-step bottleneck toll (2A), and a<br />
kilometre charge differentiated according to weight <strong>of</strong> the vehicle (2B)<br />
Table 5.10 shows the estimation results for the second measure. Because both variants are<br />
very different in nature, we have estimated a model for each variant separately. <strong>The</strong><br />
differences between trip purposes are not significant for measure 2A (which is in line with the<br />
findings <strong>of</strong> Section 5.3.2). Measure 2B tends to have less effect on commuting trips. <strong>The</strong><br />
possibility to work at home is only important for variant 2A, and has, again, an important and<br />
positive impact on the level <strong>of</strong> effectiveness. People may stay at home, or may decide to work<br />
part <strong>of</strong> the day at home and travel at another time to work.<br />
Table 5.10: Estimation results (marginal <strong>effects</strong> on the observed effectiveness) <strong>of</strong> Tobit<br />
analysis with the effectiveness <strong>of</strong> measure 2A and measure 2B as dependent variables<br />
Variable Tobit y measure 2A Sign. Tobit y measure 2B Sign.<br />
Constant<br />
Number <strong>of</strong> kilometres driven yearly<br />
Age<br />
Weekly number <strong>of</strong> times in congestion<br />
Income (dummy inc1( €68,000)<br />
Trip purpose (dummy other = base)<br />
Dummy commuting<br />
Dummy visiting<br />
Employed<br />
Dummy yes<br />
Possibility to work at home (dummy not possible<br />
(home2) and unknown (home3) = base)<br />
Working home1 (possible)<br />
Compensation for commuting costs (dummy no<br />
commuting costs or unknown = base)<br />
Comp1 (no costs paid by employer)<br />
Comp2 (costs partly compensated)<br />
Comp3 (full compensation)<br />
Children in household (Yes = base)<br />
No children<br />
Vehicle weight (dummy weight3 =base)<br />
Weight1<br />
Weight2<br />
-.059 (.048)<br />
-.112E-05 (.81E-06)<br />
-.134E-02 (.75E-03)<br />
.520E-02 (.30E-02)<br />
-.103 (.057)<br />
.309E-02 (.024)<br />
.017 (.024)<br />
-.075 (.033)<br />
-.70E-02 (.021)<br />
.332E-02 (.019)<br />
-.039 (.033)<br />
.052 (.021)<br />
.037 (.032)<br />
.046 (.026)<br />
-.018 (.027)<br />
.30E-02 (.017)<br />
*<br />
*<br />
*<br />
**<br />
**<br />
*<br />
.025 (.034)<br />
-.103E-06 (.26E-06)<br />
-.115E-02 (.49E-03)<br />
.263E-04 (.20E-02)<br />
^<br />
.024 (.016)<br />
.026 (.016)<br />
-.149E-03 (.020)<br />
-.029 (.014)<br />
.291E-02 (.012)<br />
-.097 (.024)<br />
.440E-02 (.013)<br />
.065 (.022)<br />
.037 (.020)<br />
.030 (.023)<br />
-.563E-02 (.011)<br />
-.041 (.018) **<br />
-.032 (.034) **<br />
N 686 684<br />
Log-likelihood -379.446 -271.310<br />
Notes: <strong>The</strong> standard errors are shown in brackets. *, ** and *** denote significance at the 10%, 5% and 1%<br />
level, respectively, (two-sided t-test). ^ This variable has been left out, because the coefficient could not<br />
be estimated.<br />
Measure 2A is a bottleneck charge affecting car drivers during peak hours on congested <strong>road</strong>s.<br />
It is therefore explainable that the measure tends to change the behaviour <strong>of</strong> people who<br />
**<br />
**<br />
***<br />
***<br />
*<br />
93
egularly experience congestion more than others. Measure 2B is differentiated according to<br />
the weight <strong>of</strong> the vehicle; therefore vehicle weight has only been included in this estimation.<br />
We see that the measure has relatively more impact on respondents owning a heavy car which<br />
is rather plausible given the higher charge applying to these car types. Other explanatory<br />
variables <strong>of</strong> the effectiveness <strong>of</strong> measure 2B include the age <strong>of</strong> the respondents (with older<br />
people being less inclined to change), employment (working people tend to change less) and<br />
the compensation <strong>of</strong> commuting costs by the employer. <strong>The</strong> measure has more effect for those<br />
who have to pay these costs themselves, which seems rather plausible.<br />
Section 5.3.2 suggested that measure 2A has more effect on the number <strong>of</strong> trips that people<br />
change than measure 2B (especially for commuting trips). We have tested this by estimating<br />
one model on the total data set and including a dummy variable for the variant. <strong>The</strong> statistical<br />
results confirm that measure 2A is more effective: the estimated coefficient <strong>of</strong> the dummy<br />
variable for measure 2B is negative and significant. This can to a large extent be explained by<br />
the effect on commuting trips. Commuters tend to be more sensitive to a bottleneck charge<br />
than to a flat kilometre charge.<br />
5.4.4 Results for measure 3: a peak and <strong>of</strong>f-peak kilometre charge, with different revenue<br />
use<br />
<strong>The</strong> third measure that we have analysed consists <strong>of</strong> a kilometre charge with an additional<br />
coarse peak charge during peak hours. <strong>The</strong> variants differ in charge levels and type <strong>of</strong> revenue<br />
use. In Section 5.3.3, we concluded that the impact <strong>of</strong> the type <strong>of</strong> measure on the level <strong>of</strong><br />
effectiveness was not entirely clear. <strong>The</strong> outcomes in Table 5.11 confirm this result. <strong>The</strong> level<br />
<strong>of</strong> the charge is less significant, and the type <strong>of</strong> revenue use is not significant at all. <strong>The</strong><br />
individual costs and the benefits, however, were presented differently to the respondents than<br />
for measure 1. <strong>The</strong> difference is that here the level <strong>of</strong> the charge depends on the time <strong>of</strong><br />
driving. And, since we did not have information on the number <strong>of</strong> kilometres driven during<br />
these peak periods, we decided to present both extremes to each respondent (costs when all or<br />
no kilometres are driven during peak hours). While the <strong>of</strong>f-peak charges are lower than with<br />
measure 1, the peak charges are considerably higher. <strong>The</strong> benefits from lower car taxation<br />
may be perceived by the respondents as being rather low, which may explain the stronger<br />
effectiveness levels for measure 3 relative to measure 1 for the first three variants. This may<br />
then also be an explanation for the low level <strong>of</strong> significance <strong>of</strong> revenue use here (Section 5.3.3<br />
suggests that income taxation is more effective, but apparently the differences were only very<br />
marginal). <strong>The</strong> lower coefficient <strong>of</strong> the dummy for charge level 6 €cents than for that <strong>of</strong> 12<br />
€cents (suggesting a less negative effect) confirms the findings in Table 5.7 which says that<br />
the 6 €cent charge is more effective than the higher 12 €cent charge. But both coefficients are<br />
not statistically different from each other (based on a comparison <strong>of</strong> the 90% confidence<br />
intervals for both coefficients).<br />
In contrast with the previous measures, we find that employment does make a difference.<br />
Employed respondents (not necessarily making a commuting trip by car) seem to be less<br />
tempted to change behaviour in general (for all type <strong>of</strong> trips). Also new is the importance <strong>of</strong><br />
the number <strong>of</strong> times during a week that people usually experience congestion. This measure<br />
leads to more trip adjustments among car drivers who drive regularly in congestion. <strong>The</strong><br />
structure <strong>of</strong> the measure, mainly affecting peak-hour drivers (when congestion is usually most<br />
severe), is the most likely reason for this. Similar to the previous measures, we find a<br />
significant impact (with the expected sign) <strong>of</strong> the possibility to work at home. This measure<br />
has no differentiated effect on trips made for a certain purpose. This finding corresponds with<br />
the results presented in Table 5.6, where effect sizes are similar for the different purposes.<br />
Respondents with a higher income are also less price sensitive here, which is rather plausible.<br />
Finally, it appears that the compensation <strong>of</strong> commuting costs by employers is important for<br />
94
the self-reported effectiveness <strong>of</strong> this measure. Those who receive only partial compensation<br />
seem to be willing to change behaviour relatively more than others. Strangely (and similar to<br />
the findings for measure 1), there is no such effect among people who are not compensated<br />
(and nor is there an opposite effect for fully-compensated respondents).<br />
Table 5.11: Estimation results (marginal <strong>effects</strong> on the observed effectiveness) <strong>of</strong> Tobit<br />
analysis with the effectiveness <strong>of</strong> measure 3 as the dependent variable<br />
Variable Tobit y measure 3 Sign.<br />
Constant<br />
Number <strong>of</strong> kilometres driven yearly<br />
Age<br />
Weekly number <strong>of</strong> times in congestion<br />
Income (dummy inc1( €68,000)<br />
Type <strong>of</strong> measure (dummy charge 24 = base)<br />
Dummy charge 6 €cents<br />
Dummy charge 12 €cents<br />
Type <strong>of</strong> measure (dummy <strong>road</strong> taxes = base)<br />
Dummy income taxes<br />
Trip purpose (dummy other = base)<br />
Dummy commuting<br />
Dummy visiting<br />
Employed<br />
Dummy yes<br />
Possibility to work at home (dummy not possible<br />
(home2) and unknown (home3) = base)<br />
Working home1 (possible)<br />
Compensation for commuting costs (dummy no<br />
commuting costs or unknown = base)<br />
Comp1 (no costs paid by employer)<br />
Comp2 (costs partly compensated)<br />
Comp3 (full compensation)<br />
Children in household (Yes = base)<br />
No children<br />
-.035 (.045)<br />
-.634E-06 (.47E-06)<br />
-.884E-03 (.67E-03)<br />
.652E-02 (.26E-02)<br />
-.200 (.069)<br />
-.061 (.021)<br />
-.017 (.021)<br />
-.056 (.026)<br />
-.024 (.018)<br />
-.039 (.018)<br />
.019 (.015)<br />
.021 (.019)<br />
.027 (.018)<br />
-.108 (.032)<br />
.058 (.018)<br />
.040 (.030)<br />
.058 (.024)<br />
.021 (.027)<br />
.163E-02 (.015)<br />
N 1370<br />
Log-likelihood -907.408<br />
Notes: <strong>The</strong> standard errors are shown in brackets. *, ** and *** denote significance at the 10%, 5% and 1%<br />
level, respectively, (two-sided t-test).<br />
5.5 Car ownership<br />
It is generally acknowledged that the level <strong>of</strong> car ownership depends, inter alia, on the<br />
available income, household structure, and the costs <strong>of</strong> car use and car ownership. However,<br />
the relationship between <strong>pricing</strong> and car ownership has less <strong>of</strong>ten been studied as discussed in<br />
Chapter 3. Research has been done on the <strong>effects</strong> <strong>of</strong> fuel prices on car stock (see, e.g.,<br />
Goodwin, 1992). <strong>The</strong> <strong>effects</strong> are likely to be modest (with elasticities <strong>of</strong> around -0.2), and<br />
lower than the <strong>effects</strong> on fuel consumption. But the increased policy interest for<br />
variabilisation in the Netherlands also entailed increasing attention for the impact <strong>of</strong> this<br />
measure on vehicle ownership. <strong>The</strong> impact on car ownership is ambiguous due to the change<br />
in costs (lower fixed costs and higher variable costs). People without a car may decide to<br />
purchase one after variabilisation, as cars become cheaper to own. <strong>The</strong>oretically one may<br />
expect that this will lead to an increase in car ownership. However, modelling studies have<br />
shown some mixed results on this. A stated preference survey by MuConsult in 2002 does<br />
indeed report an increase <strong>of</strong> car ownership when variabilisation is implemented (by an<br />
average <strong>of</strong> 3%). <strong>The</strong> effect <strong>of</strong> car owners deciding to sell their car was present (ranging from<br />
**<br />
***<br />
***<br />
**<br />
**<br />
***<br />
***<br />
**<br />
95
1.3% (MRB only) to 4.6% (MRB and BPM)), but the effect on people buying an extra car or<br />
a new car (by respondents presently not owning a car) was higher.<br />
This suggests that it is not completely clear what can be expected; much depends on the price<br />
structure and the type <strong>of</strong> revenue allocation. Variabilisation tends to increase car ownership,<br />
while <strong>road</strong> <strong>pricing</strong> alone seems to have a (mild) limiting effect on the car stock. But, given the<br />
few studies done, and the uncertainties in effect sizes, there is scope for further research on<br />
this issue. Below, we present the findings on a few car ownership questions that we included<br />
in our survey.<br />
5.5.1 Survey<br />
After questions about each measure, we asked whether the respondents would consider selling<br />
their car. With measure 2 (including a variant that is differentiated according to the weight <strong>of</strong><br />
the car), we added the possibility <strong>of</strong> replacing their existing car with a heavier vehicle or with<br />
a lighter one. Buying a heavier car may seem implausible (due to the higher charge for<br />
measure 2B), but this may happen due to the abolition <strong>of</strong> fixed taxes on car ownership and car<br />
purchase (in that event owners <strong>of</strong> a heavy car have relatively more financial benefits, given<br />
the higher existing taxes).<br />
In addition to these questions, we have added a fourth measure to analyse the “opposite” <strong>of</strong><br />
variabilisation on car ownership, where fixed taxes are increased and variable taxes<br />
decreased. <strong>The</strong> reason for adding this measure is that, unfortunately, the survey did not allow<br />
us to include respondents who at present do not own a car. However, the expected impact <strong>of</strong><br />
variabilisation on car ownership levels depends to a large extent on the reaction <strong>of</strong> these<br />
people. Still, to get an impression <strong>of</strong> the behavioural response (in terms <strong>of</strong> car ownership) to<br />
variabilisation <strong>of</strong> the group that is close to indifference about owning a car (but owns a car<br />
now and is therefore included in our sample), we considered a measure that was the opposite<br />
<strong>of</strong> variabilisation. An increase <strong>of</strong> the fixed costs and a decrease <strong>of</strong> variable costs may<br />
stimulate people to sell (one <strong>of</strong>) their car(s). <strong>The</strong> measure (we call this measure 4) was<br />
presented as an increase <strong>of</strong> car ownership taxes by €150 per year (independent <strong>of</strong> car type)<br />
and a decrease <strong>of</strong> the fuel price by 10 €cents per litre (as an average for all fuel types). Since<br />
we know the yearly number <strong>of</strong> kilometres driven and the fuel type <strong>of</strong> the car for each<br />
respondent, it was possible to estimate the financial consequences on a yearly basis.<br />
Hopefully, the reactions <strong>of</strong> car owners who are close to selling their car are a good indicator<br />
for the reactions <strong>of</strong> people currently not having a car, but consider buying one. Note that there<br />
may be some asymmetry between car owners and non-car owners. <strong>The</strong> group that have only<br />
just decided to buy a car (who can be part <strong>of</strong> the sample) may be less inclined to give up car<br />
ownership because <strong>of</strong> perceived benefits <strong>of</strong> car usage and the probability <strong>of</strong> losing money<br />
when selling the car again.<br />
This all means that we analyse four questions in total. In addition, we asked the respondents<br />
how probable it is that they would sell one <strong>of</strong> their cars, or in case <strong>of</strong> measure 2 also how<br />
likely it is that they will buy another type <strong>of</strong> car. People could indicate this probability on a 7point<br />
scale, ranging from ‘very unlikely’ to ‘very likely’.<br />
5.5.2 Results for measures 1, 2 and 3<br />
Table 5.12 shows the mean results and the percentages answering ‘very likely’ and ‘likely’.<br />
<strong>The</strong> differences between the measures are rather small, with an average score on the question<br />
whether people will sell their car <strong>of</strong> about 1.6 (with 2 being ‘unlikely’ and 1 ‘very unlikely’).<br />
This score is confirmed by the percentages <strong>of</strong> respondents answering ‘likely’ or ‘very likely’:<br />
about 2% <strong>of</strong> the respondents chose one <strong>of</strong> these two categories. <strong>The</strong>se <strong>effects</strong> seem very<br />
marginal, but are in the range <strong>of</strong> results <strong>of</strong> variabilisation among car owners found by<br />
96
MuConsult (2002) (finding that 1.4% to 4.6% <strong>of</strong> the respondents indicated that they would<br />
sell their car).<br />
<strong>The</strong> differences in the probability scores (although modest) could be explained by the<br />
different structures <strong>of</strong> the measures. This may be difficult because the variabilisation<br />
measures (1A to 1C and 3A to 3C) contain two opposing <strong>effects</strong>, for which the overall<br />
consequences for car ownership (and the decision to sell a car or not) are hard to predict. On<br />
the one hand, the fixed tax decreases (providing an incentive to keep a car), while on the<br />
other, a price per kilometre replaces these (discouraging car use and indirectly ownership).<br />
<strong>The</strong> presence <strong>of</strong> opposing <strong>effects</strong> becomes clear when looking at the results. A higher charge<br />
does not lead to higher probabilities <strong>of</strong> selling a car, both for measure 1 and measure 3.<br />
Variants D to F for measures 1 and 3 do not include compensation by means <strong>of</strong> lower fixed<br />
car taxes, so one may expect higher probabilities <strong>of</strong> selling when comparing alternatives with<br />
equal charge levels. Comparing D with A, E with B and C with F, this is indeed the case for<br />
measure 1 but not for measure 3, which is strange. But differences are very small and not<br />
significantly different from each other. <strong>The</strong>se ambiguous findings for car ownership for<br />
measure 3 are similar to the results on effectiveness in Sections 5.3.3 and 5.4.4 for the same<br />
measure.<br />
Table 5.12: Mean <strong>of</strong> probability scores on each type <strong>of</strong> measure (level 1 = very unlikely; level<br />
7 = very likely)<br />
Measures<br />
1A (3 €cents/MRB)<br />
1B (6 €cents/MRB+BPM)<br />
1C (12 €cents/MRB+BPM+<strong>road</strong>s)<br />
1D (3 €cents/income taxes)<br />
1E (6 €cents/income taxes)<br />
1F (12 €cents/income taxes)<br />
2A: multi-step bottleneck toll<br />
2B: km charge weight vehicle<br />
3A: 2/6 €cents (<strong>of</strong>f-peak/peak), MRB<br />
3B: 4/12 €cents, MRB+BPM<br />
3C: 8/24 €cents, MRB+BPM+ <strong>road</strong>s<br />
3D: 2/6 €cents, income taxes<br />
3E: 4/12 €cents, income taxes<br />
3F: 8/24 €cents, income taxes<br />
How probable is it<br />
that you would sell<br />
your car?<br />
Mean % very<br />
likely or<br />
likely<br />
1.41<br />
1.35<br />
1.66<br />
1.57<br />
1.75<br />
1.68<br />
1.54<br />
1.53<br />
1.64<br />
1.73<br />
1.68<br />
1.53<br />
1.67<br />
1.75<br />
2.1<br />
1.1<br />
1.1<br />
3.0<br />
3.3<br />
4.3<br />
2.5<br />
1.4<br />
2.1<br />
5.5<br />
1.0<br />
0<br />
3.2<br />
1.1<br />
How probable is it that<br />
you would replace it by<br />
a heavier car?<br />
Mean % very<br />
likely or<br />
likely<br />
1.91<br />
1.75<br />
2.2<br />
0.7<br />
How probable is it that<br />
you would replace it by<br />
a car with less weight?<br />
Mean % very<br />
likely or<br />
likely<br />
Measure 2 seems to generate a slightly lower probability <strong>of</strong> selling the car. Both variants do<br />
indeed include an abolition <strong>of</strong> fixed taxation and modest charge levels compared with the<br />
other measures. However, measure 2A may have considerable financial consequences for<br />
those driving in peak hours. But most <strong>of</strong> these drivers are commuters who are relatively more<br />
car-dependent and less inclined to sell their car.<br />
After the questions on measure 2, we also asked about the respondents’ intention to replace<br />
their car by another type (lighter or heavier), because measure 2B was differentiated<br />
according to the weight <strong>of</strong> the vehicle. <strong>The</strong> intention to sell a car may be low, but the intention<br />
to replace a car appears to be somewhat higher. Respondents tend to consider the purchase <strong>of</strong><br />
a car with less weight more seriously, especially if a weight-differentiated measure is<br />
implemented with the replacement <strong>of</strong> both MRB and BPM (a score <strong>of</strong> 2.79, 3 is ‘a bit<br />
unlikely’). <strong>The</strong> differences with measure 2A are explainable: this is a peak-hour measure not<br />
2.08<br />
2.79<br />
3.5<br />
9.7<br />
97
differentiated according to weight. People are less inclined to buy a heavier car if the charge<br />
for this type <strong>of</strong> cars is higher.<br />
5.5.3 Results for measure 4: an increase <strong>of</strong> car ownership taxes and decrease <strong>of</strong> fuel costs<br />
Table 5.13 shows that most respondents, as expected, will not sell their car (or one <strong>of</strong> their<br />
cars). A few respondents (1.6%) do seriously consider giving up car ownership. This may<br />
suggest that the effect <strong>of</strong> non-car owners buying a car may also be limited. However, we<br />
should not forget that both groups are not necessarily equal and comparable. For instance,<br />
respondents who have recently purchased a car may not be very much inclined to give up<br />
their car soon afterwards. This makes comparison with other findings difficult, but<br />
nevertheless interesting. MuConsult (2002) find that 9% <strong>of</strong> the households without a car will<br />
buy a car after variabilisation <strong>of</strong> the MRB only (with an average charge <strong>of</strong> 2.5 €cents). We<br />
decrease the variable costs by 10 €cents/litre, which is about 0.85 €cent/kilometre for petrol<br />
cars (one third <strong>of</strong> the charge in MuConsult (2002)). Assuming that all respondents answering<br />
‘very likely’ will sell their car, 75% <strong>of</strong> category 6 (‘likely’), and 50% <strong>of</strong> the people who<br />
indicated ‘a bit likely’, we find that 2.8% will give up using their car - nearly one-third <strong>of</strong> the<br />
percentage <strong>of</strong> MuConsult. Correcting for the differences in charge levels, the results then<br />
seem surprisingly close (given the differences in methods). Of course, the percentages<br />
assigned to the different categories are a bit arbitrary, but they do not seem wildly unrealistic.<br />
Table 5.13: Probability <strong>of</strong> selling the car if measure 4 would be implemented<br />
Score Number <strong>of</strong> respondents (% <strong>of</strong> total)<br />
1: very unlikely<br />
340 (60.5)<br />
2: unlikely<br />
153 (27.2)<br />
3: a bit unlikely<br />
23 (4.1)<br />
4: not likely, not unlikely<br />
21 (3.7)<br />
5: a bit likely<br />
16 (2.8)<br />
6: likely<br />
5 (0.9)<br />
7: very likely<br />
4 (0.7)<br />
Finally, it is interesting to analyse these probability scores. For instance, one may wonder<br />
whether the people doubting about car ownership have a relatively lower income. Various<br />
econometric techniques are <strong>of</strong> course available that can be used to investigate the relation<br />
between various variables. <strong>The</strong> methodology to be applied depends to a large extent on the<br />
structure <strong>of</strong> the data. Here, the aim is first to explain the probability level <strong>of</strong> selling a car,<br />
where the dependent variable consists <strong>of</strong> a choice out <strong>of</strong> an ordered set <strong>of</strong> probability variants.<br />
Given this framework, the ordered probit (OP) technique seems to be most appropriate (see<br />
for discussion <strong>of</strong> OP Maddala (1983)). Ordinary Least Squares (OLS), which assumes an<br />
unbounded continuous dependent variable, is less appropriate, although it would have had the<br />
advantage <strong>of</strong> more easily interpretable coefficients.<br />
<strong>The</strong> underlying response model for an OP estimation is <strong>of</strong> the following form (see Davidson<br />
and MacKinnon, 1993):<br />
PROB * = β ' X i + ε.<br />
<strong>The</strong> underlying continuous response variable PROB* is unobserved, X is the vector <strong>of</strong><br />
explanatory variables, β gives the vector <strong>of</strong> coefficients, and ε is the residual. <strong>The</strong> observed<br />
discrete response variable PROB is related to PROB* as follows:<br />
PROB = 1 if PROB * ≤ μ1<br />
,<br />
PROB = 2 if μ 1 ≤ PROB * < μ 2 ,<br />
= 3 μ ≤ PROB < ,<br />
PROB if 2 * μ3<br />
98
:<br />
PROB = 7 if μ 6 ≤ PROB * .<br />
<strong>The</strong> μ’s (threshold values in the model output) are unknown parameters to be estimated<br />
jointly with β, and the model assumes that ε is normally distributed across observations. <strong>The</strong><br />
constants μ therefore divide the domain <strong>of</strong> PROB* into 7 segments, which corresponds with<br />
observations <strong>of</strong> the discrete response variable. <strong>The</strong> model estimates probability intervals for<br />
the seven possible answers:<br />
Prob ( Z ij = J ) = Φ(<br />
μ j − β ' X i ) − Φ(<br />
μ j−<br />
1 − β ' X i )<br />
where Φ is the cumulative standard normal, and Zij=J represents each probability score. <strong>The</strong><br />
interpretation <strong>of</strong> the estimated coefficients is not straightforward. <strong>The</strong> estimated coefficients<br />
for the included explanatory variables can be interpreted as indications <strong>of</strong> shifting the<br />
distribution to the left or the right depending on the sign <strong>of</strong> the β’s. Assuming that β is<br />
positive, this means that that the probability <strong>of</strong> the leftmost category (in this case PROB=1)<br />
must decline. At the same time we are shifting some probability into the rightmost cell<br />
(PROB=7). But what happens to the middle cells is ambiguous and is dependent on the local<br />
densities. Hence, we must be very careful in interpreting the coefficients in this model (see<br />
Greene, 1993). <strong>The</strong> values <strong>of</strong> the coefficients can more easily be interpreted in a relative<br />
sense: a larger value denotes a larger marginal impact.<br />
Table 5.14 presents the coefficients and significance <strong>of</strong> the variables that have been included<br />
in the model estimation (for an explanation <strong>of</strong> the variables, see Appendix 5b). <strong>The</strong> first row<br />
presents the estimates for the thresholds values μ’s explained above. <strong>The</strong> second row presents<br />
all explanatory variables. <strong>The</strong>se variables have been selected on the criterion <strong>of</strong> expected<br />
relevance.<br />
It appears that not very many variables have a significant impact on the probability to sell one<br />
<strong>of</strong> the cars available. <strong>The</strong> expected effect <strong>of</strong> income is present, but not as strong as expected.<br />
Only the lowest income group has a higher probability to sell the car (but only significant at<br />
the 10% level). We have also tested the impact <strong>of</strong> education instead <strong>of</strong> income, but the results<br />
were not different. Younger people (with lower incomes) generally have a higher probability<br />
<strong>of</strong> selling their car. <strong>The</strong>se may, for instance, be students who buy very cheap second-hand<br />
cars for which the fixed taxes become a (too) high burden. Location has been included to test<br />
for responses by city people. Parking problems in city centres and good public transport<br />
accessibility may be an incentive for residents with a car to reconsider ownership sooner than<br />
people living in more rural areas. But the results do not confirm this assumption.<br />
Respondents driving many kilometres may be less tempted to sell their cars than others<br />
because <strong>of</strong> the lower variable costs, and a presumably greater dependence on the car, but<br />
again this is not confirmed by the results. <strong>The</strong> number <strong>of</strong> cars available in households, in<br />
contrast, is important. People with (only) one car available seem to be less tempted to give up<br />
their car than households who own more cars. Apparently, the presence <strong>of</strong> at least one car is<br />
important; it will be easier to consider having more than one car if fixed and variable costs are<br />
changed.<br />
<strong>The</strong>se results reveal some <strong>of</strong> the characteristics <strong>of</strong> the group that reconsiders car ownership<br />
when fixed and variable costs change. Our results suggest that variabilisation tends to increase<br />
car ownership especially among younger people with lower incomes. In most cases vehicles<br />
will be bought, with increasing levels <strong>of</strong> households having a second or third car as a<br />
consequence. However, it is still recommended to conduct more in-depth research on car<br />
ownership behaviour among non-car owners in order to obtain better insight into the <strong>effects</strong> <strong>of</strong><br />
variabilisation on car ownership levels.<br />
99
Table 5.14: Results <strong>of</strong> ordered probit analysis with the probability to sell the car as the<br />
dependent variable<br />
Variable Probit ACC measure 4 Sign.<br />
Threshold (μ’s)<br />
μ 1<br />
μ 2<br />
μ 3<br />
μ 4<br />
μ 5<br />
μ 6<br />
Gender (female)<br />
Income (dummy inc4 (>€68,000) = base)<br />
Inc1 (< €28,500)<br />
Inc2 (€28,500-45,000)<br />
Inc3 (€45.000-68.000)<br />
Incunk (income unknown)<br />
Residence location (dummy loc 5 (south) =base)<br />
Loc1 (3 large cities)<br />
Loc2 (rest west)<br />
Loc3 (north)<br />
Loc4 (east)<br />
Fuel type (dummy fuel3 (gas) = base)<br />
Fuel1 (petrol)<br />
Fuel2 (diesel)<br />
Age (other dummies = base)<br />
Age1 (18-25)<br />
Car ownership (dummy car3 (3 or more cars) = base)<br />
Car1 (1 car)<br />
Car2 (2 cars)<br />
Number <strong>of</strong> kilometres driven yearly<br />
Vehicle weight (dummy weight3 (heavy) = base)<br />
Weight1 (low weight)<br />
Weight2 (middle weight)<br />
-.638 (.410)<br />
.321 (.409)<br />
.574 (.410)<br />
.921 (.413)<br />
1.426 (.423)<br />
1.755 (.441)<br />
-.123 (.114)<br />
.354 (.182)<br />
.016 (.166)<br />
-.009 (.160)<br />
.146 (.321)<br />
-.096 (.173)<br />
.064 (.140)<br />
.289 (.218)<br />
.122 (.151)<br />
-.090 (.268)<br />
-.207 (.276)<br />
.322 (.189)<br />
-1.238 (.274)<br />
-.663 (.273)<br />
-2.77E-07 (.000)<br />
N<br />
.198 (.161)<br />
.043 (.135)<br />
562<br />
Log-likelihood -568.083 ***<br />
Pseudo R-square Cox and Snell .094<br />
Nagelkerke .106<br />
McFadden .045<br />
Notes: <strong>The</strong> standard errors are shown in brackets. *, ** and *** denote significance at the 10%, 5% and 1%<br />
level, respectively, (two-sided t-test).<br />
5.6 Conclusions<br />
<strong>The</strong> major contribution <strong>of</strong> this chapter lies in the attractiveness <strong>of</strong> the various alternatives for<br />
current <strong>road</strong> use and the impact <strong>of</strong> individual characteristics on the intention to change<br />
behaviour. Previous research has suggested that <strong>road</strong> use will most likely decline after<br />
variabilisation, but less is known about choosing alternatives.<br />
<strong>The</strong> results presented in this chapter confirm that <strong>road</strong> <strong>pricing</strong> may have considerable <strong>effects</strong>,<br />
but much depends on the design <strong>of</strong> the measure. In terms <strong>of</strong> trips adjusted, the effectiveness <strong>of</strong><br />
the measures is in the range <strong>of</strong> 6% to 15% for all purposes. <strong>The</strong> effect in terms <strong>of</strong> kilometres<br />
is somewhat smaller, comparable with results found in a similar study (which included noncar<br />
owners) by MuConsult (2002). <strong>The</strong>re are considerable differences between trip purposes,<br />
with commuting generally being least sensitive (well-known from the literature) when the<br />
charge is time-independent. Trips made to visit people or for shopping reasons will be<br />
modified first with non motorised transport (walking, cycling) being the most chosen<br />
alternative for the car. This suggests that car use for short-distance trips will be reconsidered,<br />
even if a flat kilometre charge is implemented. Note, however, that our sample includes<br />
relatively few elderly for whom walking or cycling may not always be an option.<br />
When policy makers want to affect peak-time (commuting) <strong>road</strong> traffic, a time-differentiated<br />
measure seems most appropriate. <strong>The</strong> kilometre charge with additional peak charge is the<br />
**<br />
***<br />
***<br />
*<br />
*<br />
***<br />
**<br />
100
most effective overall, especially for commuting trips. Governments should be aware that the<br />
implementation <strong>of</strong> these (time-dependent) charges most probably leads to driving at other<br />
times, especially for commuting trips. Commuting trips are necessary (working at home or<br />
not making the trip are not serious options for most <strong>of</strong> the respondents), but there seems to be<br />
some level <strong>of</strong> flexibility which allows scheduling <strong>of</strong> trips.<br />
<strong>The</strong> impact <strong>of</strong> the type <strong>of</strong> measure is not straightforward. Previous research and common<br />
sense suggest that higher kilometre charges should have more impact. Our results are<br />
somewhat mixed on this issue and are difficult to explain. <strong>The</strong> statistical analysis confirms<br />
that a time-differentiated measure has more effect on drivers who experience congestion<br />
(most <strong>of</strong> them being commuters). This does not hold for a flat kilometre charge. Charge levels<br />
seem to matter when a flat fee is considered (higher charges have more effect), but this seems<br />
<strong>of</strong> less importance if considerable peak and <strong>of</strong>f-peak fees are implemented. <strong>The</strong> effect <strong>of</strong><br />
revenue use seems clear when considering the aggregated outcomes: revenues allocated to<br />
lower income taxes generally have more effect (but not significantly different for the<br />
peak/<strong>of</strong>f-peak measure). This may partly be explained by the ‘perceived’ income effect, as it<br />
is caused by the design <strong>of</strong> the questionnaire. An estimate <strong>of</strong> the benefit from revenue<br />
recycling could be calculated and shown to the respondent for car tax reductions, but not for<br />
income tax reductions.<br />
We have also tested the effect <strong>of</strong> several individual characteristics on effectiveness, whereas<br />
previous studies mostly focused only on income. Despite the fact that working at home is not<br />
always a feasible option, it appears that the possibility to do this is an important explanatory<br />
variable. People having this possibility tend to be more flexible and change behaviour more<br />
than others. Road users driving many kilometres are not particularly more sensitive to any<br />
form <strong>of</strong> <strong>road</strong> <strong>pricing</strong>. One <strong>of</strong> the previous studies found that people with a higher income tend<br />
to reduce kilometres driven less strongly than those with a lower income. We also find this<br />
effect, but in most cases only for the very highest income category.<br />
Road <strong>pricing</strong> can have considerable consequences for <strong>road</strong> usage, but policy makers should<br />
not forget that it may also affect car ownership (and indirectly also <strong>road</strong> use). <strong>The</strong> <strong>effects</strong> <strong>of</strong><br />
<strong>road</strong> <strong>pricing</strong> and revenue recycling on the car stock are an as yet unsettled issue, given the<br />
mixed results in the literature. Our results indicate that about 2% <strong>of</strong> the respondents most<br />
probably will sell their car, or one <strong>of</strong> their cars, if a variable charge is implemented. Variation<br />
between measures is low, indicating that revenue use and type <strong>of</strong> charge have a minor impact<br />
on car ownership. It seems strange that there is no, or only a very small, difference between<br />
the case where revenues are used to abolish existing car taxes and where income taxes are<br />
lowered. Our results show that the measure that is <strong>of</strong>ten proposed to realise a more fuelefficient<br />
car stock, a weight differentiated charge, may actually have such an effect. It does<br />
not only have more effect among heavy vehicle owners, but the results also indicate that<br />
respondents seriously consider buying a smaller (more fuel-efficient) type <strong>of</strong> vehicle.<br />
We have also considered the opposite <strong>of</strong> variabilisation, with the aim to analyse behaviour <strong>of</strong><br />
(car-owning) respondents if car ownership becomes more expensive. This may give an<br />
approximation <strong>of</strong> the intentions <strong>of</strong> non-car owners to buy a car after a variabilisation <strong>of</strong> taxes,<br />
because these respondents in some sense belong to the same group <strong>of</strong> people who are<br />
currently near indifference in terms <strong>of</strong> car ownership. <strong>The</strong> case where <strong>road</strong> <strong>pricing</strong> is<br />
implemented and revenues are recycled by an abolition <strong>of</strong> ownership taxes may lead to a<br />
reduction <strong>of</strong> car use, or at least a change in mobility patterns. However, policy makers should<br />
not forget that car usage may increase if non-car owners decide to buy a car. Our findings<br />
suggest that only a few respondents (1.6%) would seriously consider giving up car ownership.<br />
Given the assumed asymmetry between both groups (car owners and non-car owners), the<br />
similarity <strong>of</strong> this finding with the result <strong>of</strong> another study among non-car owners to buy a car<br />
after variabilisation (MuConsult 2002) is remarkable. A statistical analysis revealed that<br />
101
younger people and households owning two or more cars are more likely to sell their (one <strong>of</strong><br />
their) car(s), which suggests that the total number <strong>of</strong> kilometres driven will only slightly be<br />
reduced (or increase in the case <strong>of</strong> variabilisation).<br />
Finally, it is hard to determine whether or not these results can be generalised to other<br />
countries. For example, the availability (e.g. <strong>of</strong> public transport) and inherent popularity <strong>of</strong><br />
alternatives (e.g. cycling) may differ between countries; the spatial structure may be different,<br />
and many other factors may cause further deviations. Although it is tempting to present, for<br />
example, the conclusion on the importance <strong>of</strong> time-differentiation <strong>of</strong> charges for effectiveness<br />
in commuting as a more general result, we cannot draw such conclusions from our study and<br />
therefore leave it as material for further (local) study.<br />
102
Appendix 5A<br />
Description <strong>of</strong> measures<br />
Measure Variants<br />
1: Flat kilometre charge, with<br />
different revenue allocations<br />
2: Flat kilometre charge, with<br />
additional bottleneck charge<br />
(2A) or differentiated<br />
according to weight <strong>of</strong> the<br />
car (2B)<br />
3: Peak and <strong>of</strong>f-peak<br />
kilometre charge and<br />
different revenue allocations<br />
A: 3 €cents, revenues used to abolish car ownership taxes (MRB)<br />
B: 6 €cents, revenues used to abolish existing car taxation (purchase<br />
(BPM) and ownership (MRB))<br />
C: 12 €cents, revenues used to abolish existing car taxation and construct<br />
new <strong>road</strong>s<br />
D: 3 €cents, revenues used to lower income taxes<br />
E: 6 €cents, revenues used to lower income taxes<br />
F: 12 €cents, revenues used to lower income taxes<br />
A: 2 €cents, additional multi-step toll during peak times (morning and<br />
evening) on working days at daily bottlenecks: 6:00-7:00 € 0.50; 7:00-<br />
7:30 € 1.00; 7:30-8:00 € 1.75; 8:00-8:30 € 2.50; 8:30-9:00 € 1.75; 9:00-<br />
9:30 € 1.00; 9:30-10:00 € 0.50. <strong>The</strong> same structure for the evening peak<br />
(16.00-20.00). Revenues used to abolish car ownership taxes (MRB)<br />
B: Light cars pay 4 €cents per kilometre; middle weight cars pay 6 €cents<br />
per kilometre; heavy cars pay 8 €cents per kilometre, revenues used to<br />
abolish existing car taxation (MRB and BPM)<br />
A: 2 €cents outside peak times and 6 €cents in peak on working days<br />
(7.00-9.00 and 17.00-19.00), abolition <strong>of</strong> car ownership taxes<br />
B: 4 €cents outside peak times and 12 €cents in peak on working days<br />
(7.00-9.00 and 17.00-19.00), abolition <strong>of</strong> existing car taxation<br />
C: 8 €cents outside peak times and 24 €cents in peak on working days<br />
(7.00-9.00 and 17.00-19.00), abolition <strong>of</strong> existing car taxation and new<br />
<strong>road</strong>s<br />
D: 2 €cents outside peak times and 6 €cents in peak on working days<br />
(7.00-9.00 and 17.00-19.00), revenues used to lower income taxes<br />
E: 4 €cents outside peak times and 12 €cents in peak on working days<br />
(7.00-9.00 and 17.00-19.00), revenues to lower income taxes<br />
F: 8 €cents outside peak times and 24 €cents in peak on working days<br />
(7.00-9.00 and 17.00-19.00), revenues used to lower income taxes<br />
4: Opposite <strong>of</strong> variabilisation An increase <strong>of</strong> car ownership taxes by €150, together with a decrease <strong>of</strong><br />
fuel costs by 10 €cents/litre.<br />
103
Appendix 5B<br />
Explanation and population share <strong>of</strong> explanatory (dummy)<br />
variables in the original data set (N=562)<br />
Variable Type<br />
Levels<br />
Gender Dummy Male (61.2%); Female (38.8%)<br />
Age Continuous<br />
and dummies<br />
(Section 5.6)<br />
Age1: 18-25 (7.3 %); Age2: 26-35 (31.0%); Age3:<br />
36-45 (26.6%); Age4: 46-55 (18.9%); Age5: 56-65<br />
(9.1%); Age6: 65+ (7.1%)<br />
Income (gross yearly) Dummies Inc1: less than € 28,500 (21.4%); Inc2: € 28,500-<br />
45,000 (31.5%); Inc3: € 45,000-68,000 (28.5%);<br />
Inc4: more than € 68,000 (15.7%); Inc5: do not<br />
know or won’t say (3.0%)<br />
Weekly number <strong>of</strong> times in congestion Continuous<br />
Employed Dummy Employed (82.7%); Not employed (17.3%)<br />
Trip purpose (effect <strong>of</strong> measure on type <strong>of</strong> Dummies Dummy commuting (29%), Dummy visiting (33%),<br />
car trip) (for N = 1370)<br />
Dummy other (38%)<br />
Type <strong>of</strong> measure (charge) Dummies Dummy charge 3 €cents (measure 1)<br />
Dummy charge 6 €cents (measure 1)<br />
Dummy charge 12 €cents (measure 1)<br />
Dummy charge 6 €cents (measure 3)<br />
Dummy charge 12 €cents (measure 3)<br />
Dummy charge 24 €cents (measure 3)<br />
Type <strong>of</strong> measure (revenue use) Dummy Dummy <strong>road</strong> taxes (revenues are used to lower<br />
existing <strong>road</strong> taxes (1A, 1B, 3A,3B) and construct<br />
new <strong>road</strong>s (1C and 3C))<br />
Dummy income taxes (revenues are used to lower<br />
income taxes, measures 1D to 1F and 3D to 3F)<br />
Possibility to work at home (available for Dummies Working home1: possible to work at home (26%);<br />
employed people making a commuting trip<br />
Working home2: not possible (42.2%); Working<br />
by car at least once a week)<br />
home3: unknown or not working (31.8%)<br />
Number <strong>of</strong> kilometres driven yearly Continuous<br />
Compensation <strong>of</strong> costs by employer Dummies Comp1: none (11.4%); comp2: partial (32.2%);<br />
(available for employed people making a<br />
comp3: completely (19.9%); comp4: have no<br />
commuting trip by car at least once a week)<br />
commuting costs (4.8%); comp5: unknown or not<br />
working (31.8%)<br />
Residential location Dummies Loc1: 3 large cities* (16.0%); loc2: rest west<br />
(31.9),; loc3: north (6.6%); loc4: east (23.1); loc5:<br />
south (22.4%)<br />
Vehicle weight Dummies Weight1: low weight (28.3%); weight2: middle<br />
class (47.2%); weight3: heavy (24.6%)<br />
Fuel type Dummies Fuel1: petrol (71.2%); Fuel2: diesel (24.9%); Fuel3:<br />
gas (3.9%)<br />
Car ownership (number <strong>of</strong> cars in<br />
Dummies Car1: 1 (58.5%); Car2: 2 (38.4%); Car3: 3 or more<br />
household)<br />
(3.0%)<br />
Children in household Dummy Yes (one or more) (45.7%); No (54.3%)<br />
* <strong>Amsterdam</strong>, Rotterdam and <strong>The</strong> Hague.<br />
104
Appendix 5C<br />
Behavioural responses to each variant <strong>of</strong> measures 1 and 3<br />
Measure Measure 1A Measure 1B Measure 1C<br />
Trip purpose Commuting Visits Other Commuting Visits Other Commuting Visits Other<br />
Total number <strong>of</strong> trips<br />
(driven in 4 weeks)<br />
1104 556 1468 1176 652 1176 1084 628 1160<br />
Trips adjusted (% total)<br />
Of which (%):<br />
0 (0%) 49 (8.8%) 115 (7.8%) 20 (1.7%) 48 (7.4%) 80 (6.8%) 45 (4.1%) 104 (16.6%) 149 (12.8%)<br />
Public transport<br />
30.6% 15.6% 20% 10.4% 6.3% 51.1% 10.6% 14.1%<br />
Non-motorised<br />
38.8% 64.3% 10% 56.3% 77.5% 22.2% 44.2% 60.4%<br />
Motorised<br />
0% 0%<br />
0% 8.3% 2.5% 6.7% 18.3% 6.0%<br />
Car pooling<br />
NR NR<br />
60% NR NR 0%<br />
NR NR<br />
Working at home<br />
NR NR<br />
10% NR NR 20%<br />
NR NR<br />
Not making the trip<br />
30.6% 20%<br />
0% 25.0% 17.8% 0% 26.9% 19.5%<br />
Measure Measure 1D Measure 1E Measure 1F<br />
Trip purpose Commuting Visits Other Commuting Visits Other Commuting Visits Other<br />
Total number <strong>of</strong> trips<br />
(driven in 4 weeks)<br />
1212 592 1408 1176 592 1332 1048 600 1236<br />
Trips adjusted (% total)<br />
Of which (%):<br />
100 (8.3%) 77 (13.0%) 179 (12.7%) 79 (6.7%) 105 (17.7%) 141 (10.6%) 156 (14.9%) 130 (21.7%) 182 (14.7%)<br />
Public transport 12.0% 27.3% 14.0% 39.2% 12.4% 9.2% 36.5% 20.9% 17.0%<br />
Non-motorised<br />
55.0% 53.2% 63.7% 30.4% 39.0% 68.8% 24.4% 41.1% 61.5%<br />
Motorised<br />
14.0% 0% 0%<br />
1.3% 11.4% 0.7% 12.8% 8.8% 1.6%<br />
Car pooling<br />
11.0% NR NR<br />
24%<br />
NR NR 23.1% NR NR<br />
Working at home 7.0% NR NR 5.1% NR NR 2.6% NR NR<br />
Not making the trip 1.0% 19.5% 22.3% 0% 37.1% 21.3% 0.6% 29.0% 19.8%<br />
NR = not relevant, variant is not related to trip purpose.<br />
105
Measure Measure 3A Measure 3B Measure 3C<br />
Trip purpose Commuting Visits Other Commuting Visits Other Commuting Visits Other<br />
Total number <strong>of</strong> trips<br />
(driven in 4 weeks)<br />
1256 636 1572 1096 500 1160 1168 708 1200<br />
Trips adjusted (% total)<br />
Of which:<br />
161 (12.8%) 75 (11.8%) 222 (14.1%) 139 (12.7%) 53 (10.6%) 124 (10.7%) 159 (13.6%) 137 (19.3%) 135 (11.3%)<br />
Public transport<br />
2.5% 34.7% 16.2% 21.6% 13.2% 25.8% 28.9% 8.7% 3.7%<br />
Non-motorised<br />
0% 10.7% 23.4% 20.1% 20.8% 23.4% 30.2% 30.6% 29.6%<br />
Motorised<br />
13%<br />
0% 0% 6.5% 0% 0.8% 8.8% 2.9% 1.5%<br />
Car pooling<br />
0%<br />
NR NR 0% NR NR 3.8% NR NR<br />
Travel at other times 71.4% 45.3% 56.3% 43.9% 60.4% 46% 20.1% 43.8% 46.7%<br />
Working at home 13.0% NR NR 7.9% NR NR 8.2% NR NR<br />
Not making the trip 0%<br />
9.3% 4.0% 0% 5.7% 4.0% 0% 13.9% 18.5%<br />
NR = not relevant, measure may not be differentiated according to time or variant is not related to trip purpose.<br />
Measure Measure 3D Measure 3E Measure 3F<br />
Trip purpose Commuting Visits Other Commuting Visits Other Commuting Visits Other<br />
Total number <strong>of</strong> trips (driven<br />
in 4 weeks)<br />
1136 640 1256 1112 524 1224 1032 612 1388<br />
Trips adjusted (% total)<br />
Of which:<br />
191 (16.8%) 100 (15.6%) 148 (11.9%) 140 (12.6%) 76 (13.9%) 161 (13.2%) 214 (20.7%) 88 (14.4%) 238 (17.2%)<br />
Public transport<br />
23.0% 4% 3.4% 10% 3.9% 8.7% 18.2% 22.7% 22.2%<br />
Non-motorised<br />
7.8% 38% 43.9% 15.7% 25% 32.9% 7.% 34.1% 24.4%<br />
Motorised<br />
0% 2% 2.6% 0% 3.9% 0% 21% 0% 3.8%<br />
Car pooling<br />
8.4% NR NR 12.8% NR NR 2.3% NR NR<br />
Travel at other times 57.1% 52% 46.6% 55% 53.9% 50.3% 39.7% 38.6% 38.2%<br />
Working at home<br />
3.1% NR NR 5.7% NR NR 9.8% NR NR<br />
Not making the trip 0.5% 4% 4% 0.7% 13.1% 8% 1.9% 4.5% 11.3%<br />
NR = not relevant, measure may not be differentiated according to time or variant is not related to trip purpose.<br />
106
Part II: Institutional aspects <strong>of</strong> transport <strong>pricing</strong><br />
107
Chapter 6<br />
Auctioning concessions for private <strong>road</strong>s<br />
6.1 Introduction<br />
Government involvement in transportation is very common throughout the globe, the reasons for<br />
intervention have been outlined in Chapter 2 and may take several forms, ranging from small<br />
regulatory rules to full ownership and operation <strong>of</strong> particular services. Transportation<br />
infrastructure, such as highways, ports and airports, absorbs a large share <strong>of</strong> public sector capital<br />
investments in most countries (Gomez-Ibanez and Meyer, 1993). Some changes can, however, be<br />
observed, and nowadays private involvement in the provision and <strong>pricing</strong> <strong>of</strong> infrastructure is<br />
increasing, following deregulation and privatisation in the US and in the UK during recent<br />
decades. In fact, the private supply <strong>of</strong> infrastructure is not a new idea, as the early development <strong>of</strong><br />
railways, canals, ports and inter-urban highways in many parts <strong>of</strong> the world was market-led by<br />
private sector entrepreneurs. <strong>The</strong> return <strong>of</strong> interest in private involvement can mainly be explained<br />
by the growing concern over public budgetary deficits, and the perceived inability <strong>of</strong> public bodies<br />
to manage complex infrastructure efficiently.<br />
This chapter deals with the specific, but realistic, case where private firms are involved in the<br />
provision and tolling <strong>of</strong> <strong>road</strong> infrastructure. We are in particular concerned with the dilemma<br />
caused by the fact that private operators – potentially bringing efficiency improvements – will be<br />
primarily (or exclusively) concerned with pr<strong>of</strong>it maximisation. Specifically, we will consider the<br />
question <strong>of</strong> whether the associated welfare losses can be mitigated by optimising the design <strong>of</strong><br />
auctions for the right to privately build and operate a certain <strong>road</strong>, in terms <strong>of</strong> the criterion or<br />
indicator that is used to identify the winning bid. We present a small two-link simulation model to<br />
analyse the <strong>effects</strong> <strong>of</strong> various types <strong>of</strong> private bids for the right to build and operate a new <strong>road</strong><br />
parallel to an existing <strong>road</strong>.<br />
This chapter thus studies one important aspect surrounding the franchising <strong>of</strong> highways. Any<br />
auction – or, indeed, any other selection mechanism – to choose between competing potential<br />
private <strong>road</strong> operators will affect the eventual properties <strong>of</strong> the <strong>road</strong> to be built and the tolling<br />
scheme to be applied. While studying how this fact can be employed for the benefit <strong>of</strong> society at<br />
large, our analysis also demonstrates that these properties (capacity, tolls) and the resulting<br />
welfare impacts may differ rather strongly over different auctions, even when restricting attention<br />
to plausible auctions alone. This is, <strong>of</strong> course, important information for the design <strong>of</strong> auctions. At<br />
the same time, there are many other urgent policy issues surrounding the franchising <strong>of</strong> highways<br />
that this chapter does not address. Those include demand uncertainty, information asymmetry,<br />
strategic behaviour by the concessionaire, renegotiation <strong>of</strong> contracts, etc. However, the advantage<br />
<strong>of</strong> ignoring these issues is that we obtain a more transparent picture <strong>of</strong> the impacts <strong>of</strong> different<br />
auction designs on <strong>road</strong> capacity and toll. <strong>The</strong> consequence is that there are still many important<br />
issues left for future research, as we will acknowledge and discuss in more detail at the end <strong>of</strong><br />
Section 6.3.<br />
This chapter starts in Section 6.2 with some basic (<strong>pricing</strong>) issues related to the involvement <strong>of</strong><br />
private parties in <strong>road</strong> infrastructure provision. Section 6.3 introduces the model, and presents<br />
some simulation results when private firms may bid for the construction and operation <strong>of</strong> a <strong>road</strong> in<br />
an auction. Section 6.4 concludes.<br />
6.2 Investment and <strong>pricing</strong> <strong>of</strong> infrastructure<br />
Investments in transport infrastructure are usually made by the public sector, and private<br />
involvement has so far been limited in most countries. <strong>The</strong> private sector usually seeks<br />
109
commercial pr<strong>of</strong>it that can be gained either as income from investment interest, or as value capture<br />
through an improvement in the transport system. Despite the higher cost <strong>of</strong> capital raised from<br />
commercial sources and the need to cover the risks and gain commercial pr<strong>of</strong>it, it may be that the<br />
overall cost for the community will be lower with private financing than when tax funds are used.<br />
One potential source <strong>of</strong> efficiency improvements involves cost-effectiveness induced by private<br />
enterprise’s pr<strong>of</strong>it objectives. Next, government funds are <strong>of</strong>ten raised using distortive taxes,<br />
which may further increase the social costs <strong>of</strong> public investments (note that this argument<br />
becomes irrelevant when comparing priced public and private <strong>road</strong>s that require no funding other<br />
than toll revenues). Private management may lead to increased innovative ideas in the project, or<br />
to more rapid decision making. Private financing may also minimise the debt burden or financial<br />
guarantees on the finances <strong>of</strong> the government and increase the financial resources that might be<br />
available for the projects.<br />
Despite these potential benefits, it may be difficult to interest private investors in financing <strong>road</strong>s.<br />
Considerable risks and uncertainties may make infrastructure not a very attractive investment, and<br />
high fixed costs and long construction and planning periods <strong>of</strong>ten require large sums <strong>of</strong> capital in<br />
the beginning, while the pay-back period is long (see Rienstra and Nijkamp, 1997, on the various<br />
risks and uncertainties for private investors).<br />
An important potential social disadvantage <strong>of</strong> private <strong>road</strong> provision stems from the <strong>pricing</strong><br />
strategies <strong>of</strong> the private firm. It may be expected that, when allowed to build and operate<br />
infrastructure, firms will not price efficiently, and will set charges above optimal levels, both<br />
when operating a <strong>road</strong> in isolation and when an unpriced substitute exists (e.g. Edelson, 1971;<br />
Mills, 1981; Verhoef et al., 1996). Unless demand is perfectly elastic – an implausible<br />
circumstance for <strong>road</strong> traffic – the pr<strong>of</strong>it-maximising toll exceeds the welfare-maximising toll.<br />
Whether the use <strong>of</strong> such pr<strong>of</strong>it-maximising charges is considered acceptable is likely to depend on<br />
the question <strong>of</strong> whether socially-optimal charges on their own would lead to reasonable pr<strong>of</strong>its, or<br />
– at least – avoid losses for the private operator.<br />
<strong>The</strong> relationship between the total costs <strong>of</strong> the infrastructure manager, and the revenues collected<br />
by tolls, if the charges are set equal to marginal social costs, will depend upon the underlying cost<br />
conditions in the supply <strong>of</strong> infrastructure conditions. If the long-run average costs (when all inputs<br />
are variable) are falling over the relevant range <strong>of</strong> output (increasing returns to scale), marginal<br />
cost based charges will tend, on average, to yield less than the full ongoing costs <strong>of</strong> the<br />
infrastructure manager. <strong>The</strong> reverse will hold in the case <strong>of</strong> decreasing returns to scale; then<br />
pr<strong>of</strong>its can be made. Constant long-run average costs will enable full cost recovery (Small, 1999;<br />
Mohring and Harwitz, 1962). Studies <strong>of</strong> cost conditions, and the evidence <strong>of</strong> the revenues<br />
produced when marginal cost-reflecting charges have been applied in practice, suggest that the<br />
extent <strong>of</strong> scale economies varies between the different types <strong>of</strong> transport infrastructure (e.g. NERA<br />
et al., 1998). Road infrastructure tends to show returns to scale that are approximately constant<br />
(e.g. Small et al., 1989). This pattern <strong>of</strong> project returns will encourage a highly conservative<br />
approach by the private sector to provide infrastructure against marginal cost-based prices, since<br />
the resulting pr<strong>of</strong>its would be small or negative. It is, therefore, not surprising that most projects <strong>of</strong><br />
interest to private investors have been those which are discrete, clearly bounded and largely selfcontained<br />
with no close-competitor. Indeed, the most common privately financed schemes have<br />
been bridges and tunnels (Vickerman, 2002).<br />
Because <strong>of</strong> the likely discrepancy between socially-optimal and pr<strong>of</strong>it-maximising prices,<br />
governments may wish to consider exercising some control over the process. <strong>The</strong> natural<br />
monopoly argument has been, and still is, the underlying rationale for public involvement in<br />
infrastructure provision since the nineteenth century (see Vickerman, 2002). Most toll bridges do<br />
face price controls for instance. Pure private financing, in which the private party carries all costs,<br />
runs all risks, and receives all revenues from user charges, is therefore only seldom the case.<br />
110
Financial regulation can take several forms, including a maximum toll rate indexed to inflation (as<br />
in France: Fisher and Babbar, 1996), a return on investment ceiling, and traffic or revenue<br />
guarantees (e.g. shadow tolling, where the government guarantees a certain toll depending on the<br />
traffic, which takes away a great deal <strong>of</strong> commercial risk). An indexed maximum toll rate is the<br />
most common form <strong>of</strong> regulation, mainly due to its practical advantages (Fisher and Babbar,<br />
1996). Return on investment regulation with no toll rate ceiling is more flexible in allowing toll<br />
rate adjustments to optimise revenues. California, for instance, selected an innovative one-time<br />
contractual approach, setting the ceiling for the rates <strong>of</strong> return allowed over the life <strong>of</strong> the project<br />
in each franchise agreement.<br />
<strong>The</strong> specification <strong>of</strong> the design <strong>of</strong> the <strong>road</strong> may range from virtually no public involvement to<br />
public sector responsibility for preliminary design (including capacity, location and number <strong>of</strong><br />
interchanges and crossings, materials used, etc.). Although little information is available about<br />
current practice, it is <strong>of</strong>ten the public sector that selects project proposals, which meet their predefined<br />
conditions. At the same time, a lower level <strong>of</strong> public responsibility for design allows the<br />
private sector to bring in innovative solutions and better match market demands. Bidders for the<br />
SR 91 <strong>road</strong> in California, for instance, had full responsibility for all project design subject to<br />
governmental approval. <strong>The</strong> contract was fully negotiated only after a concessionaire was<br />
selected. <strong>The</strong> basis for comparing bids and selecting the concessionaire was therefore somewhat<br />
subjective, since the government had to compare different designs <strong>of</strong> the project. However, this<br />
process allowed the private sector to propose innovative projects and designs and negotiate risksharing<br />
terms (Fisher and Babbar, 1996).<br />
In conclusion, governments normally want to keep some form <strong>of</strong> control when private firms are<br />
involved in <strong>road</strong> construction and operation. Governments have various options to control private<br />
firms. <strong>The</strong>y could focus only on toll regulation, after the <strong>road</strong> has already been constructed.<br />
Governments may also want to leave both construction and operation to the private sector, but still<br />
keep control over design <strong>of</strong> the <strong>road</strong> and toll levels. This was the case in California (SR 91) when<br />
a private firm was allowed to build a new lane parallel to an existing <strong>road</strong>. Instead <strong>of</strong> applying<br />
more direct types <strong>of</strong> regulation, governments may also decide to use an auction to achieve specific<br />
objectives. Private firms are then invited to make a bid and obtain the right to construct and<br />
operate a <strong>road</strong>. This bid would include a specification <strong>of</strong> the design <strong>of</strong> the <strong>road</strong> and the toll level<br />
that will be levied during operation. In a setting <strong>of</strong> open bidding, certain evaluation criteria for<br />
ranking proposals may be set by the government. Specifically, it may choose criteria that are likely<br />
to produce bids which meet the public objectives as closely as possible. In the following section,<br />
we analyse these <strong>effects</strong> <strong>of</strong> an auction, and in particular the consequences <strong>of</strong> setting different rules<br />
to evaluate the bids <strong>of</strong> private firms.<br />
6.3 A modelling framework for evaluating auctions for private <strong>road</strong>s<br />
From the viewpoint <strong>of</strong> society, it is important to assess the welfare implications <strong>of</strong> the construction<br />
and operation <strong>of</strong> a new <strong>road</strong>. Certain toll levels and capacities may lead to pr<strong>of</strong>its but need not<br />
maximise welfare; or vice-versa, a socially-optimally designed <strong>road</strong> may generate substantial<br />
welfare gains but without being pr<strong>of</strong>itable – and would hence be unattractive to private firm.<br />
We develop a model that allows us to study the <strong>effects</strong> <strong>of</strong> highway tolls and capacities on welfare<br />
and pr<strong>of</strong>its in a relatively simple setting. We are particularly interested in the question <strong>of</strong> how<br />
auctions for concessions to build and operate a private <strong>road</strong> can be used to optimise two decision<br />
variables <strong>of</strong> interest: the <strong>road</strong>’s capacity, and the toll that will be charged.<br />
We will use a simulation model to investigate the consequences <strong>of</strong> various types <strong>of</strong> <strong>road</strong>s<br />
(differing in capacity and toll) in terms <strong>of</strong> welfare and pr<strong>of</strong>it, and to find suitable “indicators” for<br />
selecting the winning bid that governments could use in auctions. For instance, an auction with the<br />
rule that the bid with the maximum capacity (which is possibly a relevant objective for an<br />
authority) will get the right to build and operate may not necessarily lead to the optimum in terms<br />
111
<strong>of</strong> welfare (and hence be an inferior indicator). <strong>The</strong> consequences <strong>of</strong> various auction rules will be<br />
investigated by using a simple two-<strong>road</strong> network. We are aware that auction design affects<br />
outcomes, and is very important for the success <strong>of</strong> it. <strong>The</strong> most important features <strong>of</strong> an auction<br />
are its robustness against collusion and its attractiveness to potential bidders (Klemperer, 2002).<br />
Besides, local circumstances matter in the practical design <strong>of</strong> auctions. We will discuss some<br />
crucial assumptions on auction design below, indicating that we focus on the analysis <strong>of</strong> the<br />
auction rule set by the government, and not so much on the explicit design <strong>of</strong> the auction itself.<br />
<strong>The</strong> model will be explained in greater detail after we have discussed previous studies that use a<br />
similar setting.<br />
6.3.1 Previous studies<br />
Analytical studies have paid attention to the welfare consequences <strong>of</strong> different ownership (and<br />
<strong>pricing</strong>) regimes. Several analytical studies <strong>of</strong> private toll <strong>road</strong>s can be found in the literature.<br />
Most <strong>of</strong> them consider a simple <strong>road</strong> network with one origin and one destination connected by<br />
one or more parallel routes (Edelson, 1971; and Mills, 1981). Many employ static models, in<br />
which drivers’ choice is limited to route and travel demand, possibly with flat tolls (time<br />
independent). Recognising that institutional constraints may prevent the implementation <strong>of</strong><br />
optimal tolls, more recent research has focused on the properties <strong>of</strong> second-best tolls, which are<br />
computed subject to given constraints. A common constraint encountered in practical situations is<br />
that tolls are only implemented on single lanes or <strong>road</strong>s, with travel on alternative routes being<br />
unpriced. An example is the SR 91 <strong>road</strong> in California (Liu and McDonald, 1998). Imposition <strong>of</strong><br />
‘quasi first-best <strong>pricing</strong>’ on the toll <strong>road</strong> (simply ignoring spill-overs to the unpriced parallel <strong>road</strong>)<br />
is then not welfare-maximising (Lévy-Lambert, 1968; Marchand, 1968). One analysis <strong>of</strong> different<br />
ownership regimes is in Verhoef et al. (1996), who considered a network with one origin and one<br />
destination connected by two parallel routes. <strong>The</strong> authors consider two private ownership regimes:<br />
one in which one <strong>of</strong> the routes is private and the other is free access, and a second situation in<br />
which a private monopoly controls both routes. It is shown that revenue-maximising tolling on<br />
two routes may actually lead to a more efficient usage <strong>of</strong> <strong>road</strong> space than does optimal one-route<br />
tolling. Hence, it may be more efficient to have a monopolist controlling the entire network, rather<br />
than just a part <strong>of</strong> it. Verhoef and Small (2004) obtained a similar result in a comparable set up,<br />
which, however, allows for heterogeneity with respect to value <strong>of</strong> time.<br />
De Palma and Lindsey (2000) focused on the allocative efficiency <strong>of</strong> private toll <strong>road</strong>s vis à vis<br />
free access and public toll <strong>road</strong> <strong>pricing</strong> on a similar network, but allowing for dynamics <strong>of</strong> peak<br />
congestion. This study suggests that two competing private <strong>road</strong>s can yield most <strong>of</strong> the potential<br />
efficiency gains from first-best <strong>pricing</strong> if neither <strong>road</strong> has a dominant fraction <strong>of</strong> total capacity.<br />
<strong>The</strong>y look at two parallel routes between one origin and destination that can differ in capacity and<br />
free-flow travel time. A single private <strong>road</strong> competing with a free-access <strong>road</strong> tends to be most<br />
efficient if the two <strong>road</strong>s have approximately equal capacities and if the private <strong>road</strong> does not<br />
suffer a significant travel time disadvantage.<br />
Yang and Meng (2000) look at the selection <strong>of</strong> the capacity and toll charge <strong>of</strong> a new <strong>road</strong> (in a<br />
build-operate-transfer (BOT) framework) and the evaluation <strong>of</strong> the relevant benefits to the private<br />
investor, the <strong>road</strong> users, and the society as a whole. A pr<strong>of</strong>it-maximising private firm will consider<br />
the trade-<strong>of</strong>f among traffic demand, toll charge, and <strong>road</strong> capacity. Toll setting and capacity choice<br />
by private organisations will have important consequences in terms <strong>of</strong> efficiency, which may call<br />
for government intervention. <strong>The</strong> Yang and Meng study investigated private sector pr<strong>of</strong>it and total<br />
social welfare gain generated from a proposed BOT project under a wide range <strong>of</strong> capacity-toll<br />
combinations and employing a general <strong>road</strong> network. <strong>The</strong>y show how, and under what<br />
circumstances, a highway project is pr<strong>of</strong>itable, and how it may benefit the <strong>road</strong> users.<br />
Tsai and Chu (2003) studied regulation alternatives for governments on private highway<br />
investment under a BOT scheme set up to protect both consumers and firms. <strong>The</strong> impact <strong>of</strong><br />
112
various circumstances (such as a minimum flow constraint) on traffic demand, as well as users’<br />
cost, pr<strong>of</strong>it levels, and welfare are explored. <strong>The</strong>y found that a BOT project with regulation<br />
performs between the cases <strong>of</strong> maximizing welfare and that <strong>of</strong> maximum pr<strong>of</strong>it.<br />
Our analysis is possibly closest to that by Tsai and Chu (2003). However, they focused on two<br />
types <strong>of</strong> regulation for one private firm that will construct the <strong>road</strong>. Here, we focus on the<br />
auctioning <strong>of</strong> concessions to privately operate the <strong>road</strong>, and consider various criteria (“indicators”)<br />
that a government may use to realize more satisfying bids from interested firms.<br />
6.3.2 Model formulation<br />
In our model, we study the relative efficiency <strong>of</strong> a new route, parallel to an existing untolled<br />
alternative that is to be operated and constructed by a private firm. <strong>The</strong> case <strong>of</strong> a new <strong>road</strong> without<br />
an existing substitute is a special case <strong>of</strong> our model, with the existing <strong>road</strong>’s capacity set equal to<br />
zero. We assume that the existing (public) <strong>road</strong> will remain untolled. An unrestricted monopolist<br />
would prefer to set tolls and capacity at pr<strong>of</strong>it-maximising rather than welfare-maximising values.<br />
We consider the question <strong>of</strong> how such behaviour can be affected by using particular types <strong>of</strong><br />
auctions for the right to operate the private <strong>road</strong>.<br />
Clearly, if the government had perfect knowledge <strong>of</strong> prevailing demand and cost conditions, it<br />
would be simple to design such an auction: the firm that promises to set toll and capacities equal<br />
to the socially-optimal (second-best) levels would win the concession. Auctions become relevant<br />
only if the government is uncertain about what is optimal, while potential suppliers have more<br />
information. We assume that this is the case. Specifically, we assume that suppliers have perfect<br />
knowledge <strong>of</strong> the market conditions, and that the government only knows the (single) value <strong>of</strong><br />
time <strong>of</strong> the <strong>road</strong>’s potential users 12 . Otherwise, we make assumptions that will prevent any other<br />
distortions from affecting the (relative) efficiency <strong>of</strong> the auctions we consider. First, we will<br />
assume that there is competitive bidding: there is no tacit collusion between bidders, they do not<br />
have market power in the bidding process, and bids will be such that the winning firm will make<br />
zero pr<strong>of</strong>its. Secondly, we assume that the potential bidders are identical. Under these unrealistic,<br />
idealised conditions we can focus on the performance <strong>of</strong> different indicators that the government<br />
could use in setting up auctions for <strong>road</strong>s. And thirdly, we assume that the firms make truthful<br />
bids, that is: bids to which they will indeed adhere once given the concession. This means that we<br />
implicitly assume that there is a credible and effective penalty on deviating from the bid made.<br />
<strong>The</strong> complications arising when these assumptions are not fulfilled are certainly interesting, but<br />
considered as material for future work. <strong>The</strong>se include the existence <strong>of</strong> differences between<br />
potential firms, the existence <strong>of</strong> collusion during the auction, other imperfections in the auction if<br />
the number <strong>of</strong> bidders becomes smaller, the existence <strong>of</strong> uncertainty also for the potential bidders,<br />
etc.<br />
Finally, we assume that the government has the objective <strong>of</strong> maximising social surplus, defined as<br />
total (Marshallian) benefits minus total user costs (including time costs), minus the capacity costs.<br />
<strong>The</strong> objective <strong>of</strong> the private <strong>road</strong> operators would normally be to maximise pr<strong>of</strong>its, defined as total<br />
toll revenues minus capacity costs. However, when an auction is in place, the firm’s objective will<br />
become to maximise (or minimise) the indicator specified by the regulator, under the constraint<br />
that the pr<strong>of</strong>its from the operation be non-negative. For all the auctions that we consider, this<br />
constraint will be binding. <strong>The</strong> idea is thus that a firm that would not maximise (or minimise) the<br />
indicator would be certain not to win the auction.<br />
<strong>The</strong> challenge faced by the government is then as follows: can an auction be designed such that<br />
the bidding private firms propose a capacity and toll that are close to the second-best optimal<br />
12 This assumption is made to ensure that both the government and all bidders can communicate in terms <strong>of</strong> average<br />
user cost, without having to worry about different parties having a different view on the relation between equilibrium<br />
travel times and implied average user costs. This is relevant for some <strong>of</strong> the auctions we consider below, in which the<br />
indicator includes the generalised price (average travel costs plus toll) on route T.<br />
113
value? Specifically, which “indicator” (the target variable that bidders should maximise or<br />
minimise and that thus will be used to select the winning bid) will achieve this objective as closely<br />
as possible?<br />
Our network model builds on the one used by Verhoef et al. (1996). Our analysis, however,<br />
includes capacity and capacity costs, which enables us to compare different combinations <strong>of</strong> toll<br />
and capacity proposed by the bidders, leading to various pr<strong>of</strong>it and welfare levels. But the general<br />
setting is the same: a simple network with two competing (possibly) congested <strong>road</strong>s. One route<br />
(the existing one) remains free <strong>of</strong> toll (route U) and another route will be built and tolled by the<br />
concession-winning private firm (route T).<br />
Car drivers regard the two alternatives as perfect substitutes We therefore consider one single<br />
demand function D(N), where N denotes the total number <strong>of</strong> <strong>road</strong> users on both routes (naturally N<br />
= NT + NU), and there are two average user cost (including time costs) functions CT (NT, capT) and<br />
CU (NU, capU). In line with Wardrop’s first principle (Wardrop, 1952), at any equilibrium with<br />
both routes used, the average cost on route U should then be equal to the average cost on route T<br />
plus the one-route fee tT: otherwise, people would shift from one route to the other. Furthermore,<br />
both average costs should be equal to marginal benefits (D(N)= D(NT + NU)). We assume that the<br />
demand is linear:<br />
D = d - a *(NT + NU). (1)<br />
Next, for both routes i, the average social cost (ci) consists <strong>of</strong> a free-flow cost component ki and a<br />
congestion cost component, which is assumed to be proportional to total <strong>road</strong> usage (Ni) with a<br />
factor bi, being a constant term divided by the capacity <strong>of</strong> the <strong>road</strong>:<br />
ci = ki + bi *Ni; i = T,U . (2)<br />
bi = β/capi; i = T,U. (3)<br />
<strong>The</strong> generalised price, for both <strong>road</strong>s, can then be defined as the sum <strong>of</strong> ci and the toll (if any);<br />
pi = ci + ti; i = T,U. (4)<br />
Pr<strong>of</strong>its (πT) for the private operator are defined as the difference between revenues from the tolls<br />
and the net costs for <strong>road</strong> provision (capacity costs, plus or minus a lump-sum payment or subsidy<br />
(if any)). Hence, we neglect other costs for the provider such as maintenance and costs involved<br />
with toll collection. A <strong>road</strong> project is interesting to private firms when a stream <strong>of</strong> revenues is<br />
sufficient to meet their costs and allows them a minimum pr<strong>of</strong>it. <strong>The</strong> costs depend on the size <strong>of</strong><br />
the project (the capacity <strong>of</strong> the <strong>road</strong>), while the revenue depends on the combination <strong>of</strong> the toll<br />
charge and traffic demand for the new <strong>road</strong>. In our analysis <strong>of</strong> various auctions, we include at<br />
some stage the possibility for private firms to ask for a certain amount <strong>of</strong> subsidy (sub in the<br />
model) from the government that may be necessary to <strong>of</strong>fer a pr<strong>of</strong>itable bid. <strong>The</strong> capacity costs are<br />
assumed to be proportional to the capacity <strong>of</strong> the <strong>road</strong> (capi) with a fixed price per capacity unit<br />
(pcap, equal for both routes) 13 ;<br />
πT = tT*NT - capT* pcap + sub; (5)<br />
13 Note that the average cost function implied by (2) and (3) and the constancy <strong>of</strong> the unit price for capacity implies<br />
that our <strong>road</strong> network qualifies for the application <strong>of</strong> the Mohring-Harwitz (1962) result on exact self-financing <strong>of</strong><br />
optimally designed and priced <strong>road</strong>s (see also below).<br />
114
Total welfare (W) is now equal to the ‘variable’ social surplus (the benefits B as given by the<br />
relevant area under the demand curve, minus total user costs) minus the total capacity costs:<br />
W = B – NU*cU – NT*cT - (capU+ capT)* pcap (6)<br />
All parameters are non-negative, and we will only consider regular networks, where both routes<br />
are at least marginally used.<br />
<strong>The</strong> equilibrium conditions are:<br />
D = pU and D = pT<br />
and (for all auctions that we will consider):<br />
πT = 0.<br />
6.3.3 Numerical Example<br />
For the ‘base case’ <strong>of</strong> our numerical model, it is assumed that the private <strong>road</strong> is not yet available,<br />
and the following parameter values were chosen: a = 0.1; d = 140; kU = kT = 20; β = 20; pcap = 2;<br />
capU = 1000; and capT = 0. <strong>The</strong> base-case equilibrium leads to a reasonable demand elasticity <strong>of</strong> –<br />
0.4, at an equilibrium use <strong>of</strong> 1000 and equilibrium travel costs that are twice the ‘free-flow’ level<br />
(a table with detailed results is provided in Appendix 6b). <strong>The</strong>se parameter values were otherwise<br />
not motivated by any desire to represent a realistic situation. Before turning to the auctions, we<br />
will first discuss a few benchmark situations. <strong>The</strong> table in Appendix 6b gives detailed numerical<br />
results, whereas Appendix 6c describes the Lagrangian objective functions that have been solved<br />
to find these results.<br />
First-best<br />
<strong>The</strong> first-best social optimum (maximum welfare) in this network involves an optimisation <strong>of</strong> both<br />
the capacity <strong>of</strong> route T and both tolls (first-best <strong>pricing</strong> requires <strong>pricing</strong> <strong>of</strong> the whole network).<br />
<strong>The</strong> optimal <strong>road</strong> price is then equal to 6.32, with marginal private costs <strong>of</strong> 26.32 and marginal<br />
social costs amounting to 32.64 (see Appendix 6b). <strong>The</strong> total capacity <strong>of</strong> both <strong>road</strong>s together is 3.4<br />
times as high as the initial capacity. This is rather extreme. It is a direct consequence <strong>of</strong> the level<br />
<strong>of</strong> pcap that we have chosen, relative to the other parameters, and could therefore easily have been<br />
avoided. We have however, chosen this parametrisation so as to create sufficient disparity between<br />
the initial equilibrium and the optimum, so that relative differences between various policy options<br />
can easily be observed 14 . Moreover, Figure 6.4 below shows the results <strong>of</strong> a sensitivity analysis<br />
with respect to pcap. <strong>The</strong> zero pr<strong>of</strong>it result for the provision <strong>of</strong> <strong>road</strong> T confirms the Mohring and<br />
Harwitz (1962) result <strong>of</strong> optimal investment. <strong>The</strong> revenues from an optimal toll will just cover the<br />
costs <strong>of</strong> the facility provider as long as there are no economies or diseconomies <strong>of</strong> scale in facility<br />
capacity and the facility provider is investing optimally.<br />
Second-best<br />
For the evaluation <strong>of</strong> the various auctions to be considered, it is useful to know the (welfare)<br />
properties <strong>of</strong> the second-best solution, with only one route tolled and its capacity optimised.<br />
Optimal welfare under these conditions (second-best optimum) appears to be only a fraction lower<br />
14 Note also that the sensitivity analysis with respect to the initial capacity, displayed in Figure 6.2 below, shows that<br />
with initial capacities exceeding 1700, auctions that do not allow for a lump-sum subsidy to the bidders would become<br />
irrelevant from the perspective <strong>of</strong> social welfare, as these would no longer be capable <strong>of</strong> generating any social<br />
benefits.<br />
115
than the first-best optimum (ω = 0.98) 15 . <strong>The</strong> toll, however, is equal to 0.57, significantly lower<br />
than the first-best toll. But, it is unlikely that private firms will voluntarily provide a <strong>road</strong> with<br />
these specifications, because pr<strong>of</strong>its are negative. This means that, if the government succeeds in<br />
designing an auction that duplicates the second-best outcome, it will have to allow for a subsidy to<br />
be given to the private operator.<br />
Second-best under zero pr<strong>of</strong>it constraint<br />
<strong>The</strong> second-best solution under the zero pr<strong>of</strong>it constraint leads to a considerable lower welfare<br />
level (ω = 0.79). It is, in fact, no surprise that the toll level in this situation equals the first-best<br />
tolls. In the long run, marginal and average capacity costs per user for route T are constant.<br />
Because we are looking for the second-best optimal situation for this new <strong>road</strong>, given that no<br />
pr<strong>of</strong>it or losses should be generated, the ratio <strong>of</strong> NT divided by the capacity costs <strong>of</strong> <strong>road</strong> T is<br />
independent <strong>of</strong> the use <strong>of</strong> this <strong>road</strong>, and hence the optimal variable costs will be constant. This<br />
means that the average total costs for route T will be minimised. <strong>The</strong> optimal charge is now again<br />
equal to the average capacity costs per <strong>road</strong> user, which is 6.32. Total revenues from the toll<br />
charge equal the total capacity costs, as demanded by the zero pr<strong>of</strong>it constraint.<br />
Pr<strong>of</strong>it maximisation<br />
Without governmental intervention, private ownership <strong>of</strong> the <strong>road</strong> will lead to pr<strong>of</strong>it maximisation.<br />
Note that we only consider non-discriminatory fees, the operator is only allowed to set just one<br />
toll for all users. <strong>The</strong> results show that the capacity <strong>of</strong> the <strong>road</strong> provided by the private firm will be<br />
rather small (compared with the previous optima) and the toll will be equal to 10. <strong>The</strong> index <strong>of</strong><br />
relative welfare improvement ω is equal to 0.47 16 .<br />
6.3.4 Auction rules for governments<br />
We will now consider possible rules that a government may use in an attempt to organize the<br />
auction such that a desired outcome is achieved. <strong>The</strong> scenarios presented in the previous<br />
subsection are interesting benchmarks to identify relative efficiency <strong>effects</strong>, and to determine the<br />
performance <strong>of</strong> the auction rules. Four different auctions are considered, each with a different<br />
objective rule (“indicator”). A fifth possible rule will be dismissed shortly. <strong>The</strong>se rules are based<br />
on plausible aims that the government might have in such a setting. Note that the assumptions we<br />
have described in Section 6.3.2 apply here. Hence, we assume that there is competitive bidding,<br />
and that there will be zero pr<strong>of</strong>its for the winning firm.<br />
15 This indicator ω is defined as the difference between welfare in the situation under study and base-case welfare<br />
divided by the difference between first best welfare and base-case welfare.<br />
16 A remarkable aspect <strong>of</strong> our model is that the pr<strong>of</strong>it-maximising fee turns out to be independent (and equal to 10 in<br />
this numerical example) <strong>of</strong> the <strong>road</strong> capacity chosen. This is most likely a peculiarity <strong>of</strong> our linear set-up (although we<br />
have not explored this issue any further).<br />
116
Figure 6.1: Combination <strong>of</strong> toll and capacity under zero pr<strong>of</strong>it condition (upper panel), and<br />
combination <strong>of</strong> toll and welfare levels under zero pr<strong>of</strong>it condition (lower panel)<br />
We first identify combinations <strong>of</strong> toll and capacity that lead to zero pr<strong>of</strong>it for the bidder, when no<br />
subsidisation is allowed for. <strong>The</strong> upper panel in Figure 6.1 shows those combinations between toll<br />
and capacity <strong>of</strong> the new route that lead to zero pr<strong>of</strong>it. <strong>The</strong> figure thus maps out the potential<br />
outcomes <strong>of</strong> an auction in which no lump-sum subsidy or payment is foreseen as part <strong>of</strong> the<br />
auction. <strong>The</strong> lower panel in Figure 6.1 shows the resulting combinations <strong>of</strong> welfare and toll (with<br />
capacity chosen according to the upper panel). <strong>The</strong> optimal toll among these is 6.32 (which is the<br />
second-best zero pr<strong>of</strong>it result).<br />
This figure immediately shows that a fifth possible auction, with the rule to minimise the toll to be<br />
charged, is not <strong>of</strong> interest. <strong>The</strong> lowest possible toll under a zero-pr<strong>of</strong>it condition occurs at a zero<br />
capacity. <strong>The</strong>refore, no practically meaningful bids with positive capacity can be expected from<br />
this auction.<br />
Auction 1: Minimise generalised price, including toll, on route T<br />
A first indicator that the government might use would be to ask bidding firms to minimise<br />
generalised travel costs including the toll on the new lane (minimise cT + tT). Because the value <strong>of</strong><br />
time is common knowledge, in practice this would, for instance, mean that the bidders mention the<br />
toll they will charge, and the average speed they promise to <strong>of</strong>fer – which is easily converted into<br />
travel costs. When bids are evaluated on this criterion, firms have the incentive to reduce the toll<br />
as well as the travel costs. <strong>The</strong>y also face an incentive to minimise capital costs (per user), as this<br />
allows charging a relatively low toll – while preventing losses from operation. <strong>The</strong> simulation<br />
results suggest that the lowest generalised travel cost (including toll) is reached at the same toll<br />
where welfare is maximised in a second-best situation under zero pr<strong>of</strong>it (see Appendix 6c for all<br />
objective functions that have been used to obtain the results). This occurs, because the firm will<br />
minimise its (capacity) costs and, due to the indicator, also the generalised price. Consequently,<br />
the average total costs for route T are minimised, and therefore the same result as with ‘secondbest<br />
zero pr<strong>of</strong>it’ will prevail. This means that the relative welfare improvement indicator is equal<br />
for both situations (ω = 0.79), but still substantially below the second-best situation (ω = 0.98); see<br />
also Figure 6.2. This result suggests that a minimum travel costs indicator may lead to<br />
117
considerable welfare improvement compared with the current situation, but also to an unrestricted<br />
monopoly (ω = 0.47).<br />
Auction 2: Maximise capacity <strong>of</strong> route T<br />
A second possibility is that the government selects the bid with the largest capacity (e.g. motivated<br />
by the hope to minimise congestion). This indicator leads to an upward pressure on the capacity<br />
costs <strong>of</strong> the bidding firm, but does not directly affect the generalised travel costs (only indirectly<br />
by increased capacity). <strong>The</strong> private firm will search for a bid with the largest capacity <strong>of</strong> route T,<br />
but still without making losses. Figure 6.1 shows the winning zero pr<strong>of</strong>it level: a toll <strong>of</strong> 10 with a<br />
capacity <strong>of</strong> 1800. <strong>The</strong> higher toll and larger capacity lead to a smaller welfare gain. <strong>The</strong> index <strong>of</strong><br />
relative welfare improvement is about 0.64, which is, as expected, lower than that <strong>of</strong> the previous<br />
auction (see also Figure 6.2). Hence, this criterion is not recommended when regulators aim for<br />
maximum welfare. <strong>The</strong> results show that the larger capacity is not accompanied by larger usage,<br />
because <strong>of</strong> the higher toll. This auction would therefore not necessarily become relatively less<br />
attractive when environmental costs from <strong>road</strong> use were also considered, as one might have<br />
anticipated for an auction that maximises <strong>road</strong> capacity.<br />
Auction 3: Minimise subsidy<br />
For the next two auctions, we introduce the possibility <strong>of</strong> lump-sum payments from, or subsidies<br />
to the private operator. Recall that the second-best outcome would require a subsidy. As a first<br />
variant, we consider what might be called a ‘traditional’ auction: namely, one in which the<br />
winning bid is the one that requires the lowest subsidy, or, equivalently, promises the largest<br />
payment for the right to build and operate the <strong>road</strong> (when sub is negative). <strong>The</strong> amount <strong>of</strong> subsidy<br />
(which has been set at zero in the previous auctions) is included in the pr<strong>of</strong>it function (4). It<br />
appears that the minimum level <strong>of</strong> the subsidy (negative, indicating that firms are willing to pay)<br />
is reached at a capacity <strong>of</strong> 697, and a toll <strong>of</strong> 10. <strong>The</strong> result is equal to the outcome <strong>of</strong><br />
unconstrained pr<strong>of</strong>it maximisation, as could have been expected. It indicates that firms will set the<br />
price and capacity in such a way that they can pay the government the highest price (all pr<strong>of</strong>its)<br />
without making losses. <strong>The</strong> auction forces the firms to choose a (pre-subsidy) pr<strong>of</strong>it that<br />
maximises toll and capacity, which are known to lead to potentially considerable welfare losses.<br />
This is therefore not a very attractive option from the efficiency perspective (ω = 0.47).<br />
Auction 4: Minimise travel costs and subsidy divided by total traffic demand<br />
<strong>The</strong> fourth rule that we consider combines the subsidy requested and the generalised travel costs<br />
(including a toll) on the new <strong>road</strong>. <strong>The</strong> aim reflects the desires for low travel costs and a small<br />
subsidy. <strong>The</strong> indicator is defined as cT + tT + sub/(NT + NU). <strong>The</strong> resulting welfare level is very<br />
near the second-best outcome, and the index <strong>of</strong> relative welfare improvement is nearly equal to the<br />
second-best solution. However, a subsidy is required to approach the second-best optimum, since<br />
this second-best optimum cannot be realised without losses. This auction rule outperforms all<br />
other indicators in terms <strong>of</strong> welfare gains. This can be explained by the fact that it forces firms to<br />
minimise total costs (travel and capacity costs, as in auction 1), while requesting a small subsidy.<br />
This subsidy is, in fact, used to increase capacity <strong>of</strong> route T, while keeping toll levels low, all<br />
leading to increased welfare levels compared with no-subsidy auctions.<br />
Note that the indicator asks the firm to consider sub/(NT + NU) for minimisation, not the subsidy<br />
per user <strong>of</strong> the pay-lane (sub/NT). <strong>The</strong> latter indicator was also tested, but appeared to provide<br />
perverse incentives in pushing the toll to very low, even negative, levels. <strong>The</strong> reason is that a<br />
lowering <strong>of</strong> the toll increases NT and therefore helps in lowering sub/NT, but does so at the<br />
expense <strong>of</strong> attracting too many users from route U. By including NU in the denominator <strong>of</strong> the<br />
third term in the indicator, this perverse incentive is removed. Figure 6.2 below will show that, as<br />
the capacity <strong>of</strong> route U and hence its equilibrium use approaches zero, the present indicator<br />
118
emains performing well. <strong>The</strong> declining impact <strong>of</strong> NU in the indicator is matched by the fact that a<br />
low capacity <strong>of</strong> <strong>road</strong> U means that the described perverse incentive in terms <strong>of</strong> inefficient route<br />
split also vanishes.<br />
Appendix 6d presents the analytical solution for this auction, and demonstrates that the bidders<br />
first-order condition for optimising capacity coincides with the second-best first-order condition,<br />
while the optimal toll in both regimes shows a discrepancy which apparently is <strong>of</strong> minor<br />
importance under the base-case parameters.<br />
6.3.5 Sensitivity analysis<br />
<strong>The</strong> previous results for ω are <strong>of</strong> course likely to change with the parameter values chosen. In<br />
order to consider the robustness <strong>of</strong> our results, we have analysed three types <strong>of</strong> <strong>effects</strong>. First, we<br />
will look at the effect <strong>of</strong> changing the capacity <strong>of</strong> the untolled route on ω. Next, the impact <strong>of</strong><br />
demand elasticity on ω for the various auctions is investigated. And, thirdly, we consider changes<br />
in pcap. Finally, we briefly discuss the possible <strong>effects</strong> <strong>of</strong> changing some <strong>of</strong> our basic underlying<br />
assumptions.<br />
Varying the capacity <strong>of</strong> the untolled lane<br />
Figure 6.2 shows the results <strong>of</strong> relative welfare improvements for the various auctions when<br />
changing the capacity <strong>of</strong> the untolled lane (recall that all previous results concern a capacity <strong>of</strong> the<br />
untolled lane <strong>of</strong> 1000). An ω <strong>of</strong> 1 is the first-best result, and both second-best situations approach<br />
the first-best optimum when the capacity <strong>of</strong> the existing <strong>road</strong> decreases and the amount <strong>of</strong><br />
unpriced capacity decreases.<br />
It appears that the well-performing criterion <strong>of</strong> the minimisation <strong>of</strong> travel costs (auction 1: A1)<br />
maintains a high ω, equal to the second-best situation under a zero pr<strong>of</strong>it constraint, for changing<br />
capacities <strong>of</strong> the untolled lane. When this capacity approaches zero, auction 1 approaches<br />
maximum efficiency, since – due to the Mohring-Harwitz result – no subsidies are required when<br />
initial capacity is zero and the new <strong>road</strong> is designed and priced optimally. Auction rule 4 (A4 in<br />
Figure 6.2, minimising travel costs and subsidy divided by total traffic demand) also remains<br />
nearly equal to the second-best situation without zero pr<strong>of</strong>it constraint for all capacities shown.<br />
It appears that results depend heavily on the capacity <strong>of</strong> the untolled lane. <strong>The</strong> figure shows that<br />
when congestion is more likely to occur (when decreasing the capacity <strong>of</strong> the untolled lane), the<br />
performance <strong>of</strong> most indicators improves. An exception is auction rule 2. This reflects that the<br />
discrepancy between optimal capacity and the maximum capacity that can be supplied against zero<br />
pr<strong>of</strong>its increases as the capacity <strong>of</strong> the untolled <strong>road</strong> decreases. This is accompanied by an<br />
increasing difference between the toll from the auction and the second-best optimal toll, thus<br />
inducing further distortions from this auction 2. On the other hand, when the capacity <strong>of</strong> the initial<br />
lane is sufficiently large, it becomes more difficult to achieve any welfare gains at all from adding<br />
a pay-lane, because the second-best constraint <strong>of</strong> unpriced capacity becomes relatively more<br />
important.<br />
119
Omega<br />
1<br />
0.8<br />
0.6<br />
0.4<br />
0.2<br />
0<br />
0 500 1000 1500 2000<br />
Capacity untolled lane<br />
2500 3000 3500 4000<br />
Second-best Second-best zero pr<strong>of</strong>it<br />
A1 min ct+tt (zero subs) A2 max capt (zero subs)<br />
A3 min subs A4 min ct+tt+subs/(nt+nu)<br />
Figure 6.2: <strong>The</strong> index <strong>of</strong> relative welfare improvement for the auctions with various capacities <strong>of</strong><br />
the untolled route<br />
Varying demand elasticity<br />
Figure 6.3 shows the results in terms <strong>of</strong> ω when changing the equilibrium demand elasticity (by<br />
simultaneously changing the parameter values <strong>of</strong> a and d such that the same base equilibrium is<br />
obtained for every elasticity). It indicates that the results are rather robust for different demand<br />
elasticities; the prevailing demand structure is apparently not a crucial factor. This may appear<br />
surprising at first sight, especially because prior studies <strong>of</strong> pr<strong>of</strong>it-maximising tolling on a pay-lane<br />
have emphasised the importance <strong>of</strong> demand elasticity upon its relative efficiency (e.g. Verhoef et<br />
al. 1996; Verhoef and Small, 2004). <strong>The</strong> reason why this is not the case in the present set-up is<br />
that not only the toll but also the capacity <strong>of</strong> the priced <strong>road</strong> is adjusted in response to changes in<br />
demand elasticity. As a result, NU and cU remain constant for nearly each scenario along the<br />
demand elasticities shown in Figure 6.3, with the exception <strong>of</strong> second-best and auction 4 (where<br />
small changes are observed). <strong>The</strong> same holds for cT (constant for all scenarios) and tT (relatively<br />
large changes in a relatively small absolute toll value occur only in – again – second-best and<br />
auction 4). <strong>The</strong> demand elasticity therefore only determines the ‘size’ <strong>of</strong> the new market (on <strong>road</strong><br />
T), expressed in capT and NT, but leaves the relative efficiency <strong>effects</strong> <strong>of</strong> the various scenarios<br />
largely unaffected.<br />
120
Omega<br />
1<br />
0.8<br />
0.6<br />
0.4<br />
0.2<br />
0<br />
-3.5 -3 -2.5 -2 -1.5 -1 -0.5 0<br />
Equilibrium demand elasticity<br />
Second-best Second-best zero pr<strong>of</strong>it<br />
A1 min ct+tt (zero subs) A2 max capt (zero subs)<br />
A3 min subs A4 min ct+tt+subs/(nt+nu)<br />
Figure 6.3: <strong>The</strong> index <strong>of</strong> relative welfare improvement for the auctions with various demand<br />
elasticities<br />
Varying the price <strong>of</strong> <strong>road</strong> capacity<br />
Figure 6.4 shows what happens with ω for the various auctions when changing the unit price <strong>of</strong><br />
<strong>road</strong> capacity (pcap). Note that the patterns are similar to those <strong>of</strong> Figure 6.2. Increasing the price<br />
<strong>of</strong> capacity leads to considerable lower welfare gains for most auctions, except for auction 4 (over<br />
the range shown). Note that the performance <strong>of</strong> auctions 1 and 4 again remains (nearly) equal to<br />
their second-best counterparts. When it becomes cheaper to construct a <strong>road</strong>, it is more likely that<br />
capacities will increase (attracting more <strong>road</strong> users), and hence tolling becomes more efficient for<br />
all cases. <strong>The</strong> results suggest that auction 4 may be particularly useful to policy makers when<br />
considering the construction <strong>of</strong> a new <strong>road</strong> in (congested) urban areas by a private consortium.<br />
Higher land prices may make it more expensive to build a new <strong>road</strong>. <strong>The</strong> relevant part <strong>of</strong> Figure<br />
6.4 to consider is the right-hand side, where the relative advantage <strong>of</strong> auction 4 over the other<br />
auctions increases rapidly.<br />
121
Omega<br />
1<br />
0,8<br />
0,6<br />
0,4<br />
0,2<br />
0<br />
0 1 2 3 4 5 6<br />
Price <strong>of</strong> one unit <strong>road</strong> capacity (Pcap)<br />
Second-best Second-best zero pr<strong>of</strong>it<br />
A1 min ct+tt (zero subs) A2 max capt (zero subs)<br />
A3 min subs A4 min ct+tt+subs/(nt+nu)<br />
Note: high levels <strong>of</strong> capacity prices (more than 5) imply no meaningful results for auctions 1,2 and 3, as they lead to<br />
zero capacities.<br />
Figure 6.4: <strong>The</strong> index <strong>of</strong> relative welfare improvement for the auctions with various prices <strong>of</strong> <strong>road</strong><br />
capacity<br />
Limitations <strong>of</strong> the analysis<br />
<strong>The</strong> above analysis has demonstrated that the relative performance <strong>of</strong> different indicators in<br />
auctions may deviate rather strongly, and that the relative efficiency <strong>of</strong> all indicators may in<br />
addition depend strongly on local circumstances such as the relative size <strong>of</strong> existing unpriced<br />
capacity and the unit price <strong>of</strong> capacity. <strong>The</strong>se conclusions are not very likely to change when<br />
including other complications that may be relevant for the franchising <strong>of</strong> highways; nor is there<br />
any a priori reason to believe that such other complications would systematically change the<br />
ranking <strong>of</strong> the different auctions considered in this chapter. Nevertheless, this is an issue that<br />
deserves further analysis. It is now worthwhile to briefly consider the most pressing<br />
simplifications in the above analysis, and to reflect on how these could be addressed in future<br />
work and what the potential impacts <strong>of</strong> doing so might be.<br />
A first simplification in the model is caused by its static nature. Demand uncertainty, however,<br />
and the question <strong>of</strong> how to deal with it in setting up auctions, raises important questions in<br />
practical highway franchising (e.g. Engel et al. 1996). It could be addressed in our set-up by<br />
making the parameters <strong>of</strong> the demand function random, and by possibly also introducing a risk<br />
premium for private parties’ pr<strong>of</strong>its. <strong>The</strong> resulting model could shed light on a number <strong>of</strong> pressing<br />
questions. Under which conditions does demand uncertainty lead to a stronger risk-averse<br />
behaviour <strong>of</strong> private <strong>road</strong> operators than is socially desirable? And, does some form <strong>of</strong> public<br />
insurance (directly or implicitly via the rules <strong>of</strong> the game in auctions) become desirable? In<br />
auctions such as auction 1 and auction 4, is it feasible and socially desirable to decentralise the<br />
risks involved in demand uncertainty to the private operator through a system <strong>of</strong> taxes and<br />
122
subsidies, which would punish or reward the operator on a per-user basis for exceeding or staying<br />
below the pre-agreed generalised cost level? Are there then other ways to reduce the risk for<br />
private operators, without removing incentives to operate efficiently?<br />
Demand uncertainty is closely related to the problem <strong>of</strong> contract renegotiation. Without demand<br />
uncertainty, there would be little reason to accept such renegotiation. But especially when demand<br />
is uncertain because <strong>of</strong> future public policies such as investment in parallel highway or rail<br />
capacity, things would change. Illustrative <strong>of</strong> this is the experience with the Californian SR-91,<br />
which reverted from private to public ownership in 2003 because <strong>of</strong> a “non-compete clause” in the<br />
original contract that became binding after demand had grown more rapidly than foreseen and<br />
created the desire for additional capacity. <strong>The</strong> same modelling set-up as described for demand<br />
uncertainty could be used to analyse uncertainty-induced renegotiation, and especially the<br />
question <strong>of</strong> whether it can be avoided by adjusting auctions to reflect contingencies. For example,<br />
the government could announce a maximum generalised cost level that it will allow on alternative<br />
connections, above which it will (have the right to) invest in additional capacity.<br />
Another issue concerns the assumption that competing firms are identical, and – especially – have<br />
identical capacity cost functions. A distribution <strong>of</strong> heterogeneous firms is conceptually<br />
straightforward to include in the model, although the analytics might become tedious. When<br />
maintaining the assumption <strong>of</strong> competitive bidding behaviour (no collusion or strategic<br />
interaction) and when different firms’ cost functions are sufficiently close (which appears<br />
reasonable to assume in the longer run for firms that stay in operation), this would not change the<br />
results in any significant way, since firms would still maximise or minimise the specific indicator<br />
used in the auction. If the number <strong>of</strong> firms becomes smaller, and competitive bidding becomes<br />
less likely, the model would change rather drastically, since strategic behaviour and interactions in<br />
the bidding process would have to be taken into account. This will certainly change the outcome<br />
<strong>of</strong> the auctions. Whether it would also affect the ranking <strong>of</strong> indicators obtained here is less certain,<br />
and is left for further research.<br />
Another issue is that private firms might be tempted not to obey what was promised in the bids.<br />
Obviously, a contract between a firm and the government should clearly specify the details <strong>of</strong> the<br />
winning bid (toll and capacity), and penalties should guarantee that companies do make serious<br />
<strong>of</strong>fers. But especially in the context <strong>of</strong> uncertainty, renegotiation and strategic behaviour <strong>of</strong><br />
bidders, the system <strong>of</strong> penalties itself might provide unexpected incentives that are worthy <strong>of</strong><br />
further investigation.<br />
Despite the simplifying assumptions underlying our model and the rather b<strong>road</strong> menu <strong>of</strong> future<br />
research issues that we can identify, the results may still be relevant to governments organising an<br />
auction. If anything, the results show that the choice <strong>of</strong> the “indicator” is – as expected – an<br />
important determinant for the results <strong>of</strong> the auctions. Our results suggest that such an indicator<br />
should include travel times guaranteed (cT), toll levels to be charged (tT), and preferably also the<br />
lump-sum subsidy required (sub). Allowing for such a subsidy improves social welfare when this<br />
subsidy is relevant, but does not seem to diminish the auction’s efficiency when the second-best<br />
optimal level <strong>of</strong> the subsidy becomes small (e.g. when initial capacity becomes small in Figure<br />
6.2).<br />
6.4 Conclusions<br />
Regulation <strong>of</strong> private firms operating <strong>road</strong> infrastructure can take several forms. In this chapter we<br />
have considered regulation by means <strong>of</strong> an auction organised by the government. We studied<br />
private involvement in <strong>road</strong> provision in a competitive bidding setting and analysed the <strong>effects</strong> <strong>of</strong><br />
imposing various auction rules (“indicators”) by the government. We considered a simple network<br />
with one origin and one destination connected by two parallel routes, one <strong>of</strong> which is to be<br />
constructed and operated by a private firm. This is relevant in practice since the expansion <strong>of</strong><br />
existing <strong>road</strong> capacity is <strong>of</strong>ten the type <strong>of</strong> <strong>road</strong> building that is considered nowadays. Using a<br />
123
simulation model, we investigated the <strong>effects</strong> <strong>of</strong> various indicators on the outcomes <strong>of</strong> the auction.<br />
Different criteria may lead to rather different <strong>road</strong> capacities and tolls bid by private companies.<br />
<strong>The</strong> previous literature considered the welfare <strong>effects</strong> <strong>of</strong> different ownership regimes with varying<br />
tolls and capacities; however, to the best <strong>of</strong> our knowledge, the consequences <strong>of</strong> criteria in<br />
auctions on these <strong>effects</strong> had not yet been studied.<br />
We have analysed the welfare consequences <strong>of</strong> four different, but plausible, rules that may be used<br />
by the government to organise the bidding process. For auctions without subsidies, it appeared that<br />
the criterion <strong>of</strong> the minimisation <strong>of</strong> generalised price on the tolled <strong>road</strong> performs just as well as the<br />
second-best situation under a zero pr<strong>of</strong>it constraint. However, an indicator that rewards increases<br />
in capacity does not lead to very promising results in terms <strong>of</strong> welfare. Minimising the requested<br />
subsidy or maximising the bid results in the same outcome as unconstrained pr<strong>of</strong>it maximisation,<br />
and is therefore not very attractive. When allowing for subsidies, the best indicator appeared to<br />
involve the minimisation <strong>of</strong> generalised travel costs including the toll on the new <strong>road</strong>, plus the<br />
subsidy divided by total traffic demand. This indicator outperforms the simpler generalised price<br />
(again including toll) criterion in terms <strong>of</strong> relative efficiency because it not only minimises travel<br />
costs but also permits a subsidy, which is important especially when the second-best optimum<br />
implies operational losses.<br />
Finally, we have looked at the sensitivity <strong>of</strong> the results by changing the capacity <strong>of</strong> the untolled<br />
lane, the equilibrium demand elasticity, and the unit cost <strong>of</strong> capacity. It appears that results change<br />
significantly when changing the capacity <strong>of</strong> the untolled lane. <strong>The</strong> performance <strong>of</strong> most indicators<br />
generally improves when a smaller portion <strong>of</strong> total capacity remains untolled, and when<br />
congestion is more likely to occur (i.e. with a decreasing capacity <strong>of</strong> the untolled lane). On the<br />
other hand, when the capacity <strong>of</strong> the present lane is sufficiently high, it is very hard to achieve<br />
welfare gains. Similar patterns were observed for, respectively, lower versus higher costs <strong>of</strong><br />
capacity. <strong>The</strong> results are rather robust for different demand elasticities. This was mainly because<br />
capacities are adjusted in the face <strong>of</strong> changes in demand elasticity, which affects the scale <strong>of</strong> the<br />
new <strong>road</strong> for all scenarios considered, but not their relative performance.<br />
124
Appendix 6A<br />
List <strong>of</strong> Symbols<br />
N Total number <strong>of</strong> <strong>road</strong> users<br />
NT Number <strong>of</strong> <strong>road</strong> users on the tolled route<br />
NU Number <strong>of</strong> <strong>road</strong> users on the untolled route<br />
D(N) Inverse demand function<br />
cT Average social (=marginal private) costs on the tolled route<br />
cU Average social (=marginal private) costs on the untolled route<br />
capT Capacity <strong>of</strong> the tolled route<br />
capU Capacity <strong>of</strong> the untolled route<br />
W Welfare<br />
B Benefits<br />
πt Pr<strong>of</strong>it for the firm that provides <strong>road</strong> T<br />
pi Price for route i (including cost and toll)<br />
tT Toll<br />
pcap Price <strong>of</strong> one unit <strong>of</strong> <strong>road</strong> capacity<br />
ki Average free-flow user cost on route i<br />
bi Slope <strong>of</strong> the average cost function on route i (dependent on capacity)<br />
β Constant<br />
ω Index <strong>of</strong> relative welfare improvement<br />
a Slope <strong>of</strong> the demand curve (negative)<br />
d Intersection <strong>of</strong> the demand curve with the vertical axis<br />
sub amount <strong>of</strong> subsidy included in the <strong>of</strong>fer <strong>of</strong> the private firm<br />
125
Appendix 6B<br />
Numerical Results<br />
Scenario NT NU capT capU W πT tT tU sub ω<br />
Base equilibrium 0 1000 0 1000 48000 0 0 0 - -<br />
First-best 757 316 2395 1000 57621 0 6.32 6.32 - 1<br />
Second-best<br />
Second-best (zero<br />
786 345 2486 1000 57439 -4519 0.57 0 - 0.98<br />
pr<strong>of</strong>it)<br />
Pr<strong>of</strong>it<br />
441 632 1395 1000 55621 0 6.32 0 - 0.79<br />
maximisation<br />
Auction 1<br />
Minimise<br />
generalised price<br />
(including toll) on<br />
route T<br />
Auction 2<br />
Maximise capacity<br />
<strong>of</strong> route T<br />
Auction 3<br />
Minimise subsidy<br />
Auction 4<br />
Minimise<br />
generalised price<br />
(including toll) on<br />
route T including<br />
subsidy divided by<br />
total travel demand<br />
221<br />
441<br />
360<br />
221<br />
810<br />
816<br />
632<br />
700<br />
816<br />
325<br />
697<br />
1395<br />
1800<br />
697<br />
2561<br />
1000<br />
1000<br />
1000<br />
1000<br />
1000<br />
52553<br />
55621<br />
54180<br />
52553<br />
57430<br />
811<br />
0<br />
0<br />
0<br />
0<br />
10<br />
6.32<br />
10<br />
10<br />
0.18<br />
0<br />
0<br />
0<br />
0<br />
0<br />
-<br />
0<br />
0<br />
-811<br />
4980<br />
0.47<br />
0.79<br />
0.64<br />
0.47<br />
0.98<br />
126
Appendix 6C<br />
Description <strong>of</strong> the Lagrangian objective functions<br />
<strong>The</strong> relevant optima (the numerical results can be found in Appendix 6b) have been found by<br />
solving the following Lagrangian functions for the benchmark situations and the auctions under<br />
study. <strong>The</strong>se functions were differentiated with respect to the relevant choice variables to find the<br />
first-order conditions. It would take too far to present all these necessary first-order conditions, so<br />
we have limited ourselves to presenting the Lagrangians <strong>of</strong> our problems. <strong>The</strong> Lagrange<br />
multipliers λ T and λ U refer to the equilibrium constraints that marginal benefits equal prices on<br />
both <strong>road</strong>s. <strong>The</strong> Langrange multiplier on the zero pr<strong>of</strong>it constraint is λ π .<br />
First-best optimum<br />
N<br />
( cap + cap ) * p + λ ( D(<br />
N)<br />
− p ) + λ ( D(<br />
N)<br />
p )<br />
L = ∫ D(<br />
n)<br />
dn − NT<br />
* cT<br />
− NU<br />
* cU<br />
− U T cap T<br />
T U −<br />
0<br />
This equation was solved for NT , NU<br />
, capT<br />
, tT<br />
, tU<br />
, λT<br />
and λ U .<br />
Second-best optimum<br />
N<br />
( cap + cap ) * p + λ ( D(<br />
N)<br />
− p ) + λ ( D(<br />
N)<br />
p )<br />
L = ∫ D(<br />
n)<br />
dn − NT<br />
* cT<br />
− NU<br />
* cU<br />
− U T cap T<br />
T U −<br />
0<br />
This equation was solved for NT , NU<br />
, capT<br />
, tT<br />
, λT<br />
and λ U , with t U = 0.<br />
Second-best optimum with zero pr<strong>of</strong>it condition<br />
N<br />
L = ∫ D(<br />
n)<br />
dn − N<br />
+ λ<br />
π<br />
0<br />
* c<br />
− N<br />
* c<br />
( t * N − cap * p + sub)<br />
T<br />
T<br />
T<br />
T<br />
T<br />
cap<br />
U<br />
U<br />
−<br />
( cap + cap ) * p + λ ( D(<br />
N)<br />
− p ) + λ ( D(<br />
N)<br />
− p )<br />
This equation was solved for NT , NU<br />
, capT<br />
, tT<br />
, λ T , λπ<br />
and λ U , with t U = 0.<br />
Pr<strong>of</strong>it maximisation<br />
L = tT<br />
* NT<br />
− capT<br />
* pcap<br />
+ sub + λ T ( D(<br />
N)<br />
− pT<br />
) + λU<br />
( D(<br />
N)<br />
− pU<br />
)<br />
This equation was solved for NT , NU<br />
, capT<br />
, tT<br />
, λT<br />
and λ U , with t U = 0.<br />
Auction 1: Minimise p T (zero pr<strong>of</strong>its and no subsidy)<br />
L = pT<br />
+ λ T D(<br />
N)<br />
− pT<br />
+ λU<br />
D(<br />
N)<br />
− pU<br />
+ λπ<br />
tT<br />
* NT<br />
− capT<br />
* pcap<br />
+ sub<br />
This equation was solved for NT , NU<br />
, capT<br />
, tT<br />
, λ T , λπ<br />
and λ U , with t U = 0.<br />
U<br />
( ) ( ) ( )<br />
Auction 2: Maximise cap T (zero pr<strong>of</strong>its and no subsidy)<br />
L = capT<br />
+ λ T D(<br />
N)<br />
− pT<br />
+ λU<br />
D(<br />
N)<br />
− pU<br />
+ λπ<br />
tT<br />
* NT<br />
− capT<br />
* pcap<br />
+<br />
This equation was solved for NT , NU<br />
, capT<br />
, tT<br />
, λ T , λπ<br />
and λ U , with t U = 0.<br />
( ) ( ) ( sub)<br />
Auction 3: Minimise sub (zero pr<strong>of</strong>its with subsidy)<br />
= sub + λ<br />
T D(<br />
N)<br />
− pT<br />
+ λU<br />
D(<br />
N)<br />
− pU<br />
+ λπ<br />
tT<br />
* NT<br />
− capT<br />
* p<br />
( ) ( ) ( + sub)<br />
L cap<br />
T<br />
cap<br />
T<br />
T<br />
U<br />
U<br />
U<br />
U<br />
127
This equation was solved for NT , NU<br />
, capT<br />
, tT<br />
, λ T , λU<br />
, λπ<br />
and sub , with t U = 0.<br />
Auction 4: Minimise p T + sub /( NT<br />
+ NU<br />
) (zero pr<strong>of</strong>its with subsidy)<br />
= pT<br />
+ sub /( NT<br />
+ NU<br />
) + λ T D(<br />
N)<br />
− pT<br />
+ λU<br />
D(<br />
N)<br />
− pU<br />
+ λπ<br />
tT<br />
* NT<br />
− capT<br />
* p<br />
This equation was solved for NT , NU<br />
, capT<br />
, tT<br />
, λ T , λU<br />
, λπ<br />
and sub , with t<br />
U = 0.<br />
( ) ( ) ( + sub)<br />
L cap<br />
128
Appendix 6D<br />
Derivation <strong>of</strong> first-order solutions <strong>of</strong> optimal capacity and<br />
optimal toll for the second-best situation and auction 4<br />
This appendix presents the derivation <strong>of</strong> the expressions for the first-order conditions for<br />
optimising capacity and optimising toll for both the second-best situation and auction rule 4<br />
(minimise generalised travel costs plus subsidy divided by total traffic demand). It will be shown<br />
that the bidders first-order condition for optimising capacity coincides with the second-best firstorder<br />
condition, while the optimal toll in both regimes shows a certain discrepancy. We will start<br />
with the derivation <strong>of</strong> the analytical solution for the second-best case. This is followed by the<br />
derivation <strong>of</strong> the optimal toll and the first-order expression <strong>of</strong> optimal capacity for auction rule 4.<br />
Second-best optimal toll and expression for optimal capacity<br />
N<br />
( cap + cap ) * p + ( p − D(<br />
N)<br />
) + λ ( p − D(<br />
N)<br />
)<br />
L = ∫ D(<br />
n)<br />
dn − NT<br />
* cT<br />
− NU<br />
* cU<br />
− U T cap λ T T<br />
U U (1)<br />
∂L<br />
∂N<br />
T<br />
∂L<br />
∂N<br />
U<br />
0<br />
∂L<br />
∂cap<br />
= D − c<br />
T<br />
= D − c<br />
T<br />
= −N<br />
U<br />
T<br />
− N<br />
T<br />
− N<br />
U<br />
∂cT<br />
⎛ ∂cT<br />
∂D<br />
⎞ ∂D<br />
* + λ ⎜ − ⎟<br />
T<br />
− λU<br />
* = 0<br />
(2)<br />
∂NT<br />
⎝ ∂NT<br />
∂NT<br />
⎠ ∂N<br />
∂c<br />
⎛ ⎞<br />
U ∂D<br />
* ⎜<br />
∂cU<br />
∂D<br />
− λ + − ⎟<br />
T λU<br />
= 0<br />
(3)<br />
∂N<br />
∂N<br />
⎜ ⎟<br />
U<br />
⎝ ∂NU<br />
∂N<br />
⎠<br />
∂cT<br />
∂cT<br />
* − pcap<br />
+ λ T * = 0<br />
(4)<br />
∂cap<br />
∂cap<br />
T<br />
T<br />
∂L<br />
= λ T = 0<br />
(5)<br />
∂t<br />
T<br />
∂L<br />
= cT<br />
+ t<br />
∂λ<br />
T<br />
T<br />
− D = 0<br />
∂L<br />
∂λU<br />
= cU<br />
− D = 0<br />
Substituting equation (7) and (5) in (3) yields:<br />
∂cU<br />
NU<br />
*<br />
∂NU<br />
λ U =<br />
(8)<br />
∂cU<br />
∂D<br />
−<br />
∂N<br />
∂N<br />
U<br />
<strong>The</strong> solution for the optimal second-best toll follows from substituting (8), (6) and (5) in (2):<br />
(6)<br />
(7)<br />
129
t<br />
T<br />
∂D<br />
−<br />
∂c<br />
N<br />
T ∂c<br />
∂<br />
U<br />
= NT<br />
* − NU<br />
* *<br />
(9)<br />
∂N<br />
N ∂cU<br />
∂D<br />
T ∂ U −<br />
∂N<br />
∂N<br />
U<br />
This is the standard second-best optimal toll consisting <strong>of</strong> the first-best toll minus a term that<br />
corrects for congestion on the untolled parallel <strong>road</strong> (see also Verhoef, Nijkamp and Rietveld,<br />
1996).<br />
<strong>The</strong> second-best first-order condition for optimal capacity is obtained when (5) is substituted in<br />
(4):<br />
p<br />
∂c<br />
T<br />
cap = NT<br />
* −<br />
(10)<br />
∂capT<br />
As for first-best capacity choice, capacity should be expanded up to the point where the marginal<br />
costs <strong>of</strong> doing so (pcap on the left-hand side <strong>of</strong> (10)) are equal to the marginal benefits (the righthand<br />
side).<br />
Auction rule 4: optimal toll and first-order condition for optimal capacity<br />
sub<br />
L = pT<br />
+<br />
NT<br />
+ NU<br />
First we derive:<br />
+ λ T T ( U U<br />
π T T T * cap (11)<br />
∂L = λ π +<br />
∂sub<br />
N<br />
1<br />
+ N<br />
= 0 ⇒ λπ<br />
=<br />
N<br />
−1<br />
+ N<br />
(12)<br />
T<br />
U<br />
( p − D N)<br />
) + λ ( p − D(<br />
N)<br />
) + λ ( t * N − cap p + sub)<br />
∂L<br />
= 1+ ∂tT<br />
λ<br />
N<br />
and use these expressions directly in what follows.<br />
T<br />
U<br />
− N<br />
T<br />
U<br />
λT + λπ<br />
* NT<br />
= 0 ⇒ T = −1+<br />
=<br />
(13)<br />
NT<br />
+ NU<br />
NT<br />
+ NU<br />
<strong>The</strong> first-order conditions for NU and NT are:<br />
∂L<br />
∂N<br />
U<br />
∂L<br />
∂N<br />
T<br />
= −<br />
∂c<br />
=<br />
∂N<br />
( N + N )<br />
T<br />
T<br />
T<br />
−<br />
sub<br />
U<br />
2<br />
( N + N )<br />
T<br />
sub<br />
NU<br />
−<br />
N + N<br />
U<br />
2<br />
T<br />
U<br />
∂D<br />
* −<br />
∂N<br />
NU<br />
−<br />
N + N<br />
T<br />
U<br />
U<br />
⎛<br />
* ⎜<br />
∂c<br />
⎜<br />
⎝ ∂N<br />
⎛ ∂cU<br />
∂D<br />
⎞<br />
+ λ ⎜ −<br />
⎟<br />
U<br />
= 0<br />
(14)<br />
⎝ ∂NU<br />
∂NU<br />
⎠<br />
T<br />
T<br />
∂D<br />
⎞ ⎛ ⎞<br />
⎟ ⎜<br />
∂D<br />
⎟<br />
1<br />
− − λ − * = 0<br />
⎟ U<br />
t<br />
∂ ⎜ ⎟<br />
T (15)<br />
N ⎠ ⎝ ∂N<br />
⎠ NT<br />
+ NU<br />
Substituting (15) in (14) leaves the following expression for the optimal toll:<br />
∂cT<br />
∂cU<br />
t T = NT<br />
* − λ U * * ( NT<br />
+ NU<br />
)<br />
(16)<br />
∂N<br />
∂N<br />
T<br />
U<br />
130
Rewriting (14) we find an expression for λ U . Using this expression in (16) gives the following<br />
solution for the optimal toll for auction rule 4:<br />
t<br />
N<br />
∂D<br />
∂c<br />
−<br />
U<br />
∂c<br />
∂c<br />
∂N<br />
∂N<br />
sub<br />
* − N<br />
−<br />
(17)<br />
NT<br />
+ NU<br />
−<br />
−<br />
∂N<br />
∂N<br />
∂N<br />
∂N<br />
T<br />
U<br />
U<br />
T = T<br />
U * *<br />
*<br />
∂N<br />
c<br />
T ∂N<br />
∂ U U ∂D<br />
∂cU<br />
∂D<br />
U<br />
U<br />
Note that (17) is an implicit solution for tT , since sub still appears on the right-hand side.<br />
Nevertheless, the expression in (17) is insightful as it shows that the toll expression is almost<br />
equal to the second-best toll as shown in (9), but differs in an extra term that should be subtracted.<br />
For a positive subsidy, the optimal toll for this auction rule will be below the optimal second-best<br />
toll, as is also shown in the numerical results. Admittedly simplistic intuition suggests that this last<br />
term need not be large (and hence does not lead to large deviations from the optimal second-best<br />
sub<br />
toll), because the auction rule asks bidders to also minimise .<br />
N + N<br />
T u<br />
Finally, the expressions for λT and λπ in equations (12) and (13) imply:<br />
∂L<br />
∂cap<br />
p<br />
T<br />
∂cT<br />
=<br />
∂cap<br />
T<br />
∂c<br />
NU<br />
−<br />
N + N<br />
U<br />
T<br />
∂c<br />
p<br />
T<br />
cap NT<br />
∂c<br />
p<br />
T<br />
cap<br />
* + = * + = 0 ⇒<br />
∂cap<br />
N + N N + N ∂cap<br />
N + N<br />
T<br />
T<br />
U<br />
T<br />
cap = −N<br />
T * (18)<br />
∂capT<br />
Indeed, this term equals the first-order condition for optimal capacity in the second-best situation<br />
(as shown in (10)).<br />
T<br />
U<br />
T<br />
T<br />
U<br />
131
Chapter 7<br />
Governmental competition in <strong>road</strong> charging and capacity<br />
choice<br />
7.1 Introduction<br />
Chapter 2 has shown that prices should be set equal to marginal costs to reach an efficient<br />
allocation <strong>of</strong> resources. However, this policy prescription holds exactly only under first-best<br />
conditions, and even then only when distributional considerations are ignored, or lump-sum<br />
redistribution is possible. One <strong>of</strong> the conclusions in that chapter also indicated that, in reality,<br />
these conditions are never completely met, i.e. there are always additional constraints, apart<br />
from the inevitable technological ones. <strong>The</strong> regulator has then to resort to ‘second-best’<br />
<strong>pricing</strong>: setting prices that are available optimally under the constraints applying. It is<br />
interesting to study welfare consequences <strong>of</strong> these, more realistic, prices.<br />
This chapter focuses on one particular reason for the presence <strong>of</strong> second-best constraints: the<br />
fact that authorities <strong>of</strong> different jurisdictions pursue their own objectives and use their own<br />
policy instruments. Such interactions between different governments (e.g. federal level versus<br />
regions or cities) introduce the potential for vertical or horizontal tax competition 17 . <strong>The</strong><br />
chosen instrument values may be optimal for the population represented by the decision<br />
maker (for instance, the inhabitants <strong>of</strong> a region), but may at the same time be suboptimal<br />
when also considering the interest <strong>of</strong> people elsewhere (in different regions). In such cases,<br />
the values <strong>of</strong> the policy variables determined by the one authority are beyond direct control <strong>of</strong><br />
other authorities, implying a second-best constraint.<br />
It is obvious that different types <strong>of</strong> institutional relationships may be relevant in the field <strong>of</strong><br />
transport policy competition. This chapter addresses competition in <strong>road</strong> capacity and <strong>road</strong><br />
tolling between a city and a region. Many transport problems have a strong local or urban<br />
dimension. This may explain the increasing interest in giving sufficient possibilities for<br />
regional/local authorities to deal with these issues: at least they know local circumstances<br />
best. So far, regions or cities usually have had some form <strong>of</strong> regulation within their control<br />
(e.g. parking), but their possibilities to implement other forms <strong>of</strong> transport (<strong>pricing</strong>) policy are<br />
generally limited. Nevertheless, it seems that initiatives with greater policy responsibilities at<br />
a lower level may be gaining ground, and can be very successful in addressing local transport<br />
problems. Good examples are value <strong>pricing</strong> projects in the US (see also Chapter 3), and the<br />
London congestion charging scheme. One difficulty that <strong>of</strong>ten arises with such schemes is the<br />
involvement <strong>of</strong> multiple levels <strong>of</strong> government, which typically can differ in their objectives<br />
and powers. For example, local authorities may assign lower weights to the welfare <strong>of</strong> nonresidents<br />
than do national or regional governments. <strong>The</strong> cost <strong>of</strong> funds may differ, because <strong>of</strong><br />
differences in the types and levels <strong>of</strong> taxes that governments rely on for revenue. And control<br />
<strong>of</strong> various <strong>pricing</strong> and non-<strong>pricing</strong> policies may be divided up between levels <strong>of</strong> governments.<br />
All these differences create the potential for conflict, as well as strategic behaviour in the<br />
form <strong>of</strong> tax exporting, tax competition, etc.<br />
In this chapter we study the welfare consequences <strong>of</strong> strategic interaction between an urban<br />
government and a region, both having two different policy instruments: tolls, and investment<br />
in <strong>road</strong> capacity. We will use a small two-link network that enables us to study these choices<br />
in the simplest possible network configuration. <strong>The</strong> chapter begins with a discussion <strong>of</strong> the<br />
previous literature relevant in the context <strong>of</strong> our analysis. Section 7.3 introduces the model,<br />
17 Vertical tax competition refers to a situation in which governments at different hierarchical levels compete,<br />
while horizontal tax competition results when governments at the same level compete.<br />
133
and presents the simulation results for different situations (ranging from the first-best<br />
optimum as a useful benchmark to various non-cooperative game situations). This section<br />
also presents some sensitivity analyses. Section 7.4 concludes.<br />
7.2 Previous literature on governmental competition in a small network<br />
setting: a review<br />
Chapter 6 already discussed specific studies dealing with second-best <strong>pricing</strong> <strong>of</strong> <strong>road</strong> use.<br />
<strong>The</strong>re, we focused on the inclusion <strong>of</strong> private firms in the provision and tolling <strong>of</strong> <strong>road</strong><br />
infrastructure. <strong>The</strong> analysis considered the auctioning <strong>of</strong> concessions to privately operate the<br />
<strong>road</strong>, and various criteria (“indicators”) that a government may use to realise more satisfying<br />
bids (in terms <strong>of</strong> tolls and <strong>road</strong> capacity) from interested firms.<br />
Here, we focus on the competition between different governments choosing tolls and<br />
capacities. An interesting study in this context is by De Borger and Van Dender (2005) who<br />
analysed the duopolistic interaction between facilities subject to congestion (such as airports<br />
or <strong>road</strong>s) that supply perfect substitutes and make sequential decisions on capacities and<br />
prices. <strong>The</strong> situation <strong>of</strong> competition (Nash equilibria) is compared with the results <strong>of</strong> a<br />
monopoly and first-best outcomes. <strong>The</strong>y show that price competition between duopolists is<br />
beneficial for consumers, but introducing capacity competition is harmful. <strong>The</strong> duopolist<br />
situation <strong>of</strong>fers lower service quality (defined as the inverse <strong>of</strong> time costs) than the<br />
monopolist, who does provide the socially-optimal quality level.<br />
Tax competition between different levels <strong>of</strong> government may occur (for a review, see De<br />
Borger and Proost (2004)). Optimal transport <strong>pricing</strong> with multiple governments can become<br />
complicated, because many vertical and horizontal fiscal externalities occur simultaneously,<br />
with spillovers <strong>of</strong> congestion and environmental externalities (see Markusen et al., 1995;<br />
Wilson, 1999). First, the importance <strong>of</strong> international transport, including pure transit flows, in<br />
some countries implies that a substantial share <strong>of</strong> locally-generated externalities is due to<br />
foreigners. To the extent that these flows can be taxed, this may induce tax-exporting<br />
behaviour. Second, international transport implies that the tax base <strong>of</strong> transport services is to a<br />
large extent mobile between countries. This may be the basis for inefficient tax competition.<br />
Third, vertical externalities arise because different levels <strong>of</strong> government (e.g. city and national<br />
governments) may be interested in taxing the same base, for example, in an effort to tackle<br />
pollution or congestion. Alternatively, they may actually use different instruments to deal<br />
with the same problem. Fourth, some transport externalities generate international spillovers<br />
(e.g. global warming, acid rain, etc.), which should be appropriately accounted for. Finally,<br />
apart from tax externalities, transport generates various expenditure externalities: investment<br />
in infrastructure has benefit spillovers to foreigners, local <strong>road</strong> investments affect federal fuel<br />
tax revenues, etc. It appears that literature on these kinds <strong>of</strong> tax competition issues in transport<br />
(we restrict ourselves to transport and do not include the public finance literature) is fairly<br />
limited (De Borger and Proost, 2004). But some studies addressing tax (in terms <strong>of</strong> <strong>road</strong><br />
<strong>pricing</strong>) competition in transport have been found and will be discussed in the following<br />
subsections.<br />
7.2.1 Horizontal linkages<br />
Horizontal tax competition refers to a situation where governments at the same hierarchical<br />
level compete; for instance, Austria and Switzerland compete for toll revenues from traffic<br />
between Germany and Italy. This example, in which <strong>road</strong> users have a choice <strong>of</strong> routes and<br />
where both routes are priced by a different government, is called parallel tax competition.<br />
Only a few models look explicitly at parallel tax competition between two governments.<br />
De Borger et al. (2005) analyse tax competition between countries that each maximise the<br />
surplus <strong>of</strong> local users plus tax revenues in controlling local traffic and through-traffic (similar<br />
134
to the situation <strong>of</strong> Austria and Switzerland). Three different <strong>pricing</strong> systems were considered:<br />
one with toll discrimination between local traffic and transit traffic; with only uniform tolls;<br />
and one system with tolls on local drivers only. <strong>The</strong> results suggest that the welfare <strong>effects</strong> <strong>of</strong><br />
introducing transit tolls are large, but that differentiation <strong>of</strong> tolls between the different types<br />
<strong>of</strong> traffic as compared with uniform tolling does not yield large welfare differences. Countries<br />
may decide to cooperate on toll setting, but this leads only to small welfare gains in<br />
comparison with non-cooperative transit tolling (Nash equilibrium with uniform tolls).<br />
Another study compares the outcomes <strong>of</strong> tax policies <strong>of</strong> Belgium and the rest <strong>of</strong> Europe in a<br />
model with both domestic and international freight transport flows and domestic passenger<br />
transport (De Borger et al. (2004)). <strong>The</strong>y used a numerical optimisation model to determine<br />
optimal <strong>pricing</strong> policies (consistent with EU legislation: no discrimination between domestic<br />
and international freight transport) for four situations: a reference situation reflecting<br />
unchanged policies; a federal optimum; a local optimum for one individual country; and the<br />
Nash equilibrium solution. <strong>The</strong> local optimum for Belgium and the Nash equilibrium<br />
demonstrated the inefficiency <strong>of</strong> tax exporting behaviour: taxes on freight flows were found<br />
to be substantially higher than in the federal optimum, depending on the share <strong>of</strong> international<br />
flows in countries. <strong>The</strong> local optimum for Belgium (maximise welfare <strong>of</strong> Belgian residents)<br />
involved higher welfare than both the federal optimum and the Nash equilibrium outcome.<br />
<strong>The</strong> former was due to tax exporting (taxes on freight transport largely exceed marginal<br />
external costs), the latter to the absence <strong>of</strong> reactions by the rest <strong>of</strong> Europe.<br />
A second type <strong>of</strong> horizontal tax competition can be referred to as serial tax competition.<br />
Traffic using a route that sequentially runs through the territory <strong>of</strong> different governments can<br />
be taxed by each <strong>of</strong> the governments. <strong>The</strong>se countries may apply individual tolling<br />
instruments on their part <strong>of</strong> the network, with potentially substantial welfare losses as a result.<br />
Despite its importance, serial tax competition in transport has not been given much attention<br />
in the literature (De Borger and Proost, 2004). One exception is the empirical work <strong>of</strong><br />
Levinson (2001). He examines the question why some US States impose tolls while others<br />
rely more heavily on fuel and other taxes. <strong>The</strong> share <strong>of</strong> highway revenues from tolls is<br />
explained by the share <strong>of</strong> non-residential workers, policies <strong>of</strong> neighbouring States, historical<br />
factors, and the population. <strong>The</strong> analysis confirms theory in the sense that jurisdictions are<br />
more likely to opt for toll financing (instead <strong>of</strong> fuel or other taxes) when the share <strong>of</strong> nonresidential<br />
drivers is large. Obviously, tolls become more attractive because they allow price<br />
discrimination and tax exporting. It is also suggested that decentralising financial<br />
responsibilities and creating smaller jurisdictions (the greater the share <strong>of</strong> non-local traffic)<br />
increases the likelihood <strong>of</strong> tolling.<br />
7.2.2 Vertical linkages<br />
Vertical tax competition refers to competition between different hierarchical levels <strong>of</strong><br />
government. This issue too is relevant in practice, but again it has hardly been addressed in<br />
the literature. Most transport users are not only taxed or subsidised via various instruments,<br />
but typically these different taxes are set by different levels <strong>of</strong> government. Road users, for<br />
instance, may face fuel taxes determined by national governments and parking fees or cordon<br />
tolls implemented by cities or regions. <strong>The</strong> different responsibilities for transport policy<br />
instruments induces a number <strong>of</strong> complicated interactions between governments because <strong>of</strong><br />
overlap <strong>of</strong> tax bases, differences in objectives between governments, spillovers <strong>of</strong><br />
externalities, etc. A number <strong>of</strong> reasons can be identified to explain why the resulting tax<br />
schemes will generally be suboptimal (De Borger and Proost, 2004):<br />
• Overlapping tax bases may create fiscal externalities: an increase in national fuel<br />
taxation reduces demand for transport, including local traffic, and therefore affects<br />
revenues from the local government (e.g. toll revenues, public transport revenues).<br />
135
<strong>The</strong>se side <strong>effects</strong> are <strong>of</strong>ten ignored by the national government in setting fuel taxes,<br />
yielding too high national taxes;<br />
• Tax exporting by the city government: a city will take more care <strong>of</strong> its own residents<br />
than <strong>of</strong> commuters. This may lead to excessively high congestion charges for<br />
commuters from an overall welfare viewpoint;<br />
• Externality spillovers: local authorities only care about externalities imposed on local<br />
residents; this induces them to set local taxes too low;<br />
• <strong>The</strong> use <strong>of</strong> imperfect and different instruments by different governments: local<br />
authorities only have a few instruments available, such as cordon tolls and parking<br />
charges, to control externalities.<br />
<strong>The</strong> welfare <strong>effects</strong> <strong>of</strong> a combination <strong>of</strong> different <strong>pricing</strong> instruments (in many cases to<br />
internalise external costs) have been studied extensively in the literature. For instance,<br />
Calthrop et al. (2000) used a numerical simulation model <strong>of</strong> an urban transport market to<br />
examine the efficiency gains from various parking policies with and without a simple cordon<br />
system. <strong>The</strong>y show that the <strong>pricing</strong> <strong>of</strong> parking and <strong>road</strong> use needs to be simultaneously<br />
determined, and that second-best <strong>pricing</strong> <strong>of</strong> all parking spaces produces higher welfare gains<br />
than the use <strong>of</strong> a single-ring cordon scheme, though marginally lower than the combination <strong>of</strong><br />
a cordon charge with resource-cost <strong>pricing</strong> <strong>of</strong> parking places.<br />
<strong>The</strong>se studies show the efficiency <strong>effects</strong> <strong>of</strong> various <strong>pricing</strong> instruments available to<br />
governments, but do not address the interaction <strong>effects</strong> when different levels <strong>of</strong> government<br />
are responsible for different <strong>pricing</strong> instruments that affect users from different jurisdictions.<br />
One study that does analyse a policy game between two different levels <strong>of</strong> governments with<br />
two different <strong>pricing</strong> policies in transport is a case study described in the EU project MC-<br />
ICAM (MC-ICAM, 2004). This analysis uses a quasi-general equilibrium model (TRENEN)<br />
with two policy instruments: a parking fee set by the city to be paid by all drivers in the city,<br />
and a cordon toll set by the region only to be paid by the commuters. Toll revenues are<br />
redistributed by the region to commuters only, while parking fee revenues are redistributed to<br />
urban citizens. <strong>The</strong> city maximises the welfare <strong>of</strong> the inhabitants only, whereas the region<br />
maximises a weighted sum <strong>of</strong> the welfare <strong>of</strong> its urban citizens and its commuters (where the<br />
weights correspond to their relative numbers in the total population). In this setting three<br />
different solutions have been analysed:<br />
• A centralised solution, in which the region chooses both <strong>pricing</strong> instruments<br />
simultaneously and maximises the aggregate welfare <strong>of</strong> commuters and urban citizens;<br />
• A non-cooperative Nash equilibrium, in which each government takes the other’s choice<br />
as given;<br />
• A Stackelberg equilibrium, in which the region acts as leader and chooses its policy<br />
instrument (cordon toll) first.<br />
<strong>The</strong> results show that an efficiency loss occurs in the policy game situations because the city<br />
overcharges for parking in order to export taxes to commuters who are outside its jurisdiction<br />
(but not unlimited because city inhabitants also pay the parking fee). <strong>The</strong> region responds by<br />
setting a toll lower than the first-best level, because it does not want to discourage commuting<br />
too much. <strong>The</strong> non-cooperative Nash and Stackelberg equilibria achieve most <strong>of</strong> the welfare<br />
improvements (respectively, 89% and 92%) when compared with the (optimal) centralised<br />
solution. <strong>The</strong> reasons for these fairly high welfare levels, given by the authors, are that both<br />
governments are assumed to maximise welfare rather than revenues, and that parking fees and<br />
cordon tolls are substitutes. Further improvements can be achieved by changing the sharing<br />
rules for tax revenue in favour <strong>of</strong> the city inhabitants, although this comes at a cost <strong>of</strong> greater<br />
inequity to commuters.<br />
136
7.3 A modelling framework to study government competition<br />
Although the literature on tax competition in transport is still relatively small, a number <strong>of</strong><br />
cases have already been considered as we discussed in the previous section. It is important to<br />
emphasise how our work differs from this earlier work. We will deal with competition<br />
between a region and a city that differ in their objectives and instruments, similar to the case<br />
study in MC-ICAM (2004). However, we bring <strong>road</strong> capacity into the analysis as a policy<br />
variable that is available to both government levels besides the <strong>road</strong> charges that they both<br />
can set. Parking fees, in contrast, are not included because they would be indistinguishable<br />
from the <strong>road</strong> tax on the city’s infrastructure in our simple network.<br />
<strong>The</strong> set-up appears to be relevant for current transport policies. Many urban areas <strong>of</strong>ten<br />
experience congestion problems, and it is no longer considered straightforward (in so far as it<br />
has been) that a national government should decide how to deal with these. Decentralisation<br />
has given more powers to lower levels <strong>of</strong> government, which have more knowledge <strong>of</strong> the<br />
local situation. When local authorities decide on their policy approach, a realistic set <strong>of</strong><br />
instruments would include capacity enlargement besides <strong>road</strong> <strong>pricing</strong>. We therefore study the<br />
interaction between a region and a city that are free to choose the capacity <strong>of</strong> the <strong>road</strong>s and<br />
<strong>road</strong> tolls, and focus on the welfare consequences <strong>of</strong> their behaviour under various gametheoretic<br />
settings.<br />
We consider a simple serial type <strong>of</strong> <strong>road</strong> network with two links, one <strong>of</strong> which is controlled<br />
by the regional authority and the other by the city. This <strong>road</strong> network is used by three<br />
different types <strong>of</strong> drivers. Commuters live in the region and work in the city, and therefore use<br />
both the regional <strong>road</strong> and the infrastructure <strong>of</strong> the city. Regional drivers live in the region<br />
and never enter the city, and therefore only use the regional <strong>road</strong>. And city drivers live in the<br />
city and never use the regional <strong>road</strong>. Reverse commuting (living in the city, travelling to the<br />
region) is therefore ignored. Both <strong>road</strong>s are subject to congestion.<br />
Commuters therefore pay both tolls when levied, while regional and city drivers only pay the<br />
toll set by their own government. <strong>The</strong> two levels <strong>of</strong> government are assumed to receive the<br />
full revenues <strong>of</strong> the tax instruments they control, but they also pay for their own (<strong>road</strong>)<br />
capacity. Each government maximises the welfare <strong>of</strong> its inhabitants.<br />
Various settings <strong>of</strong> interest can be identified. A first one involves the global optimum, where<br />
both tolls and both capacities are set so as to maximise the aggregate surplus (in the region<br />
and city together). Next, without policy coordination, two equilibrium concepts may, in<br />
principle, be relevant: a Nash equilibrium, in which both actors take the other’s choices as<br />
given, and a Stackelberg equilibrium, where a leader takes the follower’s responses into<br />
account, while the follower takes the leader’s action as given.<br />
Our analysis <strong>of</strong> toll and capacity decisions considers these as the results from a sequential,<br />
two-stage, game in capacities and prices. In the first stage both governments make capacity<br />
choices, and in the second stage toll competition takes place. This appears realistic because<br />
also in practice tolls can be varied in the short run, after capacities have been set. <strong>The</strong> twostage<br />
nature <strong>of</strong> the game gives rise to various combinations <strong>of</strong> Nash and Stackelberg games in<br />
the various stages, theoretically even including reversed leadership in the two stages. We will<br />
consider a few <strong>of</strong> these; namely, those combinations that appear more realistic.<br />
Since we are interested in the relative efficiency <strong>of</strong> these non-cooperative situations, we<br />
compare the outcomes with the first-best optimal solution in this setting, i.e., the global<br />
optimum mentioned before. To express equilibrium welfare levels in relative terms, we will,<br />
<strong>of</strong> course, also need to specify a reference equilibrium in our numerical exercises.<br />
7.3.1 Model formulation<br />
We consider what is probably the simplest possible set-up to study the problem just described.<br />
<strong>The</strong> network consists <strong>of</strong> two serial links, connecting the regional (suburban) area with the<br />
137
centre <strong>of</strong> a city. It is assumed that the <strong>pricing</strong> and capacity choice <strong>of</strong> each link is the<br />
responsibility <strong>of</strong> a different government. In the base-case equilibrium, both links have equal<br />
capacities and zero tolls. Commuters from the region (group R1) are assumed to enter the city,<br />
and consequently use both links. Regional drivers (R2) and city drivers (C) only use the link in<br />
their own jurisdiction. Both governments are assumed to maximise social surplus for their<br />
inhabitants, defined as total (Marshallian) benefits minus total user costs (including time<br />
costs), minus the capacity costs.<br />
<strong>The</strong> model contains three different demand functions (one for each group), and two averageuser<br />
cost functions: c1 (NC , NR1; cap1) for city <strong>road</strong> 1, and c2 (NR1, NR2; cap2) for regional<br />
<strong>road</strong> 2. At any interior equilibrium, average costs for the full trip, plus tolls, should be equal<br />
to marginal benefits for each type <strong>of</strong> user 18 . While Appendix 7b will derive first-order<br />
conditions for general demand and cost functions, <strong>of</strong> unspecified functional forms, we will be<br />
using linear functions in the numerical model. <strong>The</strong> inverse demand functions Dj can then be<br />
written as:<br />
Dj = dj – aj * Nj j = C,R1,R2 (1)<br />
where dj and aj are parameters, and Nj gives traffic flow for group j.<br />
Next, for both links i, the average social cost (ci) consists <strong>of</strong> a free-flow cost component ki,<br />
and a congestion cost component, which is assumed to be proportional to total <strong>road</strong> usage on<br />
that link (Ni, with N1 = NC + NR1 and N2 = NR1 + NR2), and inversely related to its capacity<br />
(capi):<br />
ci = ki + bi *Ni/capi i = 1,2 (2)<br />
where ki and bi are parameters.<br />
<strong>The</strong> generalised price pi for a link adds the toll ti to the average cost:<br />
pi = ci + ti i = 1,2 (3)<br />
<strong>The</strong> generalised prices pj for the three groups are then as follows:<br />
pR1 = p1 + p2<br />
pR2 = p2 (4)<br />
pC = p1<br />
Next, operational pr<strong>of</strong>its (π) for the city or the region are defined as the difference between<br />
revenues from the tolls and the net costs for <strong>road</strong> provision (capacity costs). We thus neglect<br />
other costs for the government, such as maintenance and costs involved with toll collection<br />
(or assume that these are proportional to capacity). <strong>The</strong> capacity costs are proportional to<br />
capacity (capi) via a fixed price per capacity unit (pcap, equal for both links) 19 , while the<br />
revenues are the product <strong>of</strong> the toll and traffic demand. Pr<strong>of</strong>it thus becomes:<br />
πi = ti*Ni – capi* pcap i = 1,2 (5)<br />
18 Corner solutions, where the demand <strong>of</strong> at least one <strong>of</strong> the groups is reduced to zero, will not be considered.<br />
19 Note that the average cost function implied by (2) and (3) and the constancy <strong>of</strong> the unit price for capacity<br />
implies that our <strong>road</strong> network qualifies for the application <strong>of</strong> the Mohring-Harwitz (1962) result on exact selffinancing<br />
<strong>of</strong> optimally designed and priced <strong>road</strong>s (see also below).<br />
138
Total social surplus (W, the sum <strong>of</strong> surpluses in the city and the region) is our measure <strong>of</strong><br />
welfare, and is equal to the ‘variable’ social surplus (the benefits B as given by the relevant<br />
area under the demand curve, minus total user costs), minus the total capacity costs:<br />
W = B – NC*c1 – NR2*c2 - NR1*(c1+c2) - (cap1+ cap2)* pcap (6)<br />
W can be decomposed into city and regional welfare as follows:<br />
WC = BC – NC*c1 + NR1*t1 - cap1* pcap (7a)<br />
WR = BR1 + BR2 – NR1*(c1+c2) – NR2*c2 - NR1*t1 - cap2* pcap (7b)<br />
Note that tolls paid by commuters (residents <strong>of</strong> the region) to make use <strong>of</strong> the city link are a<br />
transfer between jurisdictions and thus increase the welfare <strong>of</strong> the city and reduce the welfare<br />
levels <strong>of</strong> the region. All other toll payments cancel out in local welfare functions, because<br />
they constitute a transfer from local residents to the local authorities. All parameters are nonnegative,<br />
and we will only consider interior equilibria, where both links are at least marginally<br />
used, and all OD pairs are at least marginally active.<br />
<strong>The</strong> (three) user equilibrium conditions are then:<br />
Dj = pj. j = C,R1,R2 (8)<br />
Appendix 7b derives analytical expressions for toll rules and investment rules for three cases:<br />
namely, the first-best case; the case where the city optimises, taking the regional toll and<br />
capacity as given; and the case where the region optimises, taking the city’s toll and capacity<br />
as given. In this section, we will proceed by presenting comparative static results for the<br />
different games under consideration. <strong>The</strong>se reflect the impacts <strong>of</strong> toll and investment rules<br />
upon possible equilibria, but are <strong>of</strong> course less general than our analytical results because they<br />
pertain to an assumed set <strong>of</strong> demand and cost functions. To compensate for the latter<br />
disadvantage, sensitivity analyses will be provided in Section 7.3.4.<br />
<strong>The</strong> insights from Appendix 7b can be summarised as follows. <strong>The</strong> first-best equilibrium<br />
involves tolls that are equal to marginal external costs and a conventional investment rule that<br />
equates marginal costs <strong>of</strong> capacity expansion to the marginal benefits. When either<br />
government sets their instruments in isolation, the investment rule does not change: given that<br />
the level <strong>of</strong> <strong>road</strong> use capacity is set at the efficient level. Because the levels <strong>of</strong> <strong>road</strong> use will be<br />
different than in the first-best equilibrium, the capacity level will, <strong>of</strong> course, be different from<br />
the first-best level. Both governments would have an incentive to set the toll above the<br />
marginal external cost. For the city this extracts additional toll revenues from regional users.<br />
For the region, this is meant to (imperfectly) internalise the congestion externality that R1<br />
drivers impose upon one another on the city’s <strong>road</strong>, link 1. We will now turn to the simulation<br />
results to see how these forces affect the eventual equilibrium.<br />
7.3.2 Numerical example<br />
For the ‘base case’ <strong>of</strong> our numerical model, the following parameter values were chosen: a =<br />
0.6; dC = dR2 = 140; dR1 = 280; k1 = k2 = 20; b1 = b2 = 20; pcap = 2; cap1 = 500; and cap2 = 500.<br />
<strong>The</strong> base case equilibrium leads to a reasonable demand elasticity <strong>of</strong> –0.4 for each group, at<br />
an equilibrium use <strong>of</strong> 167 <strong>of</strong> both city drivers and regional drivers, twice as many commuters,<br />
and equilibrium travel costs twice the ‘free-flow’ levels. <strong>The</strong> equality between equilibrium<br />
demands for groups R2 and C was motivated by the desire to have the example symmetric in<br />
as many aspects as possible. Appendix 7c shows the detailed numerical results for the various<br />
scenarios under study. <strong>The</strong>se parameter values were otherwise not motivated by any desire to<br />
139
epresent a realistic situation. Before turning to the game equilibrium situations, we will first<br />
discuss a few benchmark situations.<br />
Global first-best optimum<br />
<strong>The</strong> first-best social optimum (maximum welfare) in this network involves an optimisation <strong>of</strong><br />
both the capacity <strong>of</strong> the links and all tolls (first-best <strong>pricing</strong> requires tolling on all links <strong>of</strong> the<br />
network). <strong>The</strong> optimal <strong>road</strong> price, to be set by both governments, equals 6.32 (see Appendix<br />
7c), bridging the gap between marginal private costs <strong>of</strong> 26.32 and marginal social costs <strong>of</strong><br />
32.64. In Appendix 7b we derive the first-best expression for both tolls. <strong>The</strong> first-best toll<br />
equals the marginal external (congestion) cost for both <strong>road</strong>s. Most welfare gains are realised<br />
by the region, a situation which can be explained by the large number <strong>of</strong> commuters<br />
(experiencing congestion) who live in the region (the welfare gains per initial traveller are<br />
higher for the city).<br />
<strong>The</strong> total capacity <strong>of</strong> both <strong>road</strong>s together is about 3.4 times as high as the initial capacity. This<br />
is, <strong>of</strong> course, rather extreme. It is a direct consequence <strong>of</strong> the level <strong>of</strong> pcap that we have<br />
chosen, relative to the other parameters, and could therefore easily have been avoided. We<br />
have, however, chosen this parameterisation so as to create sufficient disparity between the<br />
initial equilibrium capacities and the optimum, so that relative differences between various<br />
options can easily be observed. <strong>The</strong> zero pr<strong>of</strong>it result for the provision <strong>of</strong> both links confirms<br />
the Mohring and Harwitz (1962) result <strong>of</strong> optimal investment. <strong>The</strong> revenues from an optimal<br />
toll will just cover the costs <strong>of</strong> the facility provider as long as there are no economies or<br />
diseconomies <strong>of</strong> scale in facility capacity and the facility provider is investing optimally (see<br />
Appendix 7b for a sketch <strong>of</strong> a pro<strong>of</strong>).<br />
Second-best optima: one government optimises<br />
For the evaluation <strong>of</strong> the various situations to be considered, it is useful to know the (welfare)<br />
properties <strong>of</strong> the second-best solutions where only one government charges a toll for its link<br />
and optimises its capacity, with the purpose <strong>of</strong> maximising local welfare only, while the other<br />
region does not respond and sticks to the initial choices. <strong>The</strong>re are two such second-best<br />
situations. Appendix 7b shows the first-order expressions for tolls and capacity in both cases.<br />
<strong>The</strong> second-best situation in which the city sets the toll and capacity so as to achieve<br />
maximum welfare for its residents (NC) leads to a considerably higher welfare level for the<br />
city compared with the first-best situation. In contrast, the welfare <strong>of</strong> the region is decreased<br />
considerably. Total welfare is decreased when compared with the base case equilibrium,<br />
leading to a negative value for the relative efficiency indicator ω 20 . <strong>The</strong> toll is equal to 78.11,<br />
more than 12 times as high as the first-best toll. <strong>The</strong> city has an incentive to set such a high<br />
toll because the toll revenues extracted from the regional commuters (NR1) increase<br />
accordingly. This is <strong>of</strong> course constrained by the fact that the fees are also paid by the city<br />
residents, but note that, initially, only 1/3 <strong>of</strong> intra-city traffic concerns city residents.<br />
Moreover, toll payments by city residents, although distorting prices in the city, in themselves<br />
only constitute transfers within the city. <strong>The</strong> number <strong>of</strong> commuters decreases significantly, as<br />
well as the welfare levels in the region. <strong>The</strong> city link is also used less intensively by city<br />
drivers compared with the base-case situation, because <strong>of</strong> the excessive toll. <strong>The</strong> first-order<br />
expression <strong>of</strong> the toll set by the city under these conditions consists <strong>of</strong> the first-best toll with a<br />
positive mark-up (see Appendix 7b). Capacity chosen by the city is considerably lower<br />
compared with optimal <strong>pricing</strong>, but the ratio capacity/demand has not changed, because the<br />
first-best rule for optimising capacity still applies.<br />
20 This indicator ω is defined as the difference between welfare in the situation under study and base-case<br />
welfare divided by the difference between first-best welfare and base-case welfare.<br />
140
<strong>The</strong> other second-best situation is when the region optimises under the assumption that the<br />
city does not change capacity and toll. It appears that the demand for transport is not very<br />
different from the base-case and first-best situations. Appendix 7b shows that the region will<br />
apply a capacity rule similar to the first-best rule, which means that the capacity <strong>of</strong> link 2 will<br />
also not deviate much from optimal investment. This, and a toll that internalises congestion<br />
for groups R1 and R2 (the former imperfectly), will increase the welfare <strong>of</strong> the region. Since<br />
the welfare <strong>of</strong> the city remains almost constant (relative to the base-case situation), overall<br />
welfare will also increase (ω = 0.48). <strong>The</strong> higher relative efficiency is to a large extent<br />
explained by the fact that the region cannot tax city residents and hence will not raise the toll<br />
with the purpose <strong>of</strong> extracting revenues from non-inhabitants. Furthermore, it internalises part<br />
<strong>of</strong> the congestion externality in the city: namely, ins<strong>of</strong>ar as it is imposed by regional residents<br />
on themselves.<br />
7.3.3 Non-cooperative game equilibria<br />
We will now consider the numerical outcomes when governments compete in order to<br />
achieve their own objectives when choosing tolls and <strong>road</strong> capacities. Different situations will<br />
be considered, corresponding with different types <strong>of</strong> game theoretic settings. Two different<br />
plausible equilibrium concepts <strong>of</strong> a non-cooperative game can be distinguished in such a<br />
setting: a Nash equilibrium and a Stackelberg equilibrium. In a Nash equilibrium, each<br />
government takes the other’s choice as given. A Stackelberg game assumes that one <strong>of</strong> the<br />
two governments acts as leader and chooses its policy instruments taking the other’s response<br />
into account, while the other government responds while assuming that the leader’s choice<br />
will not be affected.<br />
<strong>The</strong> present set-up is somewhat more complicated than that which we have just described,<br />
because we model the choice <strong>of</strong> capacity and tolls as a two-stage game. <strong>The</strong> choice <strong>of</strong><br />
capacity is made first, followed by the decision to set the toll in the second stage. As a result,<br />
different types <strong>of</strong> behaviour could be assumed for each stage (Nash versus Stackelberg), with<br />
two types <strong>of</strong> leadership (i.e. the city or the region). This leaves seven different study situations<br />
when excluding reversed leadership between stages. First we analyse the Full Nash situation,<br />
in which both prices and capacities result from a non-cooperative Nash game. <strong>The</strong>n we<br />
consider three different cases with city leadership in the first, second, or both stages, followed<br />
by the same three situations with the region as the leader.<br />
Full Nash equilibrium<br />
In what we will call the Full Nash equilibrium, each government takes the other’s choice as<br />
given in both stages. <strong>The</strong> city government chooses capacity that is the best reply to a given<br />
capacity selected by the region, while the regional government will select capacity as its best<br />
reply to the city government’s selected capacity. Given these capacity choices, tolls are set in<br />
a similar way resulting in a stable Nash equilibrium in prices and capacities. Figure 7.1 shows<br />
this graphically. <strong>The</strong> thinner lines give iso-surplus contours in the capacity-capacity space,<br />
and connect capacity combinations yielding equal local surpluses, given that a Nash price<br />
game will be played once the capacities are set. <strong>The</strong> solid contours refer to the city and<br />
represent a higher surplus when moving to the right. <strong>The</strong> dashed contours refer to the region<br />
and represent a higher surplus when moving up. Next, the thicker lines give the reaction<br />
function: the best response (in terms <strong>of</strong> capacity) given the capacity set by the other<br />
government, and given (again) that a Nash price game will be played once the capacities are<br />
set. <strong>The</strong> solid city’s reaction function is therefore found as the connection between absolutely<br />
vertically-sloped points <strong>of</strong> the city’s various iso-surplus functions. <strong>The</strong> region’s reaction<br />
function, in a similar fashion, connects absolutely horizontally-sloped points <strong>of</strong> the region’s<br />
141
various iso-surplus functions. Finally, the intersection <strong>of</strong> the two reaction functions then<br />
defines the Full Nash equilibrium.<br />
Appendix 7c shows that the Nash situation results in a small (overall) welfare gain (ω = 0.07)<br />
compared with the base-case equilibrium. <strong>The</strong> city again has the incentive to extract toll<br />
revenues from the non-residents (commuters), leading to excessively high tolls. Regional tolls<br />
are somewhat lower than the second-best “region” situation because congestion in the city has<br />
reduced. <strong>The</strong> capacities in both jurisdictions are adjusted more or less proportionally to<br />
equilibrium link flows compared to the first-best situation, but not exactly because capacity<br />
choice has become a strategic instrument in the game’s first stage.<br />
City leadership<br />
When introducing strategic leadership in our game-theoretic framework, we can in fact then<br />
distinguish three different situations depending on the stage(s) in which leadership is<br />
exercised. <strong>The</strong> first is the Nash (<strong>pricing</strong>)/Stackelberg (capacity) situation; then, second, its<br />
mirror image is the Stackelberg (price)/Nash capacity situation, and the third possibility is the<br />
“Full” (both stages) Stackelberg equilibrium. Assuming that the city is the leader, prices in the<br />
first situation are set according to the properties <strong>of</strong> a Nash game (without any leadership),<br />
while the city takes account <strong>of</strong> the capacity chosen by the follower (region) when planning its<br />
own capacity level. <strong>The</strong> second situation is the opposite <strong>of</strong> the first: city leadership in setting<br />
tolls, while a first-stage Nash game characterises decisions on capacities. <strong>The</strong> last situation is<br />
a full Stackelberg solution in which both prices and capacities are set by the city, while<br />
anticipating correctly the reaction <strong>of</strong> the region for both instruments. Because there is no<br />
compelling reason why the one situation is more relevant than the other, we will consider<br />
them all, and determine in particular also whether there are large differences between them.<br />
We will coin the different games such that Nash/Stack means Nash behaviour in the short run<br />
(the second, price stage) and Stackelberg in the long run (the first, capacity stage).<br />
For the two Nash/Stack games, the same iso-surplus contours and reaction functions are<br />
relevant as for the Full Nash game discussed earlier. When the city is the leader, it takes the<br />
reaction <strong>of</strong> the region into account (the region’s reaction function is known to the city) when<br />
setting its own capacity. In fact, the city searches the highest surplus level for each point on<br />
the region’s reaction function. This must be the point where the reaction function <strong>of</strong> the<br />
region and the iso-surplus curve <strong>of</strong> the city have equal slopes. This is the Nash/Stack<br />
equilibrium point (city leader) indicated in Figure 7.1. <strong>The</strong> increase in capacity <strong>of</strong> the region<br />
is very small compared with the full Nash equilibrium. <strong>The</strong> change in capacity chosen by the<br />
leader is somewhat larger. This explains the higher surplus level obtained by the leader<br />
caused by the information advantage for capacity setting only. But it is not only the leader<br />
that gains in terms <strong>of</strong> welfare; the follower also benefits from the higher level <strong>of</strong> capacity:<br />
both jurisdictions end up on a higher iso-surplus contour. However, the welfare changes are<br />
very small: given that the <strong>pricing</strong> game entails Nash competition, the nature <strong>of</strong> the capacity<br />
game appears less important for the final outcome.<br />
142
Cap1 (city)<br />
1100<br />
1075<br />
1050<br />
1025<br />
1000<br />
975<br />
950<br />
925<br />
1020 1040 1060 1080 1100 1120 1140<br />
Cap2 (region)<br />
Figure 7.1: Reaction functions and iso-surplus contours for Nash <strong>pricing</strong> games<br />
*<br />
•<br />
Reaction<br />
function city<br />
Reaction<br />
function region<br />
Iso-surplus<br />
contours city<br />
Iso-surplus<br />
contours region<br />
Full Nash<br />
equilibrium point<br />
Nash/Stack<br />
equilibrium point<br />
(city leader)<br />
Nash/Stack<br />
equilibrium point<br />
(region leader)<br />
When the price stage is characterised by Stackelberg competition, another set <strong>of</strong> iso-surplus<br />
contours and (hence) reaction functions <strong>of</strong> course applies. Figure 7.2 illustrates the sets<br />
applying under city leadership in the price stage. Two equilibria are <strong>of</strong> interest: the<br />
Stack/Nash where capacities are chosen in a Nash way (where the reaction functions cross),<br />
and the Stack/Stack where both instruments are chosen in a Stackelberg way. It is now<br />
possible for the city to anticipate the toll response <strong>of</strong> the region. This leads to slightly higher<br />
city tolls than under Nash <strong>pricing</strong>, as well as slightly higher capacities, and a slightly higher<br />
welfare level for the city compared with the Nash <strong>pricing</strong> games. <strong>The</strong> welfare <strong>of</strong> the region<br />
decreases slightly in this situation compared with the various Nash-<strong>pricing</strong> equilibria. What<br />
causes the differences between Stackelberg <strong>pricing</strong> under city-leadership and Nash <strong>pricing</strong> to<br />
be so small, relatively speaking? It reflects that the region’s toll response to the city’s toll<br />
decision is relatively unimportant to the city. This unimportance stems from two facts. First,<br />
the region’s toll is relatively small compared with the city’s toll, so that changes in the<br />
region’s toll (even when significant in a relative sense) are relatively unimportant to the city.<br />
Secondly, the region’s toll aims to internalise the region’s commuter congestion, both on the<br />
region’s and the city’s <strong>road</strong>. Because a change in the city’s toll only affects congestion for<br />
some <strong>of</strong> the region’s travellers, and only for a part <strong>of</strong> their trip, also relative changes <strong>of</strong> the<br />
region’s toll in response to city toll changes will be limited.<br />
Similar to the previous Stackelberg capacity game (with Nash prices), the city seeks a point<br />
on the reaction line <strong>of</strong> the region with slopes equal to its own iso-surplus curve. This is the<br />
Stack/Stack equilibrium point in Figure 7.2. <strong>The</strong> Stack/Nash equilibrium is again located at<br />
the intersection <strong>of</strong> the reaction functions.<br />
*<br />
•<br />
143
Cap1 (city)<br />
1100<br />
1075<br />
1050<br />
1025<br />
1000<br />
975<br />
950<br />
925<br />
1020 1040 1060 1080 1100 1120 1140<br />
Cap2 (region)<br />
Reaction<br />
function city<br />
Reaction function<br />
region<br />
Iso-surplus<br />
contours city<br />
Iso-surplus<br />
contours<br />
Stack/Nash<br />
equilibrium point<br />
Stack/Stack<br />
equilibrium point<br />
Figure 7.2: Reaction functions and iso-surplus contours for Stackelberg <strong>pricing</strong> games (city<br />
leadership)<br />
Region leadership<br />
Region leadership can also assume three forms. <strong>The</strong> earlier Figure 7.1 already illustrated the<br />
equilibrium situations with Nash <strong>pricing</strong> behaviour. <strong>The</strong> equilibrium outcome with the region<br />
as leader in the capacity game is therefore shown in this same figure (Nash/Stack point,<br />
region leader). It can be verified in Figure 7.1, that both jurisdictions would prefer the other to<br />
lead in a Stackelberg capacity game, when followed by a Nash price game. Such seemingly<br />
counterintuitive results are not that rare in game theory (see Dowrick, 1986). Note that both<br />
jurisdictions prefer to lead in a Stack/Nash game when compared with Nash/Nash.<br />
While the differences between equilibria with Stackelberg leadership in the capacity stage and<br />
Nash in the <strong>pricing</strong> stage terms <strong>of</strong> capacity are very small, price leadership for the region does<br />
change outcomes. When setting its own toll, the region takes into account the incentive <strong>of</strong> the<br />
city to adapt its own toll. This leads to a regional toll that is around three times the toll under<br />
other games. <strong>The</strong> city toll is somewhat lower. As a consequence, commuters are less inclined<br />
to travel, leading to less pressure on <strong>road</strong> space in the city. Capacity chosen by the city is<br />
therefore lower than in the other non-cooperative game situations, and that <strong>of</strong> the region is<br />
slightly higher. <strong>The</strong> main reason why the region, when leading the price stage, increases its<br />
toll is that, by doing so, it can discourage its commuters from travelling in the city and, hence,<br />
‘losing’ toll revenues to the other government. Again, the nature <strong>of</strong> the game in the capacity<br />
stage is less important for the eventual outcome as soon as we know that the region leads the<br />
price game. <strong>The</strong> Stack/Stack and Stack/Nash equilibrium points are relatively close in Figure<br />
7.3.<br />
<strong>The</strong>refore, whereas price leadership <strong>of</strong> the city leads to only small changes compared with<br />
Nash price behaviour, the differences are bigger when leadership <strong>of</strong> the region is at stake. <strong>The</strong><br />
explanation mirrors the one given earlier. <strong>The</strong> relatively high toll levels in the city, and the<br />
direct losses for the region stemming from this, make it worthwhile for the region to adapt<br />
their own toll with the purpose <strong>of</strong> affecting the city’s toll.<br />
<strong>The</strong>se situations are shown in Figure 7.3. <strong>The</strong> reaction functions and surplus contours are<br />
again different from Figures 7.1 and 7.2. Surplus levels are higher for the region and lower for<br />
•<br />
144
the city than in Figure 7.2. Price leadership may be attractive to the region, but it is not<br />
beneficial for overall welfare, given the negative value for ω mentioned in Appendix 7c. <strong>The</strong><br />
combination <strong>of</strong> high toll levels with relatively small levels <strong>of</strong> capacity does not contribute to<br />
high welfare levels.<br />
Cap1 (city)<br />
1000<br />
975<br />
950<br />
925<br />
900<br />
875<br />
850<br />
825<br />
1060 1080 1100 1120 1140 1160 1180 1200<br />
Cap2 (region)<br />
Reaction<br />
function city<br />
Reaction<br />
function region<br />
Iso-surplus<br />
contours city<br />
Iso-surplus<br />
contours region<br />
Stack/Nash<br />
equilibrium point<br />
Stack/Stack<br />
equilibrium point<br />
Figure 7.3: Reaction functions and iso-surplus contours for Stackelberg <strong>pricing</strong> games<br />
(region leadership)<br />
Summary <strong>of</strong> the previous findings<br />
Figure 7.4 illustrates the differences in capacities (left panel) and tolls for the different<br />
scenarios in our numerical example. While the assumed symmetry in the numerical example<br />
leads to identical toll levels and capacity in the first-best equilibrium, as well as in the basecase,<br />
the figure shows that all other regimes produce asymmetric outcomes. Independent <strong>of</strong><br />
the type <strong>of</strong> game, we find that in the game equilibria, capacities are below first-best levels and<br />
tolls are above first-best levels, while the region has a higher capacity and a lower toll than<br />
the city. <strong>The</strong> interpretation is as given before. Next, the differences between the game<br />
theoretic equilibria are relatively small. More precisely, there are two clusters <strong>of</strong> equilibria:<br />
one cluster in which the region leads in the price stage, and one cluster that encompasses all<br />
other regimes. <strong>The</strong> differences within the clusters are so small that the dots in Figure 7.4<br />
cannot even be distinguished graphically. But also the two clusters are relatively close,<br />
compared to the first-best choices <strong>of</strong> tolls and capacities. This suggests that the main issue is<br />
not which exact type <strong>of</strong> game is played between the two actors, but much more whether there<br />
is cooperation (leading to first-best) or competition between governments, where <strong>of</strong> secondary<br />
importance is the question who is leading in the price stage (if there is a leader). Leadership in<br />
the capacity stage is nearly without consequences in our numerical model.<br />
<strong>The</strong> previous results show that competition between two different governments, in this<br />
setting, may not necessarily improve the welfare <strong>of</strong> society compared with a reasonably<br />
realistic initial situation, and, even if it does, the gains may be relatively small. <strong>The</strong> results<br />
depend heavily on the asymmetry that commuters should pay a toll levied by the city; while<br />
the opposite situation does not occur, this gives the city a tax-exporting instrument. <strong>The</strong><br />
•<br />
145
difference between both second-best situations illustrates this. In the non-cooperative game<br />
situations too, we find that the city has an incentive to set excessive tolls.<br />
We find that Stackelberg leadership in one or both instruments improves the welfare <strong>of</strong> the<br />
leader when compared with a game with Nash properties. Being the leader in the toll stage is<br />
more important than in the capacity game. Under Nash prices, a jurisdiction may in fact<br />
actually prefer the other government to lead in the capacity game, rather than leading<br />
themselves. But leading in the price stage may also be more important to one party than to the<br />
other. Factors that are <strong>of</strong> influence here are the Nash tolls set by the other government (the<br />
higher this toll, the more relevant it is to affect it), and the sensitivity <strong>of</strong> the other<br />
government’s toll to one’s own toll (the stronger this sensitivity, the more relevant it is to<br />
affect it).<br />
Cap1 (city)<br />
1700<br />
1600<br />
1500<br />
1400<br />
1300<br />
1200<br />
1100<br />
1000<br />
900<br />
800<br />
700<br />
Second-best city<br />
S/N (region)<br />
All other regimes<br />
Stack/Stack<br />
(region)<br />
First-best<br />
600<br />
500<br />
Base case<br />
Second-best<br />
region<br />
500 600 700 800 900 1000 1100 1200 1300 1400 1500 1600 1700<br />
Cap2 (region)<br />
Second-best city<br />
80<br />
First-best<br />
All other<br />
regimes<br />
S/N (region)<br />
Full St (region)<br />
Second-best<br />
0<br />
Base case<br />
0 10<br />
region<br />
20 30 40 50 60 70 80<br />
Figure 7.4: Overview <strong>of</strong> equilibria capacity levels (left panel) and tolls (right panel) for the<br />
different regimes<br />
7.3.4 Sensitivity analysis<br />
<strong>The</strong> results shown above are, <strong>of</strong> course, likely to change with the parameter values chosen. In<br />
order to consider the robustness <strong>of</strong> our results, we have analysed two types <strong>of</strong> <strong>effects</strong>. First,<br />
we will look at the effect <strong>of</strong> changing the demand elasticity. While undoubtedly affecting the<br />
absolute impacts <strong>of</strong> different schemes, it is also <strong>of</strong> interest to see whether it affects their<br />
relative performance. Next, the impact <strong>of</strong> changes in pcap will be considered. This is a means<br />
<strong>of</strong> controlling for the relative importance <strong>of</strong> congestion management, as opposed to strategic<br />
considerations, in the setting <strong>of</strong> tolls. We will summarise our findings by reporting the<br />
impacts on our efficiency indicator ω for changing the demand elasticity, and on a slightly<br />
different welfare indicator (the share <strong>of</strong> the optimal welfare) when changing the price <strong>of</strong><br />
capacity.<br />
t1 (city)<br />
70<br />
60<br />
50<br />
40<br />
30<br />
20<br />
10<br />
t2 (region)<br />
146
Omega<br />
0.9<br />
0.5<br />
0.1<br />
-2.5 -2 -1.5 -1 -0.5 0<br />
-0.3<br />
-0.7<br />
-1.1<br />
-1.5<br />
-1.9<br />
-2.3<br />
-2.7<br />
Equilibrium demand elasticity<br />
Second-best city Second-best region Full Nash (1)<br />
Nash/Stack city (1) Stack/Nash city (1) Stack/Stack city (1)<br />
Nash/Stack region (1) Stack/Nash region (2) Stack/Stack region (2)<br />
Figure 7.5: Indexes <strong>of</strong> relative welfare improvement with varying demand elasticities<br />
Varying demand elasticity<br />
Figure 7.5 shows the results in terms <strong>of</strong> ω when changing both the equilibrium demand<br />
elasticities from relatively elastic (left-hand side) to relatively inelastic (right-hand side) (by<br />
simultaneously changing the parameter values <strong>of</strong> a and d, for all demand functions, such that<br />
the same base equilibrium is obtained for every elasticity). While showing 9 indicators ω,<br />
only four clusters can be distinguished visually. This reflects that the relative closeness <strong>of</strong> the<br />
Full Nash, Nash/Stack city, Stack/Stack city, Stack/Nash city and Nash/Stack region remains.<br />
<strong>The</strong>se cases all come under the heading “Group 1”. <strong>The</strong> same holds for closeness within<br />
“Group 2”, comprising the Stack/Stack region and Stack/Nash region. <strong>The</strong>se similarities,<br />
already identified for our base parametrisation, are therefore robust and do not depend on the<br />
assumed demand elasticity. However, all schemes become less efficient when demand<br />
becomes less elastic. <strong>The</strong> “Second-best city” shows why: the city has a greater incentive to<br />
exploit its market power when demand becomes less elastic. <strong>The</strong> relative importance <strong>of</strong> the<br />
socially inefficient motive for tolling (revenue extraction from regional drivers by the city)<br />
rises compared with the socially-efficient motive (congestion internalisation). Only the<br />
“second-best region”, where the city’s toll is fixed at zero, does not suffer from this<br />
inefficiency, as shown by the course <strong>of</strong> the associated curve.<br />
Varying the price <strong>of</strong> <strong>road</strong> capacity<br />
Changing prices <strong>of</strong> <strong>road</strong> capacity (pcap), our welfare indicator ω unfortunately becomes less<br />
insightful. <strong>The</strong> reason is that, when the price <strong>of</strong> capacity increases (when moving to the right),<br />
the difference between welfare in the optimal situation and the base case becomes rapidly<br />
smaller, because welfare levels in the base case remain relatively constant. It is then not so<br />
much the welfare level <strong>of</strong> the situation under study that determines the score <strong>of</strong> the welfare<br />
indicator, but rather the small number <strong>of</strong> the denominator. All ω’s, consequently, reflect the<br />
changing difference between first-best and equilibrium rather the welfare in the region under<br />
147
consideration. <strong>The</strong>refore, we simply decided to use the welfare <strong>of</strong> the situation under study as<br />
a fraction <strong>of</strong> the first-best welfare level.<br />
Figure 7.6 shows that, when the price <strong>of</strong> <strong>road</strong> capacity changes, the performance <strong>of</strong> all<br />
scenarios remains rather constant. About 80% <strong>of</strong> the first-best welfare level is achieved in the<br />
various scenarios, with the second-best region situation performing relatively best for all<br />
prices <strong>of</strong> <strong>road</strong> capacity. With lower prices <strong>of</strong> capacity, congestion becomes more easily solved<br />
through capacity adjustments. <strong>The</strong> region reacts accordingly by setting a lower toll. <strong>The</strong><br />
distortive impact <strong>of</strong> tolling by the city (caused by the city’s extraction <strong>of</strong> toll revenues from<br />
regional drivers) remains important, but the city’s toll levels will not change much. As a<br />
result, welfare fractions remain fairly unchanged. Note that the same two clusters <strong>of</strong> regimes<br />
emerge as in Figure 7.4.<br />
Welfare level as a fraction <strong>of</strong> first-best welfare<br />
1<br />
0.9<br />
0.8<br />
0.7<br />
1 1.5 2 2.5<br />
Price <strong>of</strong> one unit <strong>road</strong> capacity<br />
3 3.5 4<br />
Second-best city Second-best region Full Nash (1)<br />
Nash/Stack city (1) Stack/Nash city (1) Stack/Stack city (1)<br />
Nash/Stack region (1) Stack/Nash region (2) Stack/Stack region (2)<br />
Figure 7.6: Welfare level for various situations as a fraction <strong>of</strong> first-best situation with<br />
varying prices <strong>of</strong> <strong>road</strong> capacity<br />
7.4 Conclusions<br />
In this study we have analysed policy interactions between an urban and a regional<br />
government with different objectives (namely maximisation <strong>of</strong> their own citizens’ welfare)<br />
and two policy instruments (toll and capacity) available. We considered a simple serial<br />
network with two <strong>road</strong>s. This setting is relevant in practice since many cities experience<br />
congestion problems, while it is <strong>of</strong>ten commuters residing in a region that suffer from<br />
congestion and who would pay city tolls. Using a simulation model, we investigated the<br />
welfare consequences <strong>of</strong> the various regimes that result when both governments compete, and<br />
take sequential decisions on prices and capacities with the aim to maximise their local social<br />
surplus. <strong>The</strong> first-best situation is a useful benchmark, and can be regarded as a situation <strong>of</strong><br />
optimal instrument choice by a central government, or as the result from policy coordination.<br />
Our analysis gives some useful insights into the joint <strong>pricing</strong>-capacity decisions with two<br />
governments involved. Competition between governments may not be very beneficial to<br />
overall welfare in society compared with one central government. It appears that the tendency<br />
<strong>of</strong> tax exporting is very strong in this setting where commuters have to pay <strong>road</strong> tolls set by<br />
the city government. <strong>The</strong> incentive to set excessive tolls is present in all scenarios where the<br />
city has control over this instrument.<br />
148
We find that Stackelberg leadership in one or both instruments improves the welfare <strong>of</strong> the<br />
leader when compared with a game with Nash properties. Being the leader in the toll stage is<br />
more important than in the capacity game. Under Nash prices, a jurisdiction may in fact<br />
actually prefer the other government to lead in the capacity stage, rather than leading<br />
themselves. But leading in the price stage may also be more important to the one party than to<br />
the other. Factors that are <strong>of</strong> influence here are the Nash tolls set by the other government (the<br />
higher this toll, the more relevant it is to affect it), and the sensitivity <strong>of</strong> the other<br />
government’s toll to one’s own toll (the stronger this sensitivity, the more relevant it is to<br />
affect it).<br />
We found that, at least in our numerical model, the relative performance <strong>of</strong> the various game<br />
regimes is rather close for a variety <strong>of</strong> parameter ranges. More precisely, there are two<br />
clusters <strong>of</strong> equilibria: one cluster in which the region leads in the price stage, and one cluster<br />
that encompasses all other game equilibria. This suggests that the main issue is not which<br />
exact type <strong>of</strong> game is played between the two actors, but much more whether there is<br />
cooperation (leading to first-best) or competition between governments, where <strong>of</strong> secondary<br />
importance is the question who is leading in the price stage (if there is a leader). Leadership in<br />
the capacity stage is nearly without consequences in our numerical model.<br />
<strong>The</strong> performance for most game situations improves when demand becomes more elastic. <strong>The</strong><br />
city then has less incentive to exploit its market power. <strong>The</strong> relative importance <strong>of</strong> the<br />
socially-inefficient motive for tolling (revenue extraction from regional drivers by the city)<br />
decreases compared with the socially-efficient motive (congestion internalisation). Only the<br />
“second-best region”, where the city’s toll is fixed at zero, does not suffer from the increased<br />
inefficiency when demand becomes more inelastic. <strong>The</strong> similarities between the different<br />
groups are robust and do not depend on the assumed demand elasticity. When the price <strong>of</strong><br />
<strong>road</strong> investment changes, the performance relative to the optimal situation remains more or<br />
less equal for all cases.<br />
Although it may seem attractive to national governments to deregulate and give powers to<br />
lower levels <strong>of</strong> government since they know local situations best, the outcomes <strong>of</strong> interaction<br />
may not always be promising. In our example, compared to the selected unpriced benchmark<br />
equilibrium, overall welfare is not helped very much, and in some cases may even decrease.<br />
Toll regulation, although not considered, may seriously be considered as a useful tool to<br />
control one <strong>of</strong> the jurisdictions and improve welfare levels. This is only one among many<br />
issues for further research. Another issue that seems relevant in this context is empirical<br />
research on the welfare <strong>effects</strong> <strong>of</strong> tax competition. This is only a simple illustrative numerical<br />
example, but it remains to be seen whether the costs <strong>of</strong> non-cooperative behaviour are<br />
substantial, in other plausible settings.<br />
149
Appendix 7A<br />
List <strong>of</strong> Symbols<br />
N Total number <strong>of</strong> <strong>road</strong> users<br />
N1 Number <strong>of</strong> <strong>road</strong> users on the city link<br />
N2 Number <strong>of</strong> <strong>road</strong> users on the regional link<br />
NC Number <strong>of</strong> drivers only using the city link<br />
NR1 Number <strong>of</strong> commuters (using both links by going from region to city)<br />
NR2 Number <strong>of</strong> drivers only using the regional link<br />
Dj(Nj) Inverse demand function for group j = {C,R1,R2}<br />
c1 Average social (=marginal private) costs on the city link<br />
c2 Average social (=marginal private) costs on the regional link<br />
cap1 Capacity <strong>of</strong> the city link<br />
cap2 Capacity <strong>of</strong> the regional link<br />
W Total welfare<br />
W1 Welfare <strong>of</strong> city<br />
W2 Welfare <strong>of</strong> region<br />
Bj Benefits for group j = {C,R1,R2}<br />
π1 Pr<strong>of</strong>its for the city<br />
π2 Pr<strong>of</strong>its for the region<br />
pj Generalised price for group j = {C,R1,R2}<br />
t1 Toll on city link<br />
t2 Toll on regional link<br />
pcap Price <strong>of</strong> one unit <strong>road</strong> capacity<br />
ki Average free-flow user cost on route i (ki > 0)<br />
bi constant<br />
ω Index <strong>of</strong> relative welfare improvement<br />
aj Absolute value <strong>of</strong> the slope <strong>of</strong> the demand curve for group j = {C,R1,R2}<br />
(aj > 0)<br />
dj<br />
Intersection <strong>of</strong> the demand curve with the vertical axis for group j = {C,R1,R2}<br />
(dj > 0)<br />
150
Appendix 7B<br />
Derivation <strong>of</strong> first-order conditions for toll and capacity<br />
for the first-best situation and two second-best situations<br />
This appendix derives analytical expressions for toll rules and investment rules for three<br />
cases: first-best (Section B.2.1), for the city when taking the regional toll and capacity as<br />
given (in Section B.2.2), and for the region when taking the city’s toll and capacity as given<br />
(in Section B.2.3).<br />
B.2.1 First-best situation<br />
<strong>The</strong> first-best toll and capacity can be found by solving the following Lagrangian:<br />
L<br />
−<br />
NC<br />
N R1<br />
N R 2<br />
= ∫ DC<br />
( n)<br />
dn + ∫ DR1<br />
( n)<br />
dn + ∫<br />
0<br />
0<br />
0<br />
( cap + cap ) * p + λ ( p − D ) + λ ( p − D ) + λ ( p − D )<br />
1<br />
2<br />
cap<br />
C<br />
C<br />
D<br />
C<br />
R2<br />
( n)<br />
dn − N<br />
R1<br />
R1<br />
C<br />
* c<br />
We determine the first-order conditions with respect<br />
N C , N R , N R , cap , cap , t , t , C , λR<br />
λ R :<br />
to 1 2 1 2 1 2 λ 1and<br />
2<br />
∂L<br />
∂N<br />
C<br />
∂L<br />
∂N<br />
R1<br />
= D<br />
C<br />
= D<br />
⎛ ∂c<br />
+ λ 1 ⎜ R<br />
⎝ ∂N<br />
∂L<br />
∂N<br />
R2<br />
R1<br />
1<br />
R1<br />
= D<br />
1<br />
R1<br />
− N<br />
R1<br />
R2<br />
* ( c<br />
1<br />
R2<br />
+ c ) − N<br />
2<br />
R2<br />
R2<br />
* c<br />
2<br />
(A1)<br />
∂c1<br />
− c1<br />
− ( N C + N R1)<br />
∂N<br />
C<br />
⎛ ∂c1<br />
+ λ ⎜ C<br />
⎝ ∂N<br />
C<br />
∂DC<br />
⎞ ∂c1<br />
−<br />
⎟ + λR1<br />
∂N<br />
C ⎠ ∂N<br />
C<br />
= 0<br />
(A2a)<br />
∂c1<br />
∂c2<br />
∂c1<br />
− ( c1<br />
+ c2<br />
) − ( N R1<br />
+ N C ) − ( N R1<br />
+ N R2<br />
) + λC<br />
∂N<br />
R1<br />
∂N<br />
R1<br />
∂N<br />
R1<br />
∂c2<br />
∂DR1<br />
⎞ ∂c2<br />
+ − ⎟ + λR<br />
2 = 0<br />
∂N<br />
R1<br />
∂N<br />
R1<br />
⎠ ∂N<br />
R1<br />
(A2b)<br />
R2<br />
− c<br />
2<br />
− ( N<br />
R1<br />
+ N<br />
R2<br />
∂c<br />
)<br />
∂N<br />
2<br />
R2<br />
⎛ ∂c2<br />
∂DR<br />
2 ⎞ ∂c2<br />
+ λ 2 ⎜<br />
⎟<br />
R − + λR1<br />
= 0 (A2c)<br />
⎝ ∂N<br />
R2<br />
∂N<br />
R2<br />
⎠ ∂N<br />
R2<br />
∂L<br />
= λ c + λR1<br />
∂t1<br />
= 0<br />
(A2d)<br />
∂L<br />
= λ R1<br />
+ λR<br />
2<br />
∂t<br />
= 0<br />
(A2e)<br />
2<br />
∂L<br />
∂cap<br />
1<br />
∂L<br />
∂cap<br />
2<br />
= −N<br />
= −N<br />
C<br />
R2<br />
∂c1<br />
∂cap<br />
1<br />
∂c2<br />
∂cap<br />
∂L<br />
= c1<br />
+ t1<br />
− D<br />
∂λ<br />
C<br />
C<br />
− N<br />
2<br />
= 0<br />
R1<br />
− N<br />
∂c1<br />
∂cap<br />
R1<br />
1<br />
∂c2<br />
∂cap<br />
− p<br />
2<br />
cap<br />
− p<br />
∂c1<br />
∂c1<br />
+ λ C + λR1<br />
= 0<br />
(A2f)<br />
∂cap<br />
∂cap<br />
cap<br />
1<br />
1<br />
∂c2<br />
∂c2<br />
+ λ R2<br />
+ λR1<br />
= 0 (A2g)<br />
∂cap<br />
∂cap<br />
2<br />
2<br />
(A2h)<br />
151
∂L<br />
∂λ<br />
R1<br />
∂L<br />
∂λ<br />
R2<br />
= c<br />
1<br />
= c<br />
2<br />
+ t<br />
1<br />
+ t<br />
+ c<br />
2<br />
2<br />
− D<br />
+ t<br />
R2<br />
2<br />
− D<br />
= 0<br />
We can eliminate the<br />
∂c<br />
∂N<br />
N2=NR1 + NR2. This leaves:<br />
t<br />
∂c1<br />
= N1<br />
∂N<br />
∂DC<br />
+ λC<br />
∂N<br />
R1<br />
= 0<br />
(A2i)<br />
(A2j)<br />
λ terms in (A2a)-(A2c). Defining link-flows N1=NC + NR1, and<br />
1 (A3a)<br />
1<br />
C<br />
t<br />
∂c<br />
∂c<br />
∂D<br />
1<br />
2<br />
R1<br />
1 + t2<br />
= N1<br />
+ N 2 + λ R1 (A3b)<br />
∂N1<br />
∂N<br />
2 ∂N<br />
R1<br />
t<br />
∂c<br />
∂D<br />
2<br />
R2<br />
2 = N 2 + λ R2 (A3c)<br />
∂N<br />
2 ∂N<br />
R2<br />
∂DC<br />
∂DR<br />
2 ∂DR1<br />
⇒ λ C + λR<br />
2 − λR1<br />
= 0<br />
(A3d)<br />
∂N<br />
∂N<br />
∂N<br />
C<br />
R2<br />
R1<br />
Since we had (A2d) and (A2e), we find that λ λ = λ = 0 .<br />
C = R1<br />
R2<br />
This gives us the following first-best conditions for the optimal tolls:<br />
t<br />
∂c<br />
1<br />
1 = N1<br />
(A4a)<br />
∂N1<br />
t<br />
∂c<br />
2<br />
2 = N 2<br />
(A4b)<br />
∂N<br />
2<br />
Both optimal tolls equal marginal external (congestion) costs on both links, as expected.<br />
<strong>The</strong> first order conditions for capacity are as follows (substituting A2d) and (A2e) in (A2f)<br />
and (A2g)):<br />
∂c<br />
− N =<br />
1<br />
1 pcap<br />
(A4c)<br />
∂cap1<br />
∂c<br />
− N =<br />
2<br />
2 pcap<br />
(A4d)<br />
∂cap2<br />
<strong>The</strong>se are again familiar first-best results, equating marginal cost <strong>of</strong> capacity expansion to<br />
∂c<br />
∂c<br />
marginal benefits on both routes. Because N = −cap<br />
, exact self-financing with tax<br />
∂N<br />
∂cap<br />
rules (A4a and A4b) and investment rules (A4c and A4d) is easily established, confirming<br />
applicability <strong>of</strong> the conventional Mohring-Harwitz result.<br />
152
B.2.2 Second-best: city optimises<br />
<strong>The</strong> appropriate Lagrangian now reads as follows:<br />
NC<br />
L = ∫ D<br />
+ λ<br />
0<br />
R2<br />
C<br />
( p − D )<br />
R2<br />
( n)<br />
dn − N<br />
R2<br />
C<br />
* c<br />
1<br />
+ N<br />
R1<br />
* t<br />
1<br />
− cap * p<br />
1<br />
cap<br />
+ λ<br />
C<br />
( p − D ) + λ ( p − D )<br />
C<br />
C<br />
R1<br />
R1<br />
R1<br />
(A5a)<br />
We determine the first-order conditions with respect to N C , N R1<br />
, N R2<br />
, cap1,<br />
t1,<br />
λ C , λR1<br />
and<br />
λ R2<br />
:<br />
∂L<br />
∂N<br />
C<br />
∂L<br />
∂N<br />
R1<br />
∂L<br />
∂N<br />
1<br />
R2<br />
= D<br />
∂L<br />
= N<br />
∂t<br />
∂L<br />
∂cap<br />
1<br />
C<br />
= −N<br />
− c<br />
C<br />
1<br />
∂c<br />
∂N<br />
− N<br />
1<br />
R1<br />
C<br />
+ t<br />
∂c<br />
∂N<br />
1<br />
1<br />
C<br />
⎛ ∂c1<br />
∂DC<br />
⎞ ∂c1<br />
+ λ ⎜<br />
⎟<br />
C − + λR1<br />
= 0<br />
(A5b)<br />
⎝ ∂N<br />
C ∂N<br />
C ⎠ ∂N<br />
C<br />
∂c1<br />
⎛ ∂c1<br />
∂c2<br />
∂DR1<br />
⎞ ∂c2<br />
+ λ 1 ⎜<br />
⎟<br />
C + λR<br />
+ − + λR<br />
2 = 0 (A5c)<br />
∂N<br />
R1<br />
⎝ ∂N<br />
R1<br />
∂N<br />
R1<br />
∂N<br />
R1<br />
⎠ ∂N<br />
R1<br />
⎛ ∂c2<br />
∂DR<br />
2 ⎞ ∂c2<br />
= λ 2 ⎜<br />
⎟<br />
R − + λR1<br />
= 0<br />
(A5d)<br />
⎝ ∂N<br />
R2<br />
∂N<br />
R2<br />
⎠ ∂N<br />
R2<br />
R1<br />
= −N<br />
+ λ + λ = 0<br />
(A5e)<br />
C<br />
c<br />
R1<br />
∂c1<br />
∂cap<br />
∂L<br />
= c1<br />
+ t1<br />
− D<br />
∂λ<br />
C<br />
∂L<br />
∂λ<br />
R1<br />
∂L<br />
∂λ<br />
R2<br />
= c<br />
1<br />
= c<br />
2<br />
+ t<br />
1<br />
+ t<br />
+ c<br />
2<br />
C<br />
2<br />
− D<br />
1<br />
− p<br />
= 0<br />
+ t<br />
R2<br />
2<br />
cap<br />
− D<br />
= 0<br />
∂c1<br />
+ ( λ C + λR1<br />
) = 0<br />
(A5f)<br />
∂cap<br />
R1<br />
= 0<br />
1<br />
(A5g)<br />
(A5h)<br />
(A5i)<br />
<strong>The</strong> first-order condition for capacity can relatively easy be derived by substituting (A5e) in<br />
(A5f):<br />
∂c1<br />
− ( N C + N R1)<br />
= pcap<br />
(A6a)<br />
∂cap1<br />
This is equal to the first-best rule for capacity.<br />
<strong>The</strong> derivation <strong>of</strong> the first-best expression for the toll set by the city is more tedious.<br />
<strong>The</strong>refore, we only present the resulting expression:<br />
153
∂D<br />
⎛<br />
⎞<br />
C ∂D<br />
⎜ R1<br />
∂DR<br />
2 ∂c2<br />
⎛ ∂DR1<br />
∂DR<br />
2 ⎞<br />
⎟<br />
⎜<br />
− * + * ⎜ + ⎟<br />
⎟<br />
N R1<br />
∂c<br />
∂N<br />
⎝ ∂ ∂ ∂ ⎝ ∂ ∂<br />
1 C N R1<br />
N R2<br />
N 2 N R1<br />
N R2<br />
⎠<br />
t = +<br />
⎠<br />
1 N1<br />
(A6b)<br />
∂N1<br />
⎛ ∂DC<br />
∂DR1<br />
⎞ ∂DR<br />
2 ∂c2<br />
⎛ ∂DC<br />
∂DR1<br />
∂DR<br />
2 ⎞<br />
⎜ +<br />
⎟ −<br />
⎜ + +<br />
⎟<br />
⎝ ∂N<br />
C ∂N<br />
R1<br />
⎠ ∂N<br />
R2<br />
∂N<br />
2 ⎝ ∂N<br />
C ∂N<br />
R1<br />
∂N<br />
R2<br />
⎠<br />
<strong>The</strong> first term repeats the first-best expression and is equal to the marginal external congestion<br />
cost. But the city will raise the toll beyond this level. <strong>The</strong> term is the result <strong>of</strong> the city<br />
government compromising between two toll rules: the marginal external costs, which would<br />
be optimal for the own citizens when driving in isolation; and the marginal external costs plus<br />
a demand-related monopolistic mark-up, which would be optimal if only regional drivers used<br />
the city’s infrastructure. <strong>The</strong> second term in (A6b) is so complex because the demand by<br />
group R1 depends, in part, also on cost and demand elasticity in the region. <strong>The</strong> second term is<br />
namely positive (as long as demands are downward sloping).<br />
B.2.3 Second-best; region optimises<br />
<strong>The</strong> appropriate Lagrangian now reads as follows:<br />
L<br />
N R1<br />
N R<br />
= ∫ DR1(<br />
n)<br />
dn + ∫<br />
0<br />
0<br />
− cap<br />
2<br />
* p<br />
cap<br />
+ λ<br />
C<br />
2<br />
D<br />
R2<br />
( n)<br />
dn − N<br />
( p − D ) + λ ( p − D ) + λ ( p − D )<br />
C<br />
C<br />
R1<br />
R1<br />
* c<br />
R1<br />
1<br />
− N<br />
R1<br />
R1<br />
* c<br />
2<br />
R2<br />
− N<br />
R2<br />
R2<br />
* c<br />
2<br />
R2<br />
− N<br />
R1<br />
* t<br />
1<br />
(A7a)<br />
We determine the first-order conditions with respect to N C , N R1<br />
, N R2<br />
, cap2<br />
, t2<br />
, λ C , λR1<br />
and<br />
λ R2<br />
:<br />
∂L<br />
∂N<br />
C<br />
∂L<br />
∂N<br />
R1<br />
= −N<br />
= D<br />
⎛ ∂c<br />
+ λ 1 ⎜ R<br />
⎝ ∂N<br />
∂L<br />
∂N<br />
2<br />
R2<br />
1<br />
R1<br />
= D<br />
R1<br />
R1<br />
R2<br />
∂c<br />
∂N<br />
− c<br />
1<br />
1<br />
C<br />
∂c<br />
+<br />
∂N<br />
− c<br />
2<br />
⎛ ∂c1<br />
∂DC<br />
⎞ ∂c1<br />
+ λ ⎜<br />
⎟<br />
C − + λR1<br />
= 0<br />
(A7b)<br />
⎝ ∂N<br />
C ∂N<br />
C ⎠ ∂N<br />
C<br />
− N<br />
2<br />
R1<br />
R1<br />
∂c<br />
∂N<br />
∂D<br />
−<br />
∂N<br />
− ( N<br />
R1<br />
1<br />
R1<br />
R1<br />
R1<br />
+ N<br />
− c<br />
2<br />
⎞<br />
⎟ + λ<br />
⎠<br />
R2<br />
− ( N<br />
R2<br />
∂c<br />
)<br />
∂N<br />
∂c<br />
∂N<br />
2<br />
R2<br />
R1<br />
2<br />
R1<br />
+ N<br />
= 0<br />
R2<br />
∂c<br />
)<br />
∂N<br />
2<br />
R1<br />
− t<br />
1<br />
∂c<br />
+ λC<br />
∂N<br />
1<br />
R1<br />
(A7c)<br />
⎛ ∂c2<br />
∂DR<br />
2 ⎞ ∂c2<br />
+ λ 2 ⎜<br />
⎟<br />
R − + λR1<br />
= 0 (A7d)<br />
⎝ ∂N<br />
R2<br />
∂N<br />
R2<br />
⎠ ∂N<br />
R2<br />
∂L<br />
= λ R2<br />
+ λR1<br />
= 0<br />
(A7e)<br />
∂t<br />
∂L<br />
∂cap<br />
2<br />
= −(<br />
N<br />
R1<br />
+ N<br />
∂L<br />
= c1<br />
+ t1<br />
− D<br />
∂λ<br />
C<br />
C<br />
R2<br />
= 0<br />
∂c2<br />
)<br />
∂cap<br />
2<br />
− p<br />
cap<br />
∂c2<br />
+ ( λ R1<br />
+ λR<br />
2 ) = 0<br />
(A7f)<br />
∂cap<br />
2<br />
(A7g)<br />
154
∂L<br />
∂λ<br />
R1<br />
∂L<br />
∂λ<br />
R2<br />
= c<br />
1<br />
= c<br />
2<br />
+ t<br />
1<br />
+ t<br />
+ c<br />
2<br />
2<br />
− D<br />
+ t<br />
R2<br />
2<br />
− D<br />
= 0<br />
R1<br />
= 0<br />
(A7h)<br />
(A7i)<br />
<strong>The</strong> first order condition for capacity is, again, easy to derive and again equals the first-best<br />
rule for capacity (substituting (A7e) in (A7f)):<br />
∂c2<br />
− N 2 =<br />
∂cap<br />
2<br />
pcap<br />
<strong>The</strong> derivation <strong>of</strong> the first-best expression for the toll set by the region is more tedious.<br />
<strong>The</strong>refore, we only present the resulting expression:<br />
t<br />
2<br />
= N<br />
2<br />
∂c<br />
∂N<br />
2<br />
R1<br />
+<br />
∂D<br />
−<br />
∂N<br />
C<br />
C<br />
⎛ ∂D<br />
⎜<br />
⎝ ∂N<br />
R1<br />
R1<br />
∂c1<br />
∂DC<br />
∂DR<br />
2<br />
− N R1<br />
* * *<br />
∂N1<br />
∂N<br />
C ∂N<br />
R2<br />
∂D<br />
⎞ ∂ ⎛<br />
R2<br />
c1<br />
∂DC<br />
∂D<br />
+ ⎟ +<br />
⎜ +<br />
∂N<br />
R2<br />
⎠ ∂N1<br />
⎝ ∂N<br />
C ∂N<br />
R1<br />
R1<br />
∂D<br />
+<br />
∂N<br />
<strong>The</strong> first term is again equal to the marginal external congestion costs on the tolled <strong>road</strong>. <strong>The</strong><br />
second term is positive. It reflects the region’s attempt to also internalise the congestion<br />
externality that regional commuters impose upon one another on the city’s <strong>road</strong>, link 1, as<br />
given by the first two terms in the numerator. <strong>The</strong> correction term captures substitution <strong>effects</strong><br />
that will make this attempt less effective than it would be if link 1 was used by regional<br />
drivers alone.<br />
R2<br />
R2<br />
⎞<br />
⎟<br />
⎠<br />
155
Appendix 7C<br />
Numerical results<br />
<strong>The</strong> following table presents the numerical results for various scenarios relative to the firstbest<br />
outcomes.<br />
Scenario NC NR1 NR2 cap1 cap2 W WC WR t1 t2 ω<br />
First-best 179 358 179 1697 1697 57621 9603 48018 6.32 6.32 1<br />
Base equilibrium 0.93 0.93 0.93 0.29 0.29 0.83 0.76 0.85 0 0 -<br />
City<br />
optimises<br />
Region<br />
0.33 0.65 0.97 0.54 0.29 0.80 2.29 0.50 12.36 0 -0.19<br />
optimises 0.93 0.94 0.94 0.29 0.94 0.91 0.76 0.94 0 1.96 0.48<br />
Full Nash 0.34 0.65 0.96 0.57 0.64 0.85 2.28 0.56 12.18 1.55 0.07<br />
Nash prices,<br />
Stackelberg<br />
capacities<br />
0.34 0.65 0.96 0.57 0.64 0.84 2.28 0.56 12.18 1.53 0.07<br />
Stackelberg<br />
prices, Nash<br />
capacities<br />
0.33 0.65 0.96 0.57 0.65 0.84 2.28 0.55 12.34 1.52 0.05<br />
Full<br />
Stackelberg<br />
0.33 0.65 0.96 0.57 0.65 0.84 2.28 0.55 12.32 1.52 0.06<br />
Nash prices,<br />
Stackelberg<br />
capacities<br />
0.34 0.65 0.96 0.57 0.65 0.85 2.28 0.56 12.18 1.53 0.07<br />
Stackelberg<br />
prices, Nash<br />
capacities<br />
0.41 0.58 0.75 0.52 0.66 0.81 2.03 0.57 11.04 5.19 -0.11<br />
Full<br />
Stackelberg<br />
0.41 0.58 0.75 0.52 0.67 0.82 2.03 0.57 11.04 5.19 -0.11<br />
Second<br />
-best<br />
City leader<br />
Region leader<br />
156
Part III: Acceptability <strong>of</strong> transport <strong>pricing</strong><br />
157
Chapter 8<br />
Acceptance <strong>of</strong> <strong>road</strong> <strong>pricing</strong> and revenue use<br />
8.1 Introduction<br />
Road transport is known to generate considerable external costs, in particular in the form <strong>of</strong><br />
congestion, noise and emissions <strong>of</strong> pollutants. Economists have <strong>of</strong>ten advocated that these<br />
costs should be properly reflected in prices, otherwise over-consumption <strong>of</strong> <strong>road</strong> transport<br />
will generally result. Chapter 2 has shown that, according to standard welfare economic<br />
theory, prices should equate marginal social cost throughout the economy to obtain maximum<br />
efficiency. However, other (second-best) <strong>pricing</strong> measures may also lead to considerable<br />
welfare benefits. For example, applied congestion <strong>pricing</strong> schemes may not fully reflect all<br />
social costs <strong>of</strong> the trips involved, but may lead to considerable congestion reductions and<br />
overall welfare gains to society. Traditional forms <strong>of</strong> <strong>pricing</strong> policies in <strong>road</strong> transport, such<br />
as vehicle taxes, will <strong>of</strong>ten be too crude to achieve anything near the welfare gains that a more<br />
targeted and refined system <strong>of</strong> <strong>road</strong> <strong>pricing</strong> would yield.<br />
Despite the transport economists’ preference for more refined <strong>road</strong> <strong>pricing</strong>, it is only rarely<br />
implemented in practice. Apparently, the implementation <strong>of</strong> congestion <strong>pricing</strong> (let alone<br />
marginal cost-based <strong>pricing</strong>) is not as straightforward as it may seem after calculating the<br />
welfare gains. Indeed, significant barriers can be identified that may prevent a smooth and<br />
easy implementation <strong>of</strong> <strong>pricing</strong> policing. As a result, all sorts <strong>of</strong> constraints can be identified<br />
that prevent a regulator from charging the prices that it ideally would like to set. This chapter<br />
discusses these barriers and pays specific attention to one <strong>of</strong> the most relevant constraints<br />
nowadays: that <strong>of</strong> public acceptance.<br />
Congestion <strong>pricing</strong> schemes have the double consequence <strong>of</strong> discouraging transport use, at<br />
least at certain times on certain parts <strong>of</strong> the network, and <strong>of</strong> transferring cash from private<br />
persons to other (<strong>of</strong>ten public) parties. <strong>The</strong> latter fact is particularly likely to be a major<br />
impediment to its public and hence political acceptability. <strong>The</strong>refore, to render <strong>pricing</strong><br />
schemes politically and publicly acceptable, it is probably required to ‘recycle’ the revenues<br />
generated, in such a way that most population subgroups are at least equally well <strong>of</strong>f. Such<br />
redistribution schemes appear by no means unfeasible, but in the process <strong>of</strong> redistribution<br />
large parts <strong>of</strong> the initial efficiency gain may in important cases be lost (e.g., if there is a ‘nonzero<br />
shadow price <strong>of</strong> public funds’).<br />
This chapter aims to explain with a literature review why <strong>road</strong> <strong>pricing</strong> <strong>of</strong>ten meets a lot <strong>of</strong><br />
criticism and what the role <strong>of</strong> revenue use might be in this. This provides a useful benchmark<br />
for our empirical work presented in the next chapter. We start from a situation with optimal<br />
<strong>pricing</strong>. This ideal for policy makers gives rise to many barriers (that all play a role in less<br />
unrealistic situations), which will be discussed in Section 8.2. Section 8.3 addresses the<br />
acceptance barrier in more detail; it discusses both public concerns and some practical<br />
implementation experiences. Section 8.4 reports whether revenues from <strong>road</strong> <strong>pricing</strong> may be<br />
used to increase acceptance levels and the possible interaction with efficiency objectives.<br />
Finally, Section 8.5 concludes.<br />
8.2 Barriers to <strong>road</strong> <strong>pricing</strong><br />
Optimal charges should vary in line with variations in marginal external costs caused by<br />
individuals. Since transport externalities include a large variety <strong>of</strong> <strong>effects</strong>, first-best optimal<br />
individual charges may have to vary over many dimensions (see Verhoef, 2000). This would,<br />
in practice, require the use <strong>of</strong> electronic <strong>road</strong> charges, ideally using sophisticated technologies<br />
159
that can monitor actual emissions, place and time <strong>of</strong> driving, driving style and prevailing<br />
traffic conditions. It is clear that there may be various barriers that would hinder the<br />
implementation <strong>of</strong> such first-best <strong>pricing</strong> policies in practice. First-best <strong>pricing</strong> is therefore<br />
mainly used by researchers as a benchmark, to compare the results <strong>of</strong> more realistic secondbest<br />
<strong>pricing</strong> measures with that <strong>of</strong> the optimal situation.<br />
It is one thing to compute first-best prices for a transport model and calculate the resulting<br />
social benefits. But it is quite a different thing to design an efficient <strong>pricing</strong> scheme for a realworld<br />
situation, as required for actual implementation. <strong>The</strong> transport analyst has full control<br />
over his model, whereas a regulator faces all sorts <strong>of</strong> constraints that may prevent him<br />
designing and implementing the desired <strong>pricing</strong> scheme. We will now discuss the most<br />
prevalent barriers to the implementation <strong>of</strong> first-best <strong>pricing</strong>, many <strong>of</strong> which also apply to<br />
<strong>pricing</strong> measures in general (this draws on Verhoef, 2002). We will distinguish three main<br />
categories <strong>of</strong> barriers, indicated in Table 8.1 (adapted from Verhoef, 2003), and some subcategories.<br />
Table 8.1 Classification <strong>of</strong> barriers to transport <strong>pricing</strong><br />
1 Technological and practical barriers<br />
2 Acceptability barriers<br />
2a Public<br />
2b Political (see also below under 3c)<br />
2c Business<br />
3 Institutional barriers<br />
3a Organizational structures<br />
* On the ‘regulator’s side’<br />
* On the ‘regulatees’ side’<br />
3b Political (see also above under 2b)<br />
3c Legal<br />
Adapted from Verhoef (2003)<br />
8.2.1 Technological and practical barriers<br />
As indicated, <strong>road</strong> <strong>pricing</strong> should ideally involve charges that vary continuously over time,<br />
place, route chosen, driving style, type <strong>of</strong> vehicle and its technical state, driving style, etc. But<br />
it is clear that the resulting <strong>pricing</strong> scheme may be too complex to be understood by car<br />
drivers, and may require more sophisticated <strong>pricing</strong> and monitoring technologies than are<br />
currently available. For instance, for realistic <strong>road</strong> <strong>pricing</strong> schemes, one would expect<br />
differentiation over user classes to be possible only for a crude distinction into passenger cars,<br />
vans and trucks; over time up to the level <strong>of</strong> a few time-intervals during the peak and one<br />
level outside it, at a maximum; and tolls to be charged only on a few main <strong>road</strong>s (e.g. main<br />
highways) in the network.<br />
From a recent study in the Netherlands, it appears that the technology for a nation-wide<br />
kilometre charge is, in principle, available (see Ubbels et al., 2002). However, the study<br />
foresaw that it may take some additional time to test the reliability even for a relatively simple<br />
nationwide system that ‘only’ determines the time and location <strong>of</strong> the vehicle. <strong>The</strong><br />
development <strong>of</strong> systems that would vary charges over other aspects, such as driving style and<br />
emissions, would <strong>of</strong> course take longer. It is presumably a good strategy, when starting with a<br />
relatively simple system (allowing only for a crude time and place differentiation), to choose<br />
160
a technology that would, in principle, allow for a future further sophistication <strong>of</strong> price<br />
differentiation.<br />
In some sense, the technological barriers (as sketched above) can be interpreted as ‘financial<br />
barriers’: the required technologies may exist, but to date be too expensive to <strong>of</strong>fer attractive<br />
possibilities.<br />
Other practical barriers that can be distinguished would be insufficient: knowledge on<br />
marginal external cost figures, inadequate transport models and procedures for predicting<br />
equilibrium levels <strong>of</strong> second-best optimal <strong>road</strong> taxes, and so forth. For these reasons, provided<br />
tax levels do not have to be fixed for a long period <strong>of</strong> time, it is to be expected that deviations<br />
between predicted and actual behavioural responses may lead to the adaptation <strong>of</strong> initial tax<br />
levels.<br />
8.2.2 Acceptability barriers<br />
It is b<strong>road</strong>ly believed that probably the greatest barrier to implementation is public, and linked<br />
to this political, acceptability (Jones, 1998). Empirical findings have shown that acceptability<br />
<strong>of</strong> transport <strong>pricing</strong> measures is generally low, and that acceptance is assumed to be one <strong>of</strong> the<br />
major factors influencing effectiveness <strong>of</strong> implementation <strong>of</strong> a system (Schade and Schlag,<br />
2003). <strong>The</strong>se issues will be discussed further in Section 8.3.<br />
In brief, public attitude surveys have identified a wide range <strong>of</strong> concerns about innovative<br />
proposals to charge drivers more directly instead <strong>of</strong> the current taxes on ownership and<br />
purchase <strong>of</strong> cars. For instance, drivers find it difficult to accept that they should pay for<br />
congestion. Furthermore, the public <strong>of</strong>ten thinks that it is not needed, unfair, and not effective.<br />
Also local businesses may be opposed to the implementation <strong>of</strong> (congestion) charging<br />
schemes, mainly motivated by a fear <strong>of</strong> losing patronage. <strong>The</strong>se concerns may lead to the<br />
abandonment <strong>of</strong> schemes. Alternatively, acceptability concerns may create a situation in<br />
which, for instance, a constraint on the maximum level <strong>of</strong> charges is pre-specified.<br />
Finally, there is a clear correspondence between public and political acceptability in a<br />
democracy – where the chances <strong>of</strong> being re-elected depend on the extent to which voters<br />
appreciate the policies implemented. Politicians’ perceptions <strong>of</strong> the public acceptability <strong>of</strong><br />
transport <strong>pricing</strong> schemes – in particular for their specific voter population – may <strong>of</strong> course<br />
affect the position they take in transport <strong>pricing</strong> issues.<br />
8.2.3 Institutional barriers<br />
Various types <strong>of</strong> institutional barriers can be distinguished. One category <strong>of</strong> institutional<br />
barriers arises when the organisation <strong>of</strong> government bodies is such that there is no single<br />
regulator that can set all transport (-related) prices and taxes so as to maximise social welfare<br />
throughout the system. An example is where a local or regional government either cannot<br />
affect some transport charges that are set by a higher level government (e.g. fuel taxes), or has<br />
to accept lower and/or upper limits on charges allowed, set by a higher level government.<br />
Another example, analysed earlier in Chapter 7, is when the government in one jurisdiction<br />
cannot affect the prices charged by a neighbouring jurisdiction, even though trans-boundary<br />
traffic and/or externalities are relatively important. <strong>The</strong> two governments may then end up in<br />
some form <strong>of</strong> tax competition.<br />
Comparable problems may arise when public transport is operated by a private party who is<br />
relatively free in choosing prices and service levels but does so in a socially non-optimal way,<br />
or when private toll <strong>road</strong>s exist in an otherwise publicly controlled <strong>road</strong> network (Chapter 6<br />
analyses price setting in such a setting).<br />
Furthermore, the efficiency <strong>of</strong> transport <strong>pricing</strong> may be maximised only if other government<br />
bodies – for instance, the Ministry <strong>of</strong> Finance – were to adjust taxes (e.g. on labour) and<br />
subsidies (e.g. on commuting cost tax deductions) that are outside the control <strong>of</strong> the transport<br />
161
authority in charge <strong>of</strong> the transport prices – for instance, the Ministry <strong>of</strong> Transport. Indeed,<br />
transport has – arguably more than any other economic activity – direct links with numerous<br />
other economic sectors and markets. This means that the transport regulator typically would<br />
have to take into account that a (change in) transport prices may affect the equilibria on<br />
numerous other markets, many <strong>of</strong> which will be distorted and might thus call for an upward or<br />
downward adjustment <strong>of</strong> these transport prices. Among the most important <strong>of</strong> these other<br />
markets would typically be the labour market, where relatively high marginal tax rates may<br />
lead to a serious undersupply <strong>of</strong> labour, calling for a downward adjustment in transport taxes<br />
if its price effect dominates the labour supply decision, or an upward adjustment if the<br />
revenues are used to lower labour taxes and this revenue effect appears to dominate. Another<br />
example is freight transport for goods that create environmental pollution in their production<br />
process, typically calling for an upward adjustment in transport prices, as this might <strong>of</strong>fer an<br />
indirect way <strong>of</strong> taxing a polluting firm’s output. <strong>The</strong> existence <strong>of</strong> inefficiencies in the various<br />
markets ‘served’ by transport thus create constraints that should be taken seriously in setting<br />
transport prices. Institutional barriers arise when these other taxes – and related policies – are<br />
the domain <strong>of</strong> government bodies other than the transport authority in charge <strong>of</strong> the transport<br />
<strong>pricing</strong> scheme.<br />
In all such cases, institutional barriers may prevent optimal <strong>pricing</strong> from being attainable. But<br />
institutional barriers may also arise on the ‘regulatees’ side’. In particular, the regulatees may<br />
be organised in powerful lobby organisations such as automobile associations, labour unions,<br />
chambers <strong>of</strong> commerce, etc. Moreover, these organisations may join forces in their opposition<br />
against transport <strong>pricing</strong> implementation.<br />
Political barriers were mentioned above as a sub-type <strong>of</strong> acceptability barriers. Of course,<br />
political barriers can also be viewed as a specific type <strong>of</strong> institutional barriers. This underlines<br />
that the distinction between the different types <strong>of</strong> barriers need not always be crystal clear, in<br />
particular when there are interactions between different barriers. In any case, it is not<br />
inconceivable that, in democracies, especially where coalition governments are in <strong>of</strong>fice, the<br />
level <strong>of</strong> charges and the design <strong>of</strong> a <strong>pricing</strong> scheme may become political issues much more<br />
than economic questions. In such cases, deals between political parties that accept the<br />
implementation <strong>of</strong> marginal cost-based <strong>pricing</strong> may create limitations on the types <strong>of</strong> charges<br />
and the flexibility that can be implemented.<br />
Finally legal barriers may be distinguished as a specific type <strong>of</strong> institutional barriers, as it may<br />
not always be possible to charge the ideal prices on the basis <strong>of</strong> legal arguments. For instance,<br />
suppose that the law implies that the level <strong>of</strong> taxes should be predictable to the tax payer. If<br />
congestion is to some extent unpredictable (which it is in reality, e.g. due to weather<br />
conditions or <strong>road</strong> works), the optimal congestion charge would vary too, not only over the<br />
day, but also between days. A legal barrier could then exist that prevents the latter type <strong>of</strong><br />
variation from being implementable.<br />
8.3 Acceptability <strong>of</strong> <strong>road</strong> <strong>pricing</strong><br />
We have seen that the regulator may face different types <strong>of</strong> constraints ranging from practical<br />
(and technical) ones to institutional and acceptability constraints. However, we have now<br />
reached the situation where the major barriers to the successful implementation <strong>of</strong> transport<br />
<strong>pricing</strong> strategies relate largely to lack <strong>of</strong> stakeholder and political acceptability, rather than to<br />
technical or administrative problems. Since raising prices is generally disliked by the<br />
respective user group, the acceptance <strong>of</strong> <strong>pricing</strong> policies is <strong>of</strong>ten low. This section discusses<br />
some general issues appearing in the literature when it comes to acceptance <strong>of</strong> <strong>road</strong> <strong>pricing</strong>.<br />
Moreover, practical experiences <strong>of</strong> three case studies (one <strong>of</strong> which failed) may provide some<br />
useful lessons that can help explain the level <strong>of</strong> acceptance.<br />
162
8.3.1 Acceptability and the implementation <strong>of</strong> <strong>road</strong> <strong>pricing</strong><br />
Several research projects have considered <strong>road</strong> <strong>pricing</strong> measures and policies as promising<br />
attempts to solve urgent traffic problems. Still, many attempts have not yet reached<br />
implementation. <strong>The</strong> lack <strong>of</strong> public acceptability is recognised as one <strong>of</strong> the main obstacles to<br />
the implementation <strong>of</strong> <strong>road</strong> <strong>pricing</strong> (Schade and Schlag, 2003). <strong>The</strong> following reviews<br />
important issues which contribute to the level <strong>of</strong> acceptability.<br />
It is vital for the design <strong>of</strong> any transport <strong>pricing</strong> measure that, in addition to devising a<br />
technically robust system, an understanding <strong>of</strong> the reason for implementation has to be<br />
realised by the public and politicians. Despite the fact that these groups regard traffic<br />
problems in cities as a very important and urgent issue, people may have several concerns<br />
about <strong>road</strong> <strong>pricing</strong>. Besides the views and intentions <strong>of</strong> the persons affected by the measure,<br />
those <strong>of</strong> responsible political agencies as another key group have also to be taken into<br />
account. Politicians may feel that transport problems have to be solved by using some form <strong>of</strong><br />
<strong>pricing</strong> measure. <strong>The</strong>y are <strong>of</strong>ten initiators <strong>of</strong> the measure, which may be adapted to specific<br />
local circumstances. <strong>The</strong>refore, the opinions and the acceptability on the local political level<br />
are <strong>of</strong> great importance for the implementation <strong>of</strong> specific measures. <strong>The</strong> TransPrice project<br />
concludes that the lack <strong>of</strong> political willingness to implement charging measures stems from<br />
the electorate’s perceived low acceptability for such measures (TransPrice, 1999).<br />
Despite the fact that political acceptability is necessary, we will now focus on public concerns<br />
about <strong>pricing</strong> measures. <strong>The</strong> policy maker should consider these before implementing <strong>pricing</strong><br />
measures <strong>of</strong> any kind. <strong>The</strong> concerns <strong>of</strong>ten mentioned include (Jones, 1998):<br />
• It is difficult for drivers to accept the notion that they should pay for congestion, it seems<br />
irrational and inappropriate;<br />
• Car users feel that urban <strong>road</strong> <strong>pricing</strong> is not needed: it is a publicly provided good that is<br />
free at the point <strong>of</strong> use;<br />
• Pricing will not lessen congestion: it is an ineffective measure because drivers will be<br />
inelastic to <strong>road</strong> charges;<br />
• <strong>The</strong> measure will result in unacceptable privacy issues: this issue played an important role<br />
in the discussion on kilometre charging in the Netherlands;<br />
• Road <strong>pricing</strong> will face implementation problems such as unreliable technology and<br />
boundary issues;<br />
• Road <strong>pricing</strong> is considered to be unfair.<br />
In order to address these concerns and to obtain some level <strong>of</strong> acceptability and make a<br />
transport <strong>pricing</strong> measure more likely, policy makers should consider some general rules.<br />
Research, for instance, suggests that the use <strong>of</strong> revenues is important. Verhoef (1996) asked<br />
morning-peak <strong>road</strong> users about their opinion on <strong>road</strong> <strong>pricing</strong>. An overwhelming majority<br />
(83%) stated that his or her opinion depends on the allocation <strong>of</strong> revenues. <strong>The</strong> opinion <strong>of</strong><br />
businesses, on the other hand, seems to depend very much on the perceived effectiveness <strong>of</strong><br />
the measure with regard to time savings. An analysis <strong>of</strong> the economic <strong>effects</strong> <strong>of</strong> <strong>road</strong> <strong>pricing</strong><br />
in the province <strong>of</strong> Utrecht (the Netherlands) indicates that companies are positive as long as<br />
time savings are expected to compensate for <strong>road</strong> <strong>pricing</strong> costs (see PATS, 1999). However,<br />
these businesses do have their doubts as to whether <strong>road</strong> <strong>pricing</strong> would be really effective and<br />
decrease congestion levels.<br />
Taking these research issues into account, a number <strong>of</strong> guidelines to a more successful<br />
implementation can be suggested (CUPID, 2000):<br />
• Pricing strategies should be perceived as very effective solutions. <strong>The</strong> effectiveness <strong>of</strong><br />
<strong>road</strong> <strong>pricing</strong> may be high but this is not guaranteed and depends on the definition <strong>of</strong><br />
objectives. <strong>The</strong>se objectives must be highly valued by the public. Moreover, people must<br />
also believe that their change in behaviour will contribute to reaching these objectives;<br />
163
• Revenues should be clearly hypothecated and alternatives have to be provided. People<br />
want to get something for their money. Jones (1998) even states that <strong>road</strong> <strong>pricing</strong> is not<br />
publicly acceptable unless the money raised is hypothecated for local transport and<br />
environmental projects. Clearly defined objectives and funding targets were needed to<br />
obtain public approval and, hence, implementation;<br />
• Fairness issues have to be considered, the system must be perceived as fair in terms <strong>of</strong><br />
personal benefits and costs. <strong>The</strong> use <strong>of</strong> revenues together with the charging structure is<br />
important to influence the distributional impacts in the desired direction (taking the<br />
vertical and horizontal equity concepts discussed in Chapter 2 into consideration).<br />
Governments could use the revenues to reduce taxation, or they could target particular<br />
disadvantaged groups or locations, as is done in Switzerland (Banister, 1994). However,<br />
the question still remains whether the public can be persuaded that equity concerns have<br />
been accommodated. Guiliano (1993) argues that, no matter how the revenues are<br />
distributed, some individuals may still be worse <strong>of</strong>f, since congestion tolls do not lead to<br />
strict Pareto improvements.<br />
<strong>The</strong>se issues reveal that it is necessary to develop an intelligent communication strategy.<br />
Clearly describing the problem (the presence <strong>of</strong> externalities in the case <strong>of</strong> <strong>road</strong> <strong>pricing</strong>) and<br />
the solutions to this problem, together with the objectives seems appropriate. We will not<br />
enter into this discussion since this is more <strong>of</strong> a psychological type <strong>of</strong> approach to increase<br />
acceptance.<br />
<strong>The</strong> level <strong>of</strong> acceptance may be explained by the type <strong>of</strong> measure; higher charges are<br />
generally less acceptable, and the type <strong>of</strong> revenue use also makes a difference. A stated<br />
preference study in the UK reports that also other design features have impact. Acceptability<br />
increases when the scheme is limited to the central area <strong>of</strong> the city, and using cordon-based<br />
charges rather than continuous charging regimes (Jaensirisak et al., 2005). Other factors, not<br />
directly linked to the measure itself, may also be important. Steg (2003) identifies several<br />
factors that affect the acceptability <strong>of</strong> transport <strong>pricing</strong>. People’s problem awareness, the<br />
attitude towards car driving, mobility-related social norms and the perceived effectiveness <strong>of</strong><br />
the measure are identified as important in explaining the level <strong>of</strong> support. In addition, Rienstra<br />
et al. (1999) find that the acceptance <strong>of</strong> policy measures increases if people are more<br />
convinced about the effectiveness <strong>of</strong> such measures.<br />
Acceptability <strong>of</strong> <strong>road</strong> <strong>pricing</strong> also depends on personal features such as age and income.<br />
Following economic theory, it is to be expected that high income earners may be less opposed<br />
to price measures to reduce congestion than people with lower incomes, because their value<br />
<strong>of</strong> time is higher. Verhoef et al. (1997) do indeed find that income as well as the willingness<br />
to pay for time gains has a significant and positive impact on the opinion on <strong>road</strong> <strong>pricing</strong>.<br />
Other factors, such as the expectation to be compensated, the perception <strong>of</strong> congestion as a<br />
problem and trip length, are also important in explaining the public’s opinion. Jaensirisak et<br />
al. (2005) find that <strong>road</strong> charging is more acceptable to non-users, those who perceived<br />
pollution and congestion to be very serious, those who considered current conditions<br />
unacceptable, and those who judged <strong>road</strong> <strong>pricing</strong> to be effective. Rienstra et al. (1999) have<br />
analysed the support (together with perceived effectiveness and problem perception) for<br />
transport policy measures in general (not in particular for <strong>road</strong> <strong>pricing</strong>). <strong>The</strong>y find that several<br />
personal features and the perceived effectiveness have a significant impact on the<br />
respondent’s support for policy measures in transport. While gender and type <strong>of</strong> household do<br />
not seem to have an impact on support levels for transport measures, these tend to be higher<br />
when the educational level and age becomes higher. Car and driving licence owners support<br />
transport measures significantly less. Of all measures, car drivers have the least support for<br />
164
price measures. <strong>The</strong> authors find no significant impact <strong>of</strong> the level <strong>of</strong> income on the support<br />
for price measures.<br />
8.3.2 Lessons from practical experiences<br />
Road user charges have been used as funding mechanisms in many countries. Well-known<br />
examples include the toll <strong>road</strong>s in France, Italy and Spain, the tolls for bridges and tunnels in<br />
the U.S. and, more recently, the distance related charges for freight vehicles in Switzerland<br />
and Germany. Differentiated <strong>road</strong> <strong>pricing</strong> that aims for congestion reduction has less <strong>of</strong>ten<br />
been implemented. For many years, the only example <strong>of</strong> congestion <strong>pricing</strong> was Singapore.<br />
But today there is more experience to draw from, since other cities have implemented or made<br />
quite detailed plans that have made progress towards political approval.<br />
Below, we discuss acceptance issues by means <strong>of</strong> some practical experiences with different<br />
forms <strong>of</strong> <strong>road</strong> <strong>pricing</strong>. Road <strong>pricing</strong> has for instance been implemented in Oslo, London and<br />
in several locations in the U.S.; and it is interesting to analyse how the acceptance hurdle has<br />
been overcome there. So far Stockholm has been less successful, although implementation is<br />
foreseen depending on the success <strong>of</strong> a recently started trial. We have included the Swedish<br />
case here to see whether public opposition was the bottleneck.<br />
<strong>The</strong> Oslo Toll Ring<br />
Toll cordons have been operated in three Norwegian cities for some time (Bergen, Oslo and<br />
Trondheim). A fourth cordon toll scheme, in the Stavanger-region, went into operation in<br />
April 2001 (Larsen and Østmoe, 2001). Oslo was confronted with unsatisfactory high traffic<br />
flow levels (significant delays) and local environmental problems. For the purpose <strong>of</strong> dealing<br />
with these problems by constructing new infrastructure, authorities decided to seek the<br />
required additional resources from users. <strong>The</strong> toll ring was designed primarily to generate<br />
revenues to finance desired transportation infrastructure improvements (with a minor share<br />
going to public transportation). Congestion management was not among the objectives aimed<br />
at by low and flat tolls. Differentiating the toll rates by time <strong>of</strong> day has been proposed in Oslo,<br />
the only city in Norway where congestion at present will make it worthwhile to use <strong>pricing</strong> as<br />
a measure to affect demand. <strong>The</strong>se proposals have, however, been turned down by politicians<br />
in power.<br />
<strong>The</strong> political process towards implementation was difficult in Oslo. Four years before<br />
implementation, agreement between Oslo City Council and Akershus County Council led to<br />
the approval <strong>of</strong> tolls to finance <strong>road</strong>s and other transport infrastructure. Formal political<br />
approval was obtained two years later, just before the Norwegian Parliament had changed the<br />
law. After this principal political approval, the discussion continued on local issues such as<br />
fairness and the location <strong>of</strong> toll booths (who should pay to enter the city centre?). Moreover,<br />
the spending <strong>of</strong> revenues was an issue because the Labour party demanded more funding for<br />
public transport. In the end, an agreement was reached as a result <strong>of</strong> two different factors<br />
(CUPID, 2000):<br />
• Supporters <strong>of</strong> <strong>road</strong> users were satisfied by the availability <strong>of</strong> new <strong>road</strong> infrastructure,<br />
while those against <strong>road</strong> construction agreed with the reduction in the number <strong>of</strong> cars<br />
entering the city caused by the toll charges;<br />
• <strong>The</strong> warning <strong>of</strong> the national government that investments would possibly be<br />
terminated in case <strong>of</strong> local disagreement. This fear <strong>of</strong> losing national grants made<br />
municipal politicians willing to make a compromise.<br />
Political acceptability took some time, and so did public acceptability. Despite the fact that<br />
tolls already existed in Norway before the opening <strong>of</strong> the Oslo toll ring (tolls on bridges and<br />
tunnels connecting the islands to the mainland were common), the attitude <strong>of</strong> the majority <strong>of</strong><br />
165
the population was negative towards the proposal (around 70%; see Table 8.2). This initial<br />
opposition was also expressed by threats <strong>of</strong> sabotage. However, this picture changed after<br />
opening. When the system had been operative for one year, the opposition reduced to 64%.<br />
<strong>The</strong> proportion supporting the toll system has steadily increased over time; from 30% before<br />
opening to 46% in 1998. Most people now seem to accept the cordons as a fact <strong>of</strong> life, like<br />
parking fees and other restrictive measures, but opposition is still substantial. A contributing<br />
factor to the high initial opposition may have been a belief that the tollgates would be new<br />
bottlenecks in <strong>road</strong> systems (Larsen and Østmoe, 2001). This turned out not to be the case,<br />
and opposition dropped some percentage points.<br />
Table 8.2: Development <strong>of</strong> public attitudes towards the Oslo toll ring (in percentages)<br />
1989 (before tolling) 1990 (after tolling) 1991 1993 1996 1998<br />
Positive attitude 30 36 38 41 45 46<br />
Negative attitude 70 64 62 59 55 54<br />
Source: PROSAM (2000)<br />
In the end, the main explanations for the feasibility <strong>of</strong> this Norwegian example lie in its<br />
simplicity and the political support from the central government. <strong>The</strong> only purpose <strong>of</strong> the<br />
tolling schemes has been to raise money locally for transport projects. Hence, the benefits<br />
(improving infrastructure) were quite obvious both to politicians and the public. <strong>The</strong>se<br />
objectives have been clearly communicated to the public and were easy to understand (wellarticulated<br />
and widely shared). This was facilitated by the already existing experience with<br />
tolling.<br />
London: Congestion charging<br />
London introduced a congestion charging scheme in its central area in 2003. This scheme<br />
requires each vehicle to be charged a fixed amount (₤5, later raised to ₤8) for crossing the<br />
cordon into the city centre. It was part <strong>of</strong> a wider transport strategy which aimed to reduce<br />
traffic congestion and improve car journey time reliability. <strong>The</strong> scheme would also raise<br />
revenue for investment in public transport including an upgrade <strong>of</strong> the underground and<br />
improvement <strong>of</strong> bus services. So far the key findings suggest that the scheme can be<br />
considered successful in terms <strong>of</strong> congestion reduction. After a year, traffic circulating within<br />
the zone had decreased by 15%, and traffic entering the zone by 18%, during charging hours<br />
(TfL, 2004). Of the car driver trips no longer crossing into the charging zone per day, 50 to<br />
60% have switched to public transport, and furthermore changed routes (about 25%) or made<br />
other changes like destination changes or trip timing adjustments.<br />
Several issues have made the issue <strong>of</strong> congestion in London a key political and public<br />
concern. Banister (2003) mentions, among others, that it is accepted that there is no<br />
alternative strategy to addressing congestion apart from demand management. In addition,<br />
there was political support from the national government (providing the enabling legislation)<br />
and a local politician (the Major <strong>of</strong> London). Revenue use was also a public and business<br />
concern. <strong>The</strong>re does seem to be public support for the scheme provided that the revenues are<br />
invested in public transport improvements (with a 51% level <strong>of</strong> support among Londoners in<br />
2001, and 35% against) (Banister, 2003). Tfl (2004) reports that in December 2002 40% <strong>of</strong><br />
the Londoners supports the congestion charging scheme (and 20% is neutral). It is not clear<br />
whether revenue use has been specified in this latter survey. Fact is that support levels have<br />
increased after opening <strong>of</strong> the scheme in February 2003 with 10 to 20% (Tfl, 2004).<br />
Public support through extensive consultation and engagement, and political support (with a<br />
Major committed to congestion charging) have contributed to the successfulness <strong>of</strong><br />
implementation. Other beneficiary factors included the reliable technology, the area for<br />
166
implementation, and an already adequate public transport alternative. <strong>The</strong> importance <strong>of</strong> these<br />
local conditions is confirmed by the failure <strong>of</strong> similar attempts elsewhere in the U.K.<br />
Meanwhile the London scheme is scheduled to expand westward.<br />
Stockholm: <strong>The</strong> Dennis Package<br />
Sweden’s interest in <strong>road</strong> <strong>pricing</strong> has arisen in a different context from Norway’s. Sweden has<br />
little history <strong>of</strong> toll finance <strong>of</strong> <strong>road</strong>s, bridges or tunnels. But it does have a strong<br />
environmental lobby stressing the negative <strong>effects</strong> <strong>of</strong> traffic on sustainability, especially in<br />
inner cities. Political debates have been going on from the late 1980s, about the ability <strong>of</strong> city<br />
centres to accommodate the car, while restraining congestion, pollution and noise. <strong>The</strong><br />
environmental movement demanded a major switch <strong>of</strong> resources from <strong>road</strong>-building to public<br />
transport. To resolve the dispute, in 1990 the government decided to appoint three special<br />
negotiators for Stockholm, Goteborg and Malmo, who were charged with developing a<br />
coordinated approach to urban transport planning, including investment and finance (Farrell,<br />
1999). Stockholm received the most attention, and this led to a programme <strong>of</strong> <strong>road</strong> and public<br />
transport investments which came to be known as the Dennis package (named after the chief<br />
government negotiator). This package (agreed in 1992) had increased accessibility, an<br />
improved environment and better conditions for economic development as its objectives.<br />
Road <strong>pricing</strong> was used to finance the <strong>road</strong> investments and to limit <strong>road</strong> use. Unlike in Oslo,<br />
the toll revenues were not used to fund public transport. Tolling would be implemented on a<br />
ring <strong>road</strong> and a north-south bypass route west <strong>of</strong> the city. <strong>The</strong> toll ring would apply a toll to<br />
inbound traffic only, and would require 28 toll stations (Small and Gomez-Ibanez, 1998). <strong>The</strong><br />
proposed tolls were significantly higher than the Oslo tolls.<br />
Modelling studies suggest that the toll ring would complement the bypass routes’ goal <strong>of</strong><br />
reducing motor vehicle travel in inner Stockholm, and would mitigate the <strong>effects</strong> <strong>of</strong> additional<br />
traffic caused by the construction <strong>of</strong> the new <strong>road</strong>s (Johansson and Mattson, 1994). Despite<br />
these positive results and the endorsement <strong>of</strong> the Dennis agreement by the three main parties,<br />
problems encountered in implementing it led to its collapse in 1997. Although there was<br />
severe public opposition to part <strong>of</strong> the inner-ring construction, the main reasons for the<br />
breakdown <strong>of</strong> the agreement were (OECD, 2001):<br />
• Alternation <strong>of</strong> the parties in power in successive elections, short terms <strong>of</strong> <strong>of</strong>fice (three<br />
years), and the fact that different levels <strong>of</strong> government (national, county and city councils)<br />
all had different priorities;<br />
• Lack <strong>of</strong> consultation with users;<br />
• <strong>The</strong> ‘top down’ agreement between the political parties was on an all or nothing basis,<br />
which did not allow changes or prioritisation <strong>of</strong> objectives or projects.<br />
In addition, the package emphasised projects rather than policies (identified projects were<br />
expected to increase the public transport operating deficit) and it failed to address the issue <strong>of</strong><br />
subsidies. <strong>The</strong>re was an almost complete independence <strong>of</strong> <strong>road</strong> and public transport<br />
components. <strong>The</strong> operating and maintenance costs <strong>of</strong> the <strong>road</strong>s programme would have been<br />
financed from national taxation and tolls, whereas the funding <strong>of</strong> the proposed public<br />
transport projects was unclear (Farrell, 1999).<br />
Local circumstances may have an important impact on the success <strong>of</strong> a scheme. <strong>The</strong>se<br />
circumstances have in this case proved to make the proposed package unacceptable. <strong>The</strong><br />
Dennis package is now seen as a missed opportunity for the development <strong>of</strong> an integrated<br />
urban transport plan. This suggests that the window <strong>of</strong> opportunity may be a narrow one, even<br />
in environmentally-conscious countries, such as Sweden, and confirms the need for a<br />
permanent, financially independent and politically aware organisation to steer such plans<br />
through the implementation phase.<br />
167
Despite opposition against <strong>road</strong> <strong>pricing</strong>, Stockholm recently began a trial in January 2006. All<br />
owners <strong>of</strong> vehicles registered in Sweden are to pay a congestion charge if they drive into or<br />
out <strong>of</strong> the city centre <strong>of</strong> Stockholm on weekdays between 06.30 -18.29. <strong>The</strong> charge varies in<br />
steps over time. Shortly after the end <strong>of</strong> the experiment (July 2006) a referendum about<br />
permanent implementation will be held in the City <strong>of</strong> Stockholm.<br />
Value Pricing in the U.S.: S.R. 91 Express Lanes<br />
As throughout the world, policy makers in the United States have expressed interest in<br />
applying some form <strong>of</strong> marginal cost-based <strong>pricing</strong> to congested <strong>road</strong>s. Before 1989, only<br />
some implementation studies were carried out, which produced favourable findings to support<br />
the concept, but failed largely because <strong>of</strong> local community opposition. But after 1989, new<br />
California legislation (Assembly Bill 680) authorised activities to develop creative <strong>road</strong><br />
<strong>pricing</strong> projects. It was intended to attract private capital to investments in highway projects.<br />
<strong>The</strong> first project implemented under this act is the State Route 91 (SR 91) Express Lanes.<br />
Two lanes were added to the original four lanes in each direction. While the original freeway<br />
lanes remain untolled, users <strong>of</strong> the new express lanes must pay a fee, except for motorcycles<br />
and high-occupancy vehicles (HOVs). <strong>The</strong> SR 91 operating company chose to implement a<br />
variable toll schedule, which was called “Value Pricing” from a marketing point <strong>of</strong> view.<br />
Whereas all other value <strong>pricing</strong> projects in the US are operated by public organisations, a<br />
private company ran the SR 91 project until the beginning <strong>of</strong> 2003 (when the SR 91 franchise<br />
was sold to the public transportation authority <strong>of</strong> Orange County).<br />
Initially, the project met some resistance from people living in Riverside County, who would<br />
have to pay most <strong>of</strong> the tolls, even though it adds new capacity and the original lanes remain<br />
free <strong>of</strong> charge (Small and Gomez-Ibanez, 1998). <strong>The</strong> reason is that it substitutes for an<br />
originally planned single HOV lane in each direction. This objection was partially<br />
ameliorated by the decision to make the lanes free <strong>of</strong> charge for vehicles with three or more<br />
occupants. But, in general, the project received favourable ratings in opinion surveys being<br />
carried out among peak-period travellers during several periods over time. <strong>The</strong> surveys<br />
addressed the public’s opinions about travel conditions, variable toll <strong>pricing</strong>, and the other<br />
innovative technical and institutional features <strong>of</strong> this project (for an overview, see Sullivan,<br />
1998 and 2000).<br />
Commuters in the SR 91 corridor generally approve toll-financed lanes to bypass congestion<br />
(approval percentages in the 60%-80% range), in the first survey conducted just before<br />
opening. <strong>The</strong> approval percentages for toll lane users were 5%-10% higher than for non-users,<br />
with different variation among vehicle occupancy categories. However, approval <strong>of</strong> variable<br />
tolls, which has consistently lagged behind approval <strong>of</strong> toll financing in general, decreased<br />
significantly from its high point <strong>of</strong> 55%-75% in 1996 to the 30%-50% range in 1999. This<br />
approval <strong>of</strong> variable tolls depends very much on the trip characteristics <strong>of</strong> commuters, and not<br />
so much on socio-economic differences. For instance, among single-occupied vehicles, a very<br />
large difference in approval (53% v. 28%) was observed between recent toll lane users and<br />
non-users. <strong>The</strong> idea <strong>of</strong> varying tolls depending on the severity <strong>of</strong> congestion bypassed was not<br />
very popular before the start <strong>of</strong> the project (about 45% <strong>of</strong> the commuters). However, a year<br />
after opening this percentage had increased to the 60%-75% range. In addition, firms in the<br />
area <strong>of</strong> the toll lane were asked for their opinion. Overall, the companies were <strong>of</strong> the opinion<br />
that the new lanes improved the ease and reliability <strong>of</strong> travel, not only for employees but also<br />
for customers, suppliers and the firm’s own work-related travel. For the most part,<br />
respondents to the business survey expressed levels <strong>of</strong> approval for the various features <strong>of</strong> the<br />
toll lanes in the same range as the commuters.<br />
A more general review <strong>of</strong> all value <strong>pricing</strong> projects, which were successfully implemented in<br />
the United States, suggests that such projects <strong>of</strong>ten share several key attributes. Many <strong>of</strong> these<br />
168
are likely to play a role in enlarging the level <strong>of</strong> public acceptability for the following reasons<br />
(Sullivan, 2002):<br />
• Considerable attention was paid to effective advertising and public relations;<br />
• Project advertising and public relations emphasised the benefits to be gained by<br />
travellers, primarily time savings and improved reliability, creating superior travel<br />
options not previously available;<br />
• Benefits were identified to the public in simple, tangible terms, and evidence <strong>of</strong> their<br />
existence was clear after implementation;<br />
• Traveller participation has been optional; if people did not want to use the pay lanes,<br />
they could avoid them.<br />
Communication has been an important tool in creating public acceptance. For instance, at the<br />
national level it was recognised that using the rather academic title <strong>of</strong> ‘congestion <strong>pricing</strong>’<br />
elicited negative emotions. ‘Value <strong>pricing</strong>’ provided a more positive way to identify the same<br />
notion. Another illustration is the positive labels <strong>of</strong> the toll collection technologies such as<br />
Fastrak (Californian projects) and Quickride (Houston). In addition, extensive marketing and<br />
public relations initiatives were conducted.<br />
However, there are also some issues that negatively affect the success <strong>of</strong> a project. <strong>The</strong><br />
experiences point to the presence <strong>of</strong> influential project adversaries (pointing at inequity); the<br />
perception that schemes are only implemented to generate revenues for facilities that are<br />
already paid for; and the concern that the scheme will technically not work or not deliver the<br />
promised benefits.<br />
<strong>The</strong> case study results confirm that a clear communication strategy contributes to a positive<br />
attitude <strong>of</strong> the public. Effective advertising, as used in the United States, is only one example<br />
<strong>of</strong> this. Furthermore, a strong political will with equal priorities among the different<br />
government levels is also beneficial to implementation (e.g. the recent case <strong>of</strong> the London<br />
congestion charge confirms this). Finally, it is found that approval rates change over time. In<br />
fact, opposition rates have decreased due to improved conditions.<br />
8.4 <strong>The</strong> importance <strong>of</strong> revenue use: efficiency and acceptability<br />
Pricing instruments may provide governments with stable and significant revenue sources.<br />
<strong>The</strong> distribution <strong>of</strong> this money is an important consideration in <strong>road</strong> <strong>pricing</strong> programme<br />
development. Revenues may b<strong>road</strong>ly be used in three ways (CUPID, 2000):<br />
• <strong>The</strong>y can remain within the <strong>road</strong> transport sector and therefore benefit those who pay<br />
them as directly as possible (e.g. new <strong>road</strong> infrastructure investments, reduction in<br />
vehicle taxes);<br />
• Revenues could be used to finance other parts <strong>of</strong> the transport sector in a<br />
comprehensive strategy to deal with particular transport problems. Congestion<br />
charging revenues may, for instance, be used to finance a substitute for <strong>road</strong> transport<br />
such as public transport;<br />
• Alternatively, these revenues can be used to fund general public expenses, in which<br />
case there is no hypothecation to the transport sector. This would allow reductions <strong>of</strong><br />
other taxes that are currently used for the public financing <strong>of</strong> infrastructure, but are<br />
largely unrelated to the costs <strong>of</strong> infrastructure use.<br />
<strong>The</strong> destination and distribution <strong>of</strong> the revenues from <strong>pricing</strong> instruments may affect<br />
acceptance levels, but the use <strong>of</strong> revenues may also be important to the overall efficiency <strong>of</strong> a<br />
scheme. This section starts with a review on the welfare implications <strong>of</strong> revenue use. <strong>The</strong>n,<br />
empirical results on the consequences <strong>of</strong> different revenue allocations for acceptance levels<br />
will be discussed.<br />
169
8.4.1 Revenue Use and Economic Efficiency<br />
Economists have long recommended using congestion <strong>pricing</strong> to manage traffic flows more<br />
rationally. <strong>The</strong> attention in these studies has focused on the <strong>effects</strong> and level <strong>of</strong> efficient<br />
charges, and not so much on the spending <strong>of</strong> the revenues. In terms <strong>of</strong> making traffic flow<br />
more efficient by reducing travel demand, it does not matter how revenues are allocated. But<br />
it is possible that the generated revenues are used in a way that decreases the initial obtained<br />
welfare gains, or even cause reductions in welfare overall. Hence, revenue use is important<br />
from a welfare perspective.<br />
For economic efficiency reasons, revenues should be used in a way that does not distort the<br />
transport sector and brings the maximum benefit to society. Economists have <strong>of</strong>ten advocated<br />
that an important candidate for such compensation would be the use <strong>of</strong> <strong>road</strong> <strong>pricing</strong> revenues<br />
to reduce general labour taxes. <strong>The</strong>refore, it could be questioned whether investments in<br />
transport, and <strong>road</strong> transport in particular, are appropriate uses <strong>of</strong> transport tax revenues. This<br />
is in direct contrast with more popular hypothecation schemes where revenues from <strong>road</strong><br />
<strong>pricing</strong> are directly linked to the financing <strong>of</strong> particular transport projects (“visible results”).<br />
Politicians are acutely aware <strong>of</strong> public distrust regarding the introduction <strong>of</strong> new taxes, when<br />
the revenue is used to contribute to the general treasury pot.<br />
Below, we discuss the relation between revenue use and economic efficiency as it appears in<br />
the literature. We may distinguish between three different approaches to the welfare economic<br />
analysis <strong>of</strong> the use <strong>of</strong> <strong>road</strong> toll revenues. First, we look at the link between <strong>pricing</strong> policy and<br />
infrastructure policy. It is <strong>of</strong>ten claimed that the revenues from a congestion tax should be<br />
used to finance investment in <strong>road</strong> infrastructure. This can be very efficient. Economic theory<br />
argues that optimal congestion toll revenues are exactly sufficient to fund optimal <strong>road</strong><br />
capacity under certain conditions. This is a straightforward use <strong>of</strong> toll revenues, but only<br />
applies as a strict equality under certain theoretical conditions. Secondly, <strong>road</strong> <strong>pricing</strong> has<br />
been incorporated in partial equilibrium models. Finally, revenue use can induce important<br />
general equilibrium <strong>effects</strong>, as spending <strong>of</strong> revenues in other sectors may have an important<br />
impact on the overall efficiency <strong>of</strong> a <strong>pricing</strong> measure. <strong>The</strong> results suggest that hypothecation<br />
<strong>of</strong> revenues to public transport, <strong>of</strong>ten advocated from an acceptability perspective (funding the<br />
substitute), may not always be very efficient. Lowering (distortive) taxes in other markets<br />
may, on the other hand, be one <strong>of</strong> the most efficient solutions.<br />
Pricing and cost recovery<br />
Building and maintaining <strong>road</strong> infrastructure entails costs. <strong>The</strong>se costs can be recovered from<br />
the infrastructure users. In many countries, the charges that are currently levied are not<br />
related, or only partly so, to the actual costs <strong>of</strong> providing or using the infrastructure.<br />
Infrastructure costs consist <strong>of</strong> two elements: the capital cost and the operating and<br />
maintenance cost. <strong>The</strong> capital invested in the provision <strong>of</strong> <strong>road</strong> infrastructure gives rise to a<br />
fixed cost, independent <strong>of</strong> the actual use <strong>of</strong> infrastructure. Maintenance expenditures may<br />
vary with traffic volumes, but also other factors such as weather conditions and geographical<br />
settings play an important role.<br />
<strong>The</strong> implementation <strong>of</strong> <strong>pricing</strong> measures raises revenues that may be used to fund<br />
infrastructure costs. Economic theory argues that marginal cost <strong>pricing</strong> is important for the<br />
efficiency <strong>of</strong> the transport system, since it gives individual users an incentive to reduce the<br />
underlying costs, as cost savings are rewarded by lower charges. Ideally, these marginal cost<br />
charges should recover overall infrastructure and <strong>road</strong> use costs. But marginal cost <strong>pricing</strong><br />
certainly does not necessarily mean that given revenue targets will indeed be met exactly<br />
(Verhoef, 2002). If significant parts <strong>of</strong> the total costs are not use-dependent (as is the case<br />
with capital costs), then marginal cost <strong>pricing</strong> alone will generally not lead to full cost<br />
170
ecovery. This may make it very difficult for private investors in <strong>road</strong> infrastructure to set<br />
charges based on marginal costs.<br />
However, economic theory suggests that, under certain circumstances, revenues <strong>of</strong> marginal<br />
cost prices may indeed be exactly sufficient to cover capacity costs, provided certain technical<br />
conditions are fulfilled. This is also known as the self-financing theorem, developed by<br />
Mohring and Harwitz (1962). <strong>The</strong> theorem applies under the following conditions: 1) in<br />
addition to optimal tolling, the capacity <strong>of</strong> the <strong>road</strong> must be chosen optimally; 2) there is<br />
constant returns to scale in <strong>road</strong> construction and maintenance; 3) the trip cost function is<br />
homogenous <strong>of</strong> degree zero in traffic volume and capacity; and 4) <strong>road</strong> capacity can be<br />
increased in small increments (Yang and Meng, 2002).<br />
Constant returns to scale in construction intuitively means that the costs <strong>of</strong> building a <strong>road</strong> is<br />
proportional to capacity. <strong>The</strong> third condition indicates that, when engineering capacity and<br />
traffic flow were doubled, unit travel times would remain the same. <strong>The</strong> congestion toll not<br />
only internalises the external congestion costs, but it also covers the average fixed cost (Hau,<br />
1998). <strong>The</strong> attractiveness <strong>of</strong> this solution lies not only in its optimality (<strong>of</strong> capacity and use <strong>of</strong><br />
the <strong>road</strong>) <strong>of</strong> economic efficiency. It also means that no extra funds (i.e. through distortive<br />
taxes) have to be found elsewhere, and that the schedule is transparent (i.e. only users <strong>of</strong> the<br />
<strong>road</strong> pay for the costs <strong>of</strong> it, but do not pay anything more than the cost <strong>of</strong> supply).<br />
However, this solution very much depends on the conditions mentioned. A balanced transport<br />
budget may still be distorted as soon as these are not fulfilled (e.g. when capacity can only be<br />
supplied in discrete quantities), or when a part <strong>of</strong> the capacity is already fully financed, with<br />
no (interest) costs having to be covered from current toll revenues (Verhoef, 2002). A number<br />
<strong>of</strong> studies have investigated whether self-financing continues to hold under more general<br />
assumptions than those mentioned above. <strong>The</strong> self-financing result <strong>of</strong> homogenous drivers to<br />
heterogenous ones with different values <strong>of</strong> time has been generalised by Mohring (1970) and<br />
Strotz (1964). Henderson (1985) showed that self-financing holds in a case where travellers<br />
have a choice between two modes which could be either driving or using public transport, or<br />
choosing between two <strong>road</strong>s. Later Oum and Zhang (1990) examined the relationship<br />
between congestion tolls and capacity expansion costs for airports when capacity expansion is<br />
indivisible. A more comprehensive review <strong>of</strong> congestion tolls and optimal investment can be<br />
found in Hau (1998).<br />
<strong>The</strong> choice <strong>of</strong> <strong>road</strong> capacity has also been investigated in a second-best setting, where traffic<br />
cannot be adjusted optimally due to institutional constraints prohibiting congestion tolls. A<br />
question then is whether first-best <strong>road</strong> capacity is smaller or larger than the second-best<br />
capacity. Intuition may tell us that capacity may be smaller in the first-best case, since<br />
demand decreases after implementing tolls. However, the literature shows that the opposite<br />
may be correct (MC-ICAM, 2001). It appears that the elasticity <strong>of</strong> demand for <strong>road</strong> trips is the<br />
key element that determines the effect <strong>of</strong> congestion <strong>pricing</strong> on optimal capacity (i.e. in a<br />
situation with a high elasticity the first-best capacity is larger than the second-best capacity,<br />
while, if the elasticity is low, the imposition <strong>of</strong> <strong>road</strong> tolls leads to lower optimal capacity).<br />
Partial Equilibrium<br />
Economic analyses <strong>of</strong> transport <strong>pricing</strong> problems have <strong>of</strong>ten been performed in partial<br />
equilibrium settings. <strong>The</strong> implementation <strong>of</strong> marginal cost prices or congestion <strong>pricing</strong> has<br />
mostly been analysed from a transport sector perspective, by only looking at the welfare gains<br />
<strong>of</strong> the measure itself, taking no account <strong>of</strong> the <strong>effects</strong> <strong>of</strong> the spending <strong>of</strong> revenues. This means<br />
that the wider <strong>effects</strong> <strong>of</strong> the measure on other markets (such as the labour market) have been<br />
neglected in a partial equilibrium framework, simply because these markets have not been<br />
modelled.<br />
171
Partial equilibrium theories show that, when a congestion toll (a Pigouvian tax) internalises<br />
the external costs <strong>of</strong> congestion, peak-hour usage <strong>of</strong> a <strong>road</strong>way falls, and the level <strong>of</strong><br />
congestion declines. <strong>The</strong> revenues are supposed to be collected by the government, but<br />
nothing is said about the spending <strong>of</strong> this money. Of course, in such a partial equilibrium<br />
setting, it is not useful to subsidise other sectors, because it is implicitly assumed that all other<br />
markets are perfectly functioning, without any distortions. <strong>The</strong> revenues may be used to fund<br />
public transport, since marginal cost <strong>pricing</strong> may not be sufficient for this industry to stay in<br />
business.<br />
<strong>The</strong> EU-funded study TRENEN II uses a partial equilibrium model, in which only the<br />
allocation <strong>of</strong> the income <strong>of</strong> consumers over transport goods and one non-transport good is<br />
studied, keeping the level <strong>of</strong> income fixed (Proost and van Dender, 2001). <strong>The</strong>y do, however,<br />
include the spending <strong>of</strong> tax revenues into their modelling work. This study values changes in<br />
tax revenue (including public transport deficits) at the marginal cost <strong>of</strong> public funds minus 1.<br />
<strong>The</strong> marginal cost <strong>of</strong> public funds relates to the efficiency cost <strong>of</strong> taxation and is an important<br />
consideration in the evaluation <strong>of</strong> alternative tax policy options (Ruggeri, 1999). Estimates<br />
vary widely, and they are sensitive to how revenues are collected and spent. Tax revenue in<br />
the TRENEN II study is returned in a lump-sum way to the individual. It is chosen to<br />
incorporate the effect <strong>of</strong> spending transport tax revenues on the labour market, because labour<br />
taxes are the most important type <strong>of</strong> taxes. <strong>The</strong> reasoning is that increased transport tax<br />
revenues may be used to lower taxes on the labour market. When there are important<br />
distortions in this second market, the indirect <strong>effects</strong> may have potentially important welfare<br />
<strong>effects</strong>. <strong>The</strong> TRENEN work shows that when this efficient use <strong>of</strong> tax revenue is guaranteed,<br />
optimal taxes in the transport sector should, in general, be higher than the marginal social<br />
costs (Proost et al., 2001). It is advocated to use tax revenues in two ways from an efficiency<br />
point <strong>of</strong> view: investments in the transport sector (i.e. new <strong>road</strong>s and public transport<br />
infrastructure), and the redistribution <strong>of</strong> income by a reduction <strong>of</strong> labour taxes. This latter<br />
destination compensates all households (in addition to the improved transport quality as a<br />
result <strong>of</strong> higher speeds in peak periods), since it is inefficient to compensate all victims<br />
individually. Note that, for the former possibility, there is no relation between the net revenue<br />
from optimal <strong>pricing</strong> in the transport sector and the need to subsidise public transport.<br />
General equilibrium<br />
A partial equilibrium modelling framework is useful to understand the specific <strong>effects</strong> <strong>of</strong><br />
particular <strong>pricing</strong> measures. Most transportation models explicitly treat the congestion<br />
technology and consumers’ behavioural decisions. <strong>The</strong>se are, however, partial equilibrium<br />
models that do not consider the use <strong>of</strong> tax revenues in distorted economies with income<br />
distribution problems. As we have seen from the TRENEN work, b<strong>road</strong>er <strong>effects</strong> on other<br />
markets can be included by expanding a model in the appropriate directions. A standard<br />
approach, for instance, to capture the interaction with the labour market is to adjust the weight<br />
given to transport tax revenues in the welfare functions used. Obviously, a general<br />
equilibrium approach, where other markets (in that case the labour market) are explicitly<br />
represented, can give a better understanding <strong>of</strong> the overall <strong>effects</strong> <strong>of</strong> transport <strong>pricing</strong><br />
measures, including the use <strong>of</strong> revenues.<br />
Mayeres and Proost (1997 and 2001) discuss optimal transport <strong>pricing</strong> and investment in a<br />
second-best economy, where the government is constrained to use distortionary income taxes<br />
to redistribute income. Mayeres and Proost (1997) use a simplified applied general<br />
equilibrium model, appropriate for studying the interactions between externality taxes and the<br />
rest <strong>of</strong> the tax system. <strong>The</strong>y analyse the introduction <strong>of</strong> congestion taxes in the framework <strong>of</strong><br />
the double dividend discussion. <strong>The</strong> first welfare gain corresponds to the benefit obtained<br />
through an improved externality level, while recycling the tax revenue in a lump-sum way.<br />
172
<strong>The</strong> second dividend results from the optimal use <strong>of</strong> the revenue to reduce existing<br />
distortionary taxes. It is shown that the first dividend is by far the more important, and that the<br />
possibilities <strong>of</strong> obtaining large welfare gains by using externality tax revenues are limited by<br />
the equity objectives. In another study, Mayeres and Proost (2001) use a general equilibrium<br />
model to analyse marginal tax reform in the presence <strong>of</strong> externalities. <strong>The</strong> theoretical model is<br />
illustrated for a specific externality: namely, congestion caused by peak car transport. It is<br />
demonstrated that the net welfare effect <strong>of</strong> an increase in the congestion tax depends on<br />
amongst other things the efficiency effect <strong>of</strong> the tax revenue recycling. A higher tax on peak<br />
car transport increases welfare when the revenues are used to cut taxes on most other<br />
commodities used in the model or to expand <strong>road</strong> capacity (the highest welfare gain). Using<br />
the revenues to increase the subsidy <strong>of</strong> public transport is not interesting, because the welfare<br />
impact <strong>of</strong> the lower congestion level is <strong>of</strong>fset by the high tax revenue cost <strong>of</strong> stimulating the<br />
consumption <strong>of</strong> already strongly subsidised public transport (Mayeres and Proost, 2001).<br />
A recent study <strong>of</strong> Parry and Bento (2001) explores the interactions between taxes on workrelated<br />
traffic congestion and pre-existing distortionary taxes in the labour market. <strong>The</strong>y use a<br />
general equilibrium model to show that, when congestion <strong>pricing</strong> revenues are used to reduce<br />
(distorting) labour taxes, this can raise the overall welfare gain from that <strong>pricing</strong> measure (it<br />
may even double this welfare benefit via a net positive impact on the labour supply). Lumpsum<br />
transfers to households do not appear to be very efficient: these can easily <strong>of</strong>fset the<br />
welfare gain from internalising the congestion externality. Recycling the revenues in public<br />
transport fare subsidies rather than tax cuts appears to be less efficient according to their<br />
analysis. This source <strong>of</strong> inefficiency may even be greater at more substantial amounts <strong>of</strong><br />
traffic reductions.<br />
8.4.2 Revenue use and acceptability<br />
Various studies have empirically addressed the importance <strong>of</strong> revenue recycling for the level<br />
<strong>of</strong> acceptance. <strong>The</strong> results suggest that there is a difference in acceptance levels <strong>of</strong> various<br />
revenue use options, and that the acceptance <strong>of</strong> a certain <strong>pricing</strong> scheme can be influenced by<br />
choosing what to do with the revenues.<br />
Verhoef (1996) asked for the public opinion on a number <strong>of</strong> possible allocations <strong>of</strong> revenue<br />
spending on a five-point scale, varying from a ‘very bad’ allocation <strong>of</strong> revenues to a ‘very<br />
good’ allocation. <strong>The</strong> allocation objectives that are in the direct interest <strong>of</strong> the <strong>road</strong> users<br />
received most support, as may be expected. Road investment, together with lower fuel and<br />
vehicle taxes (variabilisation) received the highest average score. General purposes, such as<br />
general tax reductions and the government budget in general, obtained least support from<br />
morning-peak <strong>road</strong> users.<br />
<strong>The</strong> importance <strong>of</strong> the use <strong>of</strong> the funds in gaining or losing public acceptance for a <strong>pricing</strong><br />
measure has also been demonstrated by a survey in the UK. People were asked about their<br />
attitude to a series <strong>of</strong> measures that would reduce urban traffic problems. When asked about<br />
<strong>road</strong> <strong>pricing</strong> as a stand alone measure, only 30% responded in support <strong>of</strong> charging <strong>road</strong> users<br />
to enter highly congested urban areas (Jones, 1998). <strong>The</strong> respondents were then <strong>of</strong>fered a<br />
package that includes a charge on entering a zone that was then used to fund better public<br />
transport, traffic calming, and better facilities for walking and cycling. This resulted in a 57%<br />
support for the package. A similar result was found in particular for London. A single<br />
measure was supported by 43% <strong>of</strong> the public, whereas 63% accepted the scheme when<br />
revenues were used for purposes approved by respondents. Hypothecating revenues increases<br />
public support.<br />
<strong>The</strong> AFFORD study conducted an empirical survey on the public acceptability <strong>of</strong> different<br />
<strong>pricing</strong> strategies in four European cities: Athens, Como, Dresden and Oslo (Schade and<br />
Schlag, 2000). <strong>The</strong>y investigated the attitudes <strong>of</strong> the respondents regarding how to use the<br />
173
evenues arising from <strong>road</strong> <strong>pricing</strong>. It was found that common purposes <strong>of</strong> money use like<br />
traffic flow and public transport improvements are favoured by the vast majority <strong>of</strong><br />
respondents. Lowering vehicle taxes is also supported by the people, whereas lower income<br />
taxes is not acceptable as a revenue spending target. This is the way revenues should be used<br />
according to the public. <strong>The</strong> expectations concerning how revenues actually will be used are<br />
rather different, however. Around 70% <strong>of</strong> the respondents expect that the money will be used<br />
for state or municipal purposes, which are not wanted by the public (Schade and Schlag,<br />
2000). This study has also analysed factors that influence the degree <strong>of</strong> acceptability <strong>of</strong><br />
<strong>pricing</strong> measures. In particular, variables such as ‘social norm’, ‘perceived effectiveness’ and<br />
‘approval <strong>of</strong> societal important aims’ are positively connected with the acceptability <strong>of</strong><br />
<strong>pricing</strong> strategies (Schade and Schlag, 2003).<br />
An interesting study by Small (1992) suggests that public and political support can be reached<br />
for <strong>road</strong> <strong>pricing</strong>, even without using all the revenues to compensate travellers, since higher<br />
user charges are accompanied by reduced travel times. He searched for a strategy whereby<br />
nearly everyone affected will find at least some <strong>of</strong>fsetting benefits, and a majority will<br />
perceive the entire package as an improvement. Seven interest groups were distinguished,<br />
ranging from the travelling public and public transport users to low tax advocates. It was<br />
suggested that money should be kept in the transportation sector. Funds should be allocated<br />
about equally between monetary subsidies to travellers, substitutions <strong>of</strong> general taxes that are<br />
currently used to pay for transportation services, and new transportation services. Small<br />
illustrates this by designing a politically feasible (in terms <strong>of</strong> support from the earlier<br />
identified interest groups) congestion <strong>pricing</strong> package for Southern California (summarised in<br />
Table 8.3). His equity analysis indicates that this programme makes every class <strong>of</strong> traveller<br />
better <strong>of</strong>f (combination <strong>of</strong> travel time saved, financial improvements and transportation<br />
improvement), with the greatest gains for higher income drivers and public transport users.<br />
Table 8.3: Proposed congestion <strong>pricing</strong> revenue use for Southern California<br />
Revenue use Funding<br />
Employee commuting allowance 25%<br />
Fuel tax reduction<br />
12%<br />
Sales tax reduction<br />
18%<br />
Property tax rebate<br />
16%<br />
Highway improvements<br />
11%<br />
Public transport improvement<br />
10%<br />
Business center transportation facilities<br />
Source: Small, 1992<br />
11%<br />
It would appear from the literature that using the revenue raised from <strong>pricing</strong> measures to<br />
fund alternative transport objectives, possibly in the form <strong>of</strong> an integrated package <strong>of</strong><br />
measures may increase acceptability. However, the design <strong>of</strong> the integrated package, i.e.<br />
which measures are included and which are left out, will very much depend on local<br />
circumstances. This is confirmed by the experiences with <strong>road</strong> <strong>pricing</strong> in Stockholm (see the<br />
Dennis package discussed in Section 8.3.2). <strong>The</strong> idea <strong>of</strong> using revenues raised from <strong>pricing</strong><br />
measures for predetermined purposes calls on the concept <strong>of</strong> earmarking. Earmarking may be<br />
justified to satisfy distributional or acceptability objectives, but it has little relation to<br />
efficiency (which is generally served best in the absence <strong>of</strong> restrictions on the use <strong>of</strong><br />
government funds). This concept also reduces the flexibility <strong>of</strong> governments to design<br />
efficient general budgets, and therefore treasury departments normally avoid earmarking<br />
(PATS, 1999). On the other hand, public acceptance <strong>of</strong> taxes may increase if they are<br />
earmarked for a connected purpose. Note that hypothecation in the transport sector is not<br />
174
common, but nevertheless sometimes exists: for instance, when the funding <strong>of</strong> public<br />
transport relies on revenues from local taxes and charges (for an overview <strong>of</strong> case studies<br />
world-wide, see Ubbels et al. 2001).<br />
8.5 Conclusions<br />
Most countries rely on existing <strong>pricing</strong> mechanisms such as fuel duties, registration fees and<br />
parking charges. This current charging regime is, however, not very efficient. Economists<br />
have long advocated the use <strong>of</strong> more appropriate <strong>pricing</strong> tools by demonstrating the welfare<br />
gains. Nevertheless, these more efficient <strong>road</strong> <strong>pricing</strong> measures have up till now only seldom<br />
been implemented in practice. <strong>The</strong> low level <strong>of</strong> implementation is due to various barriers.<br />
Barriers may be practical in nature, but also public acceptability and the presence <strong>of</strong> different<br />
institutions with different objectives may prevent a smooth implementation. Nowadays <strong>road</strong><br />
<strong>pricing</strong> faces not so much technical or administrative problems. Rather, it is generally<br />
acknowledged that <strong>pricing</strong> measures meet public resistance: acceptability is currently one <strong>of</strong><br />
the major barriers to successful implementation <strong>of</strong> new and more efficient <strong>pricing</strong> measures.<br />
This chapter has analysed acceptance with specific attention for the role <strong>of</strong> revenue use.<br />
Despite the fact that politicians and the public regard transport problems as urgent and<br />
important, people do have concerns about <strong>road</strong> <strong>pricing</strong>. <strong>The</strong>se doubts are related to the<br />
perceived effectiveness <strong>of</strong> the measure, the feeling that <strong>road</strong>s are free to use, and the fact that<br />
it is an unfair measure. People seem to understand the concept, but are against the imposition<br />
<strong>of</strong> an additional tax, particularly if the revenue raised is paid to the general tax income.<br />
Decision makers should take these concerns into account when preparing the implementation<br />
<strong>of</strong> such a measure. Several guidelines have been proposed in order to come to a more<br />
successful implementation strategy. Besides an intelligent communication campaign<br />
(confirmed by the US experiences), the role <strong>of</strong> revenue spending seems to be important,<br />
especially in relation to the argument <strong>of</strong> fairness. Research has shown the importance <strong>of</strong> the<br />
use <strong>of</strong> funds in gaining or losing public acceptance. Revenues could be targeted to those<br />
persons affected by <strong>road</strong> <strong>pricing</strong> and remain within the transport sector, but also other<br />
objectives may be thought <strong>of</strong> such as new infrastructure or lower income taxes. In general, it<br />
has been found that allocation objectives in the direct interest <strong>of</strong> the <strong>road</strong> users received most<br />
support. Car drivers mainly favour a redistribution in transport (e.g. lower fuel taxes or public<br />
transport investments) and refuse general tax deductions.<br />
Despite the fact that transport is an attractive way <strong>of</strong> spending revenues from an acceptability<br />
perspective, this does not necessarily imply that it is efficient. In contrast, acceptability<br />
objectives may even conflict with economic efficiency goals, so that there is some sort <strong>of</strong> a<br />
trade-<strong>of</strong>f. For instance, the use <strong>of</strong> revenues for public transport funding is debatable from an<br />
efficiency perspective. And an efficient spending target, such as the lowering <strong>of</strong> labour taxes,<br />
is generally disliked by the public. A strategy that is both efficient and acceptable can<br />
therefore be difficult to find for policy makers. Despite the suggested presence <strong>of</strong> this trade<strong>of</strong>f,<br />
the next chapter aims to identify interesting policy directions in terms <strong>of</strong> both<br />
effectiveness and acceptance based on intentions and opinions <strong>of</strong> Dutch car drivers.<br />
175
Chapter 9<br />
What drives acceptance? An explanatory search for<br />
acceptance levels <strong>of</strong> <strong>road</strong> <strong>pricing</strong> among Dutch car<br />
commuters and car owners in general<br />
9.1 Introduction<br />
<strong>The</strong> previous chapter showed that <strong>pricing</strong> measures generally meet public resistance, and that<br />
acceptability is difficult to obtain. This also applies to the Netherlands. <strong>The</strong> Netherlands has a<br />
long experience in developing new <strong>road</strong> <strong>pricing</strong> proposals to reduce the increasing levels <strong>of</strong><br />
congestion (especially in the densely populated Randstad area). Despite the severe traffic<br />
problems, none <strong>of</strong> these plans has ever been implemented mainly because <strong>of</strong> low levels <strong>of</strong><br />
public acceptance. It is therefore interesting to analyse the acceptance <strong>of</strong> specific, policyrelevant,<br />
<strong>pricing</strong> measures. Given the importance <strong>of</strong> revenue use (as we observed in the<br />
previous chapter), we have also included this aspect in our survey. <strong>The</strong> aim is not only to<br />
determine how acceptable a <strong>road</strong> <strong>pricing</strong> measure is; it is even more interesting to explain<br />
variation in acceptance levels for the different types <strong>of</strong> measures.<br />
We have chosen to conduct two empirical studies with different population samples. <strong>The</strong> aim<br />
<strong>of</strong> the first study was to analyse acceptance levels <strong>of</strong> <strong>road</strong> <strong>pricing</strong> measures among those<br />
travellers who regularly experience congestion (i.e. commuters with a car). It is important to<br />
know which factors influence the acceptability <strong>of</strong> <strong>road</strong> <strong>pricing</strong>, especially among these<br />
respondents. Depending on the type <strong>of</strong> measure, this group pays relatively most (because car<br />
commuters generally drive many kilometres) but may also benefit relatively most when<br />
congestion levels decrease. In order to also analyse the acceptance <strong>of</strong> <strong>road</strong> <strong>pricing</strong> among<br />
people driving less frequently, we conducted a second survey and interviewed car owners in<br />
general (not necessarily having a job or driving commuting kilometres).<br />
This chapter reports the empirical findings <strong>of</strong> both surveys, and is organised as follows.<br />
Section 9.2 presents the results from the first survey conducted among commuters. After a<br />
short review <strong>of</strong> similar work, we continue with an explanation <strong>of</strong> the empirical survey, and<br />
present the results from our data analysis. Section 9.3 has a similar set-up, but the sample and<br />
the evaluated <strong>road</strong> <strong>pricing</strong> measures are different. Section 9.4 compares the results from both<br />
surveys, while Section 9.5 presents the main conclusions.<br />
9.2 Acceptability and revenue use: a survey among car commuters<br />
experiencing congestion<br />
<strong>The</strong> previous chapter indicated that public acceptability <strong>of</strong> transport <strong>pricing</strong> measures is<br />
generally low when compared with other types <strong>of</strong> transport measures such as an improvement<br />
<strong>of</strong> public transport (e.g. Bartley, 1995; Jones, 1998). Least accepted are generally all kinds <strong>of</strong><br />
<strong>road</strong> user fees (Schade, 2003). In this first survey we focus on <strong>road</strong> user fees. We report<br />
acceptance levels and search for explanatory variables. Our analysis probably comes closest<br />
to that <strong>of</strong> Rienstra et al. (1999), Verhoef et al. (1997) and Jeansirisak et al. (2005). We also<br />
identify factors that explain the level <strong>of</strong> acceptance <strong>of</strong> <strong>road</strong> <strong>pricing</strong> and revenue use, and<br />
include in the analysis the perceived effectiveness and the value <strong>of</strong> time <strong>of</strong> respondents (only<br />
included in the survey among commuters discussed in this section). This study extends the<br />
work <strong>of</strong> Verhoef et al. by considering multiple variants <strong>of</strong> <strong>pricing</strong> measures, systematically<br />
varied over dimensions such as price levels, differentiation, and revenue use. Moreover, the<br />
individual VOT estimates are now based on a choice experiment (see Chapter 4), while in the<br />
questionnaire <strong>of</strong> Verhoef et al. these were based on open-ended WTP questions. We also<br />
177
include the value <strong>of</strong> schedule delay and uncertainty into the analysis in this section. <strong>The</strong> work<br />
<strong>of</strong> Rienstra analysed the support for transport measures in general, while we focus specifically<br />
on <strong>road</strong> <strong>pricing</strong> measures relevant in the Dutch policy context. <strong>The</strong> Jaensirisak study focuses<br />
on the UK situation where city centre charging may be more (policy) relevant; it does not<br />
include individual parameters such as the value <strong>of</strong> time, and they survey transport users in<br />
general.<br />
9.2.1 Data collection and survey<br />
<strong>The</strong> data used in this section have been obtained by conducting an Internet survey among<br />
Dutch commuters. <strong>The</strong> full questionnaire can roughly be divided into three parts. First, we<br />
asked for some socio-economic characteristics <strong>of</strong> the respondent (such as education and<br />
income). In order to analyse the behavioural responses to <strong>road</strong> <strong>pricing</strong> we developed a stated<br />
choice experiment (discussed in Chapter 4 <strong>of</strong> this thesis), which is the second part <strong>of</strong> the<br />
survey. And, finally, we asked for the opinion <strong>of</strong> the respondents on several carefully<br />
explained <strong>road</strong> <strong>pricing</strong> measures. <strong>The</strong> first and the second part were answered by 1115<br />
respondents, whereas the third part (opinion questions) consisted <strong>of</strong> 564 respondents. This<br />
section presents the outcomes <strong>of</strong> this latter part <strong>of</strong> the survey.<br />
<strong>The</strong> data collection was executed by a specialised firm (NIPO), which has a panel <strong>of</strong> over<br />
50,000 respondents. Since the survey was aimed at respondents who use a car for their home<br />
to work journey and also experience congestion on a regular basis, we selected working<br />
respondents, who drive to work by car two or more times per week, and who experience<br />
congestion <strong>of</strong> 10 or more minutes at least twice a week. This resulted in a total <strong>of</strong> about 6800<br />
possible respondents. An initial analysis revealed that a random sample would result in a<br />
relatively low number <strong>of</strong> women and lower income groups. Because income differences are<br />
important to analyse, it was decided to ‘over sample’ the lower income groups and create an<br />
equal number <strong>of</strong> respondents over the various income classes. <strong>The</strong> data were collected during<br />
three weeks in June 2004 (before the summer holidays).<br />
<strong>The</strong> survey began with some general questions asking for important explanatory variables <strong>of</strong><br />
the respondent. <strong>The</strong>se variables may help explain the differences in acceptance levels. Most<br />
variables are explained in Appendix 9a. Additional variables included in our analysis are not<br />
socio-economic in nature. We have information on the perceived effectiveness <strong>of</strong> the<br />
measures, and have an estimate <strong>of</strong> the value <strong>of</strong> time (VOT) <strong>of</strong> the respondent. It is worthwhile<br />
to analyse the <strong>effects</strong> <strong>of</strong> these variables on acceptance 21 . For a discussion on the pr<strong>of</strong>ile <strong>of</strong> this<br />
sample we refer to Section 4.2.2.<br />
<strong>The</strong> respondent was confronted with three different types <strong>of</strong> <strong>road</strong> <strong>pricing</strong> measures. After a<br />
concise description <strong>of</strong> each measure, the respondents’ opinion on various issues was asked.<br />
People could indicate the acceptability <strong>of</strong> a specific measure on a 7-point scale, ranging from<br />
‘very unacceptable’ to ‘very acceptable’. We also asked how effective they thought that the<br />
measure would be, both individually (i.e. would you drive less?) and in general terms (would<br />
there be less congestion and will there be smaller environmental problems?). <strong>The</strong> answers to<br />
these latter questions (also on a 7-point scale) have been included into the analysis as<br />
explanatory variables for the level <strong>of</strong> acceptance.<br />
21 We do not only have an estimate <strong>of</strong> the VOT <strong>of</strong> the respondent, but also the value <strong>of</strong> schedule delay (early and<br />
late) and the value <strong>of</strong> uncertainty are available. We refer to Chapter 4 for more information on the derivation <strong>of</strong><br />
these values.<br />
178
Table 9.1: Short description <strong>of</strong> the transport <strong>pricing</strong> measures presented to the respondents<br />
Measure Variant<br />
1: Bottleneck passage 1A: flat toll throughout the week<br />
1B: coarse toll (flat within peak hours on working days)<br />
1C: multi-step toll during peak hours only<br />
1D: toll depends on actual traffic conditions<br />
2: Kilometre charge differentiated by vehicle type 2A: Revenues to general budget<br />
2B: Revenues to traffic system<br />
2C: Lower car taxation and new <strong>road</strong>s<br />
2D: Revenues to public transport<br />
2E: Abolition <strong>of</strong> car ownership taxes<br />
2F: Lower fuel taxes<br />
3: Kilometre charge with different charge levels<br />
and different revenue use<br />
2G: Revenues to improve and construct new <strong>road</strong>s<br />
3A: 2.5 €cents, unclear revenue use<br />
3B: 5 €cents, unclear revenue use<br />
3C: 7.5 €cents, unclear revenue use<br />
3D: 2.5 €cents, improvement <strong>of</strong> <strong>road</strong> network<br />
3E: 5 €cents, improvement <strong>of</strong> <strong>road</strong> network<br />
3F: 7.5 €cents, improvement <strong>of</strong> <strong>road</strong> network<br />
3G: 2.5 €cents, abolish existing car taxation<br />
3H: 5 €cents, abolish existing car taxation<br />
3I: 7.5 €cents, abolish existing car taxation<br />
Within each type <strong>of</strong> measure, we have developed a number <strong>of</strong> variants differing on: type <strong>of</strong><br />
charge (measure 1), type <strong>of</strong> revenue use (measure 2) and level <strong>of</strong> charge plus revenue use<br />
(measure 3) (see Table 9.1). This resulted in 4 different variants for measure 1, 7 for measure<br />
2, and 9 for measure 3 (a detailed description can be found in Appendix 9b).<br />
All variants were randomly distributed over the respondents. This means that we obtained<br />
about 140 observations for each variant <strong>of</strong> measure 1, 80 for each variant <strong>of</strong> measure 2, and<br />
60 for each variant <strong>of</strong> measure 3. A short introduction preceded the explanation <strong>of</strong> the<br />
measures. This was to explain that the respondent had to imagine the implementation <strong>of</strong> the<br />
measures in the Netherlands. It was also to be assumed that the privacy <strong>of</strong> car users is<br />
guaranteed, electronic equipment registers the toll and the driver can freely choose the<br />
payment method (e.g. credit card, bank transfer, etc.). <strong>The</strong> introduction to measure 2 and 3<br />
(time-independent charges) also included an estimation <strong>of</strong> the financial consequences for an<br />
average driver (driving 16,000 km in a year), irrespective <strong>of</strong> type <strong>of</strong> revenue use.<br />
In addition, we asked the respondents to evaluate the acceptance <strong>of</strong> different revenue uses<br />
separately (without specifying the <strong>road</strong> <strong>pricing</strong> measure). Six different revenue use options<br />
were presented to the respondent: the treasury <strong>of</strong> the government (and hence be used for<br />
purposes other than transport); new <strong>road</strong>s; improvement <strong>of</strong> public transport (e.g. increase <strong>of</strong><br />
frequencies); a removal <strong>of</strong> existing car ownership taxes; a decrease in fuel taxation; and a<br />
decrease <strong>of</strong> income taxes. Again, for each option, a 7-point acceptability scale was used.<br />
9.2.2 General results<br />
Before investigating the distribution <strong>of</strong> the levels <strong>of</strong> acceptance, we begin with an overview <strong>of</strong><br />
the average acceptance levels for each single measure. Figure 9.1 shows the mean acceptance<br />
outcomes and their confidence intervals 22 .<br />
<strong>The</strong> mean level <strong>of</strong> acceptance differs considerably between the various types <strong>of</strong> measures.<br />
Whereas all types <strong>of</strong> measure 1 (bottleneck passage tolls) can be classified as somewhat<br />
unacceptable, this is not always the case for the other measures. In particular, measures 2C<br />
(revenue use: new <strong>road</strong>s and less car taxation), 2E (abandoning <strong>of</strong> <strong>road</strong> taxation), and 2F<br />
22 We present ‘unweighted’ results. When we correct the outcomes for representativeness (on age, education and<br />
income) in order to obtain a good match with the pr<strong>of</strong>ile <strong>of</strong> Goudappel C<strong>of</strong>feng and create a ‘weighted’ sample,<br />
we find comparable results.<br />
179
(lower fuel taxes) have higher acceptance levels. But, a score <strong>of</strong> 4 still means that the<br />
respondents are neutral. <strong>The</strong> patterns <strong>of</strong> outcomes for measure 3 can be easily explained by<br />
the structure <strong>of</strong> the measure (a combination <strong>of</strong> 3 different charge levels with 3 different<br />
revenue use options). Apparently, the respondents prefer revenues to be used for the abolition<br />
<strong>of</strong> car taxation over that <strong>of</strong> new <strong>road</strong> and an unclear revenue destination. A charge <strong>of</strong> 2.5<br />
€cents is more acceptable than higher charges <strong>of</strong> 5 and 7.5 €cents, as may be expected.<br />
Measure 3G has the highest mean (4.71) which comes close to an average score <strong>of</strong> 5<br />
(‘somewhat acceptable’).<br />
<strong>The</strong>se findings suggest the following interesting issues. First, given the results for measure 1,<br />
it seems that the level <strong>of</strong> acceptability does not depend on the complexity <strong>of</strong> the measure.<br />
Hence, acceptability is not necessarily a reason for starting simple. Second, measure 3<br />
suggests that revenue use has more effect on the level <strong>of</strong> acceptance than the charge level (for<br />
the chosen range). People prefer a charge <strong>of</strong> 7.5 €cents with abolition <strong>of</strong> car taxation over a<br />
charge <strong>of</strong> 2.5 €cents with revenues hypothecated to the general treasury. This underlines the<br />
importance <strong>of</strong> the allocation <strong>of</strong> the revenues.<br />
Appendix 9c shows the percentages <strong>of</strong> respondents who find the various measures<br />
‘unacceptable’ or ‘very unacceptable’. <strong>The</strong>se outcomes confirm the previously described<br />
‘mean’ pattern.<br />
Acceptance level<br />
7<br />
6<br />
5<br />
4<br />
3<br />
2<br />
1<br />
1A 1B 1C 1D 2A 2B 2C 2D 2E 2F 2G 3A 3B 3C 3D 3E 3F 3G 3H 3I<br />
Type <strong>of</strong> measure<br />
Figure 9.1: Mean and 95% confidence intervals <strong>of</strong> acceptance scores on each single measure<br />
(level 1 = very unacceptable; level 7 = very acceptable)<br />
9.2.3 A search for explanatory variables <strong>of</strong> the acceptance levels <strong>of</strong> 3 <strong>road</strong> <strong>pricing</strong> measures<br />
and 6 types <strong>of</strong> revenue use<br />
Various econometric techniques are available that can be used to investigate the relation<br />
between different variables. <strong>The</strong> methodology to be applied depends to a large extent on the<br />
structure <strong>of</strong> the data. Here, the aim is first to explain the level <strong>of</strong> acceptance for the various<br />
measures, where the dependent variable consists <strong>of</strong> a choice out <strong>of</strong> an ordered set <strong>of</strong><br />
acceptance variants. Given this framework, which is similar to the situation where we studied<br />
the probability <strong>of</strong> selling the car in Chapter 5, the ordered probit (OP) technique seems again<br />
to be most appropriate (for a discussion <strong>of</strong> OP, see Maddala (1983)).<br />
180
Various specifications <strong>of</strong> the model for all measures (by including variables that may be<br />
expected to have some explanatory power) have been tried. <strong>The</strong> following tables present our<br />
preferred specifications. <strong>The</strong> estimations for each type <strong>of</strong> measure have been made with the<br />
same explanatory variables in order to maximise comparability between the models.<br />
Measure 1: Electronic toll on daily bottlenecks with fixed revenue use (new <strong>road</strong>s)<br />
Table 9.2 presents the estimation results for measure 1. <strong>The</strong> first row presents the estimates<br />
for the threshold values (μ’s) explained in Chapter 5. <strong>The</strong> second row presents all the<br />
explanatory variables that have been included in the estimation. It appears that the<br />
individual’s value <strong>of</strong> time, level <strong>of</strong> education, and compensation <strong>of</strong> costs by the employer all<br />
have a significant and positive impact on acceptance. Most signs <strong>of</strong> the coefficients are as<br />
expected. For example, respondents with higher value <strong>of</strong> time tend to have higher acceptance<br />
levels <strong>of</strong> an electronic toll on daily bottlenecks. Interestingly, inclusion <strong>of</strong> the individual’s<br />
value <strong>of</strong> schedule delay (early and late) and the value <strong>of</strong> uncertainty did not lead to significant<br />
results. This suggests that people find it hard to predict whether or not uncertainty will reduce<br />
under congestion <strong>pricing</strong>, and whether or not advantages in terms <strong>of</strong> schedule delay costs can<br />
be realized. Alternatively, people may have ignored these matters.<br />
As expected, commuters who have to pay the toll themselves (no compensation) and drive<br />
many kilometres tend to find the measure less acceptable than drivers who receive full<br />
compensation and use the car less <strong>of</strong>ten. Income is not significant; one explanation may be<br />
that VOT and education (both correlated with income) take up the expected effect. Income<br />
indeed becomes significant (at the 5% level) when VOT and education are not included in the<br />
estimation. On the other hand, the type <strong>of</strong> measure, living in one <strong>of</strong> the three larger cities<br />
(loc1, included to compare the opinions <strong>of</strong> people located in densely urbanised areas with<br />
those in the rest <strong>of</strong> the Netherlands) and the weight <strong>of</strong> the car do not seem to have an<br />
important impact.<br />
As already apparent from Figure 9.1, the different types <strong>of</strong> bottleneck charging measures have<br />
no significant effect on the acceptance <strong>of</strong> the respondent. It makes no difference whether it is<br />
a charge at all times (1A), a peak time charge (1B), a differentiated peak charge (1C) or a<br />
charge based on actual traffic conditions (1D), although the latter seems somewhat less<br />
acceptable than the other three (although not significantly). This suggests that the structure <strong>of</strong><br />
measure (ranging from a flat and certain charge to a highly uncertain charge depending on<br />
traffic density) may not necessarily have an impact on the level <strong>of</strong> acceptance.<br />
<strong>The</strong> perceived level <strong>of</strong> ‘general effectiveness’ in terms <strong>of</strong> (less) congestion (i.e. in Table 9.2<br />
general effectiveness (less congestion)) has an important impact on acceptance 23 . <strong>The</strong> results<br />
suggest that respondents who think that the measure will be effective also tend to find it more<br />
acceptable. <strong>The</strong> effectiveness in terms <strong>of</strong> less environmental problems is not included in the<br />
model as this variable was highly correlated with ‘effectiveness (less congestion)’. <strong>The</strong><br />
‘personal effectiveness’ (indicating whether people tend to use their car less when the<br />
measure is implemented) shows a somewhat irregular pattern. Compared with people who<br />
indicate that they do not change their behaviour (peff=1), respondents who find a personal<br />
change more likely have a higher level <strong>of</strong> acceptance. This may be explained by the ‘protest<br />
voters’ in group 1: “the measure is not acceptable because I will not change behaviour” or “I<br />
say I will not change behaviour because I don’t want this measure implemented”. An<br />
explanation <strong>of</strong> the low score <strong>of</strong> peff=7 may be that these respondents (who indicate that they<br />
will most likely drive less) find the measure not that acceptable because they perceive the<br />
consequences <strong>of</strong> changing behaviour as (very) negative.<br />
23<br />
<strong>The</strong> type <strong>of</strong> measure that has been proposed has no significant impact on the level <strong>of</strong> general effectiveness (in<br />
terms <strong>of</strong> less congestion).<br />
181
Table 9.2: Results <strong>of</strong> ordered probit analysis with the acceptance <strong>of</strong> measure 1 as the<br />
dependent variable<br />
Variable Probit ACC measure 1 Sign.<br />
Threshold (μ’s)<br />
μ 1<br />
μ 2<br />
μ 3<br />
μ 4<br />
μ 5<br />
μ 6<br />
Gross yearly income<br />
VOT<br />
Gender (female)<br />
Education (Edu1 (primary school) = base)<br />
Edu2 (junior general sec.)<br />
Edu3 (intermediate vocational)<br />
Edu4 (senior general sec.)<br />
Edu5 (Bachelor)<br />
Edu6 (Master)<br />
Loc1 (3 large cities)<br />
Childyes<br />
Age (age5 (56+) = base)<br />
Age1 (18-25)<br />
Age2 (26-35)<br />
Age3 (36-45)<br />
Age4 (46-55)<br />
Travel time in congestion/free flow tt<br />
Type <strong>of</strong> measure (measure 1D = base)<br />
M1A (charge <strong>of</strong> € 1)<br />
M1B (charge <strong>of</strong> € 2 during peak)<br />
M1C (peak time charge)<br />
Number <strong>of</strong> kilometres driven yearly<br />
Compensation <strong>of</strong> costs by employer (full compensation = base)<br />
Comp1 (no transport costs paid by employer)<br />
Comp2 (transport costs partly compensated)<br />
Vehicle weight (Weight3 (heavy weight) = base)<br />
Weight1 (low weight)<br />
Weight2 (middle weight)<br />
General effectiveness (less congestion) (Geff1 = base)<br />
Geff2<br />
Geff3<br />
Geff4<br />
Geff5<br />
Geff6<br />
Geff7<br />
Personal effectiveness (drive less yourself) (peff1 = base)<br />
Peff2<br />
Peff3<br />
Peff4<br />
Peff5<br />
Peff6<br />
Peff7<br />
1.073 (.450)<br />
2.309 (.456)<br />
2.781 (.458)<br />
3.136 (.461)<br />
4.036 (.469)<br />
5.564 (.538)<br />
8.58 E-03 (.019)<br />
4.26 E-02 (.010)<br />
-.166 (.121)<br />
.245 (.232)<br />
.168 (.156)<br />
.414 (.198)<br />
.413 (.152)<br />
.739 (.191)<br />
-.197 (.121)<br />
9.92E-02 (.112)<br />
-.257 (.250)<br />
-9.48E-02 (.199)<br />
-4.91E-02 (.208)<br />
-.184 (.209)<br />
6.25E-02 (.075)<br />
.168 (.136)<br />
.167 (.128)<br />
.134 (.133)<br />
-2.92E-06 (.000)<br />
-.310 (.163)<br />
-9.93E-02 (.108)<br />
.167 (.189)<br />
.221 (.159)<br />
.774 (.149)<br />
1.107 (.185)<br />
1.554 (.236)<br />
1.765 (.185)<br />
2.145 (.262)<br />
1.859 (.497)<br />
354 (.128)<br />
.539 (.199)<br />
.212 (.196)<br />
.360 (.185)<br />
.447 (.230)<br />
2.92E-02 (.433)<br />
N 564<br />
Log-likelihood -815.555 ***<br />
Pseudo R-square Cox and Snell .379<br />
Nagelkerke<br />
.393<br />
McFadden<br />
.142<br />
Notes: <strong>The</strong> standard errors are shown in brackets. *, ** and *** denote significance at the 10%, 5% and 1%<br />
level, respectively, (two-sided t-test).<br />
<strong>The</strong> results suggest that acceptance need not depend on the complexity <strong>of</strong> the <strong>road</strong> <strong>pricing</strong><br />
measure. This gives possibilities to policy makers to consider time-differentiated charges that<br />
tend to be more effective in reducing congestion. <strong>The</strong> perception <strong>of</strong> effectiveness also seems<br />
very important for the level <strong>of</strong> acceptance. Clearly explaining the objectives and expected<br />
**<br />
***<br />
***<br />
***<br />
***<br />
***<br />
***<br />
**<br />
***<br />
***<br />
*<br />
*<br />
***<br />
***<br />
***<br />
***<br />
***<br />
***<br />
***<br />
***<br />
*<br />
*<br />
182
<strong>effects</strong> may therefore be an important aspect <strong>of</strong> the communication strategy <strong>of</strong> the<br />
government.<br />
Measure 2: Kilometre charge dependent on vehicle weight with different revenue use<br />
Table 9.3 shows the estimation results for the second measure. Again, we see the importance<br />
<strong>of</strong> the VOT and compensation <strong>of</strong> costs by the employer. Education is not as important as for<br />
measure 1. One explanation may be that measure 2 (like 3) is more easily accepted on the<br />
basis <strong>of</strong> equity arguments, which require less intellectual effort than effectiveness or<br />
efficiency. A striking difference with the previous estimation is the difference between the<br />
(sub-) types <strong>of</strong> measure. Measures C, E and F received significantly more support than<br />
measure G, but also than the other 3 variants <strong>of</strong> this measure. This suggests that when<br />
revenues from the charge are used to lower or abandon existing car taxation (2B and 2E) or<br />
fuel taxes (2F), more public support is obtained. <strong>The</strong> weight <strong>of</strong> the car (and also the number<br />
<strong>of</strong> kilometres driven yearly) does not have a significant impact, despite the fact that this<br />
measure differentiates on this characteristic. Again, perceived general effectiveness in terms<br />
<strong>of</strong> congestion and personal effectiveness have a significant impact on the level <strong>of</strong> acceptance.<br />
We have included the effectiveness in terms <strong>of</strong> less congestion into the estimation and not the<br />
effectiveness on the environment despite its possible relevance here. <strong>The</strong>se two variables are<br />
again strongly correlated and have equal results in terms <strong>of</strong> significance. <strong>The</strong> mean score on<br />
environmental effectiveness is only slightly higher than the perceived effectiveness on<br />
congestion (it is not “very probable” that congestion will decrease or that the environment<br />
will benefit from this measure). Given the nature <strong>of</strong> this measure, a greater difference might<br />
have been expected. Personal effectiveness shows almost the same (irregular) pattern that we<br />
found for measure 1, and again the same hypothesis applies here.<br />
<strong>The</strong> analysis indicates that (as expected) revenue use is an important explanatory variable for<br />
the acceptance level. Revenue allocations that are in the direct interest <strong>of</strong> the individual are<br />
more popular. This confirms the findings <strong>of</strong> other studies such as Verhoef (1996).<br />
Characteristics <strong>of</strong> individual specific (mobility) behaviour tend to be <strong>of</strong> less relevance, except<br />
for the value <strong>of</strong> time. <strong>The</strong> perceived level <strong>of</strong> effectiveness <strong>of</strong> the measure by the respondents<br />
is important (as also confirmed by the results <strong>of</strong> Steg (2003)).<br />
183
Table 9.3: Results <strong>of</strong> ordered probit analysis with the acceptance <strong>of</strong> measure 2 as the<br />
dependent variable<br />
Variable Probit ACC measure 2 Sign.<br />
Threshold (μ’s)<br />
μ 1<br />
μ 2<br />
μ 3<br />
μ 4<br />
μ 5<br />
μ 6<br />
Gross yearly income<br />
Gender (female)<br />
Education (Edu1 (primary school) = base)<br />
Edu2 (junior general sec.)<br />
Edu3 (intermediate vocational)<br />
Edu4 (senior general sec.)<br />
Edu5 (Bachelor)<br />
Edu6 (Baster)<br />
Loc1 (3 large cities)<br />
Childyes<br />
Age (Age5 (56+) = base)<br />
Age1 (18-25)<br />
Age2 (26-35)<br />
Age3 (36-45)<br />
Age4 (46-55)<br />
Travel time in congestion/free flow tt<br />
Type <strong>of</strong> measure (measure 2G = base)<br />
M2A (revenues to general budget)<br />
M2B (traffic system in general)<br />
M2C (lower car taxes and new <strong>road</strong>s)<br />
M2D (public transport)<br />
M2E (abandon existing ownership tax)<br />
M2F (lower existing fuel taxes)<br />
Number <strong>of</strong> kilometres driven yearly<br />
Compensation <strong>of</strong> costs by employer (full compensation = base)<br />
Comp1 (no transport costs paid by employer)<br />
Comp2 (transport costs partly compensated)<br />
Vehicle weight (Weight3 (heavy weight) = base)<br />
Weight1 (low weight)<br />
Weight2 (middle weight)<br />
VOT<br />
General effectiveness (less congestion) (Geff1 = base)<br />
Geff2<br />
Geff3<br />
Geff4<br />
Geff5<br />
Geff6<br />
Geff7<br />
Personal effectiveness (drive less yourself) (Peff1 = base)<br />
Peff2<br />
Peff3<br />
Peff4<br />
Peff5<br />
Peff6<br />
Peff7<br />
-.263 (.443)<br />
.609 (.444)<br />
.943 (.445)<br />
1.267 (.445)<br />
1.898 (.448)<br />
3.073 (.461)<br />
-2.51E-02 (.019)<br />
-7.49E-02 (.119)<br />
-.115 (.223)<br />
8.12E-02 (.151)<br />
.213 (.193)<br />
.260 (.149)<br />
.424 (.184)<br />
-7.00E-02 (.119)<br />
1.23E-02 (.110)<br />
-8.21E-02 (.245)<br />
-.289 (.199)<br />
-.204 (.206)<br />
-.255 (.207)<br />
2.05E-02 (.073)<br />
-.139 (.173)<br />
-2.69E-02 (.178)<br />
.469 (.176)<br />
.138 (.172)<br />
.471 (.177)<br />
.524 (.176)<br />
-2.55E-06 (.000)<br />
-.372 (.160)<br />
-.246 (.106)<br />
.187 (.187)<br />
.131 (.156)<br />
2.37E-02 (.010)<br />
.637 (.139)<br />
.887 (.168)<br />
.846 (.193)<br />
1.216 (.184)<br />
1.258 (.275)<br />
2.287 (.790)<br />
.275 (.138)<br />
.400 (.180)<br />
.187 (.189)<br />
.420 (.187)<br />
.242 (.244)<br />
-.204 (.316)<br />
N 564<br />
Log-likelihood -935.406 ***<br />
Pseudo R-square Cox and Snell<br />
Nagelkerke<br />
McFadden<br />
Notes: <strong>The</strong> standard errors are shown in brackets. *, ** and *** denote significance at the 10%, 5% and 1%<br />
level, respectively, (two-sided t-test).<br />
**<br />
***<br />
***<br />
***<br />
*<br />
**<br />
***<br />
***<br />
***<br />
**<br />
**<br />
**<br />
***<br />
***<br />
***<br />
***<br />
***<br />
***<br />
**<br />
**<br />
**<br />
.272<br />
.280<br />
.087<br />
184
Measure 3: Kilometre charge with different toll levels and revenue uses<br />
<strong>The</strong> third measure that we have analysed consists <strong>of</strong> 9 sub-measures that combine one out <strong>of</strong><br />
three types <strong>of</strong> revenue use with one out <strong>of</strong> three levels <strong>of</strong> a charge. Two sets <strong>of</strong> dummy<br />
variables thus define the type <strong>of</strong> measure: one for the type <strong>of</strong> revenue use and one for the level<br />
<strong>of</strong> the charge. Table 9.4 shows the results for this estimation. It is interesting to see that the<br />
level <strong>of</strong> acceptance very much depends on the way revenues are redistributed, and (but less<br />
so, for the values considered) the level <strong>of</strong> the charge (as may be expected). Higher charges are<br />
relatively less acceptable, and the abolition <strong>of</strong> existing car taxes is far more acceptable than an<br />
unclear revenue use (note the high coefficient), and somewhat more acceptable than the<br />
construction <strong>of</strong> new <strong>road</strong>s. This is consistent with finding that measure 3G (combination <strong>of</strong><br />
low charge and abandoning <strong>of</strong> existing car taxes) is relatively most acceptable (confirmed by<br />
the results shown in Figure 9.1). It is remarkable that the weight <strong>of</strong> the vehicle has an<br />
explanatory impact here. This may have something to do with the fact that the previous<br />
measure 2B was differentiated according to weight. In indicating acceptance respondents may<br />
have compared measure 3 with that measure; and therefore people with smaller cars now find<br />
this measure less acceptable. Expected effectiveness again has a very significant impact on<br />
the level <strong>of</strong> acceptance. Commuters who indicate that the measure will be effective are less<br />
opposed to this measure. <strong>The</strong> respondents’ value <strong>of</strong> time, education and personal effectiveness<br />
seem to lose importance compared with the other measures. In contrast to the previous<br />
measures, personal effectiveness is no longer significant. It is not clear what causes these<br />
differences with the previous cases.<br />
<strong>The</strong> predictability <strong>of</strong> the charge level and the complexity <strong>of</strong> the measure may not be important<br />
(see measure 1), but the level <strong>of</strong> the charge and the revenue use is relevant. Individual<br />
characteristics are less important in explaining the level <strong>of</strong> acceptance. <strong>The</strong> differences<br />
between groups are small, which makes it difficult for governments to specify certain groups<br />
that may be compensated to increase acceptance.<br />
185
Table 9.4: Results <strong>of</strong> ordered probit analysis with the acceptance <strong>of</strong> measure 3 as the<br />
dependent variable<br />
Variable Probit ACC measure 3 Sign.<br />
Threshold (μ’s)<br />
μ 1<br />
μ 2<br />
μ 3<br />
μ 4<br />
μ 5<br />
μ 6<br />
Gross yearly income<br />
Gender (female)<br />
Education (Edu1 (primary school) = base)<br />
Edu2 (junior general sec.)<br />
Edu3 (intermediate vocational)<br />
Edu4 (senior general sec.)<br />
Edu5 (Bachelor)<br />
Edu6 (Master)<br />
Loc1 (3 large cities)<br />
Childyes<br />
Age (Age5 (56+) = base)<br />
Age1 (18-25)<br />
Age2 (26-35)<br />
Age3 (36-45)<br />
Age4 (46-55)<br />
Travel time in congestion/free flow tt<br />
Charge level for measure 3 (2.5 €cents = base)<br />
Charge=5 €cents (dummy)<br />
Charge=7.5 €cents (dummy)<br />
Revenue use for measure 3 (unclear = base)<br />
Revenue use is new <strong>road</strong>s (dummy)<br />
Revenue use is abandon car taxes (dummy)<br />
Number <strong>of</strong> kilometres driven yearly<br />
Compensation <strong>of</strong> costs by employer (full compensation = base)<br />
Comp1 (no transport costs paid by employer)<br />
Comp2 (transport costs partly compensated)<br />
Vehicle weight (Weight3 (heavy weight) = base)<br />
Weight1 (low weight)<br />
Weight2 (middle weight)<br />
VOT<br />
General effectiveness (less congestion) (Geff1 = base)<br />
Geff2<br />
Geff3<br />
Geff4<br />
Geff5<br />
Geff6<br />
Geff7<br />
Personal effectiveness (drive less yourself) (Peff1 = base)<br />
Peff2<br />
Peff3<br />
Peff4<br />
Peff5<br />
Peff6<br />
Peff7<br />
-2.43E-02 (.440)<br />
.960 (.441)<br />
1.331 (.442)<br />
1.728 (.444)<br />
2.325 (.447)<br />
3.405 (.459)<br />
1.06E-02 (.019)<br />
-.3.05E-02 (.120)<br />
-.156 (.233)<br />
8.14E-02 (.154)<br />
8.38E-02 (.196)<br />
.280 (.151)<br />
.194 (.187)<br />
-5.31E-02 (.122)<br />
-7.00E-02 (.111)<br />
-.102 (.251)<br />
-.129 (.201)<br />
-9.25E-02 (.208)<br />
-.218 (.210)<br />
4.58E-03 (.074)<br />
-.273 (.114)<br />
-.536 (.115)<br />
.270 (.118)<br />
1.235 (.123)<br />
-2.15E-06 (.000)<br />
-.358 (.163)<br />
-.180 (.106)<br />
-.520 (.189)<br />
-.335 (.157)<br />
1.84E-02 (.010)<br />
1.050 (.159)<br />
1.230 (.185)<br />
1.090 (.218)<br />
1.605 (.205)<br />
1.779 (.284)<br />
.650 (.652)<br />
4.23E-02 (.149)<br />
-2.56E-02 (.202)<br />
.150 (.198)<br />
8.76E-02 (.204)<br />
9.21E-02 (.247)<br />
-.276 (.351)<br />
N 564<br />
Log-likelihood -873.327 ***<br />
Pseudo R-square Cox and Snell<br />
Nagelkerke<br />
McFadden<br />
Notes: <strong>The</strong> standard errors are shown in brackets. *, ** and *** denote significance at the 10%, 5% and 1%<br />
level, respectively, (two-sided t-test).<br />
**<br />
***<br />
***<br />
***<br />
***<br />
*<br />
**<br />
***<br />
**<br />
***<br />
**<br />
*<br />
***<br />
**<br />
*<br />
***<br />
***<br />
***<br />
***<br />
***<br />
.408<br />
.419<br />
.145<br />
186
Revenue use only<br />
Finally, we asked the respondents for their opinion on the allocation categories <strong>of</strong> the<br />
revenues per se, so without defining the <strong>road</strong> <strong>pricing</strong> measure. Six different possibilities were<br />
evaluated on acceptance by the respondents (general budget, new <strong>road</strong>s, improve public<br />
transport, abandon existing car taxation, lower fuel taxes, and lower income taxes). <strong>The</strong><br />
findings presented in Figure 9.2 are largely in line with the previous findings <strong>of</strong> revenue use<br />
as part <strong>of</strong> a <strong>road</strong> <strong>pricing</strong> measure. An abolition <strong>of</strong> existing car taxes is most preferred (a mean<br />
score <strong>of</strong> 5.85, a 6 is ‘acceptable’), whereas the general budget is ‘unacceptable’. <strong>The</strong><br />
construction <strong>of</strong> new <strong>road</strong>s is valued rather positively here, while the acceptability <strong>of</strong> measure<br />
2G (kilometre charge with the same type <strong>of</strong> revenue use) is considerably lower (see Figure<br />
9.1). More than 74% <strong>of</strong> the respondents indicated that the general budget is ‘unacceptable’ or<br />
‘very unacceptable’ (see Appendix 9c). <strong>The</strong> confidence intervals are smaller than those <strong>of</strong> the<br />
<strong>road</strong> <strong>pricing</strong> measures (see Figure 9.1), indicating less variance in the answers.<br />
Acceptance level<br />
7<br />
6<br />
5<br />
4<br />
3<br />
2<br />
1<br />
general budget low er income<br />
taxes<br />
improve public<br />
transport<br />
Type <strong>of</strong> revenue spending<br />
new <strong>road</strong>s low er fuel taxes abandon existing<br />
car taxation<br />
Figure 9.2: Mean and 95% confidence intervals <strong>of</strong> acceptance scores on each type <strong>of</strong> revenue<br />
use (level 1 = very unacceptable; level 7 = very acceptable)<br />
We have carried out a similar type <strong>of</strong> (ordered probit) analysis as we did for the <strong>road</strong> <strong>pricing</strong><br />
measures, in order to explain the acceptance levels for these types <strong>of</strong> revenue use. When<br />
policy makers want to compensate certain groups, it is useful for them to know the<br />
preferences <strong>of</strong> these groups. <strong>The</strong> estimations <strong>of</strong> the preferred results can be found in<br />
Appendix 9d. Again, for each type <strong>of</strong> revenue use the same explanatory variables have been<br />
included after having tried various specifications <strong>of</strong> the model (by including and excluding<br />
variables that may be expected to have some explanatory power).<br />
<strong>The</strong> results differ greatly over the various types <strong>of</strong> revenue use. Income is only significant<br />
when revenues are used to lower income taxes or to construct new <strong>road</strong>s. Lower income<br />
groups dislike revenues to be used for new <strong>road</strong>s more than people with a higher income,<br />
whereas the opposite holds when revenues are used to lower income taxes. <strong>The</strong> explanation<br />
for the first finding could be that lower income people drive less. For the second finding, the<br />
higher marginal utility could be an explanation. Hence, when policy makers propose to<br />
compensate the lowest income groups by lowering income taxes they obtain most support<br />
from this category (although overall support levels for this type <strong>of</strong> measure are rather<br />
modest). Another interesting variable is the compensation <strong>of</strong> costs by the employer. As may<br />
187
e expected, respondents who are not or only partly compensated have in general more<br />
support for abolition <strong>of</strong> existing car taxation than people who do not have to pay these taxes.<br />
This may also explain the disapproval <strong>of</strong> revenues being used for the general budget by<br />
people without full compensation; personal compensation is a better objective for this group.<br />
<strong>The</strong> weight <strong>of</strong> the vehicle seems important for two targets: lower fuel taxes and improvement<br />
<strong>of</strong> public transport. Owners <strong>of</strong> smaller vehicles (with lower weights) find lower fuel taxes less<br />
acceptable than others, this may be explained by the fact that this group drives relatively more<br />
fuel efficiently and consequently benefits less than people with large (and heavy) cars. <strong>The</strong><br />
importance <strong>of</strong> the VOT for certain allocation categories (i.e. general budget and improvement<br />
<strong>of</strong> public transport) seems somewhat strange and inexplicable.<br />
<strong>The</strong> findings on acceptance for revenue use targets are similar to earlier reported results in the<br />
literature. <strong>The</strong> allocation objectives that are in the direct interest <strong>of</strong> the <strong>road</strong> users receive<br />
most support. Improvement <strong>of</strong> public transport is less acceptable in comparison with the<br />
findings <strong>of</strong> Schade and Schlag (2000). Revenues may theoretically ideally be used to reduce<br />
distortive income taxes (which is beneficial from a welfare perspective), but support for this<br />
option from Dutch commuters is low.<br />
9.3 Acceptance and revenue use: a survey among car owners<br />
We conducted a second survey to assess acceptance levels <strong>of</strong> very specific, policy-relevant,<br />
<strong>road</strong> <strong>pricing</strong> measures. In this survey, variabilisation <strong>of</strong> the present tax system is the focus.<br />
Different types <strong>of</strong> a kilometre charge have been combined with two different forms <strong>of</strong><br />
revenue spending: income tax compensation, and car tax abolition. Such a change in the tax<br />
structure will affect car users in general, not only car commuters. <strong>The</strong> sample is, therefore,<br />
different from the previous survey; all respondents are car owners. This is the relevant group<br />
when policy makers consider a reform <strong>of</strong> the <strong>road</strong> taxation system, as described by the<br />
proposed measures. It is important to know the acceptance levels <strong>of</strong> this group. Note that this<br />
sample is equal to the one that is described in Chapter 5; respondents answered both<br />
acceptance as well as effectiveness questions. A brief overview <strong>of</strong> effectiveness and<br />
acceptance scores for the measures considered is given in Section 9.3.4.<br />
Because the objectives and the structure <strong>of</strong> the data are similar to the analysis discussed in<br />
Section 9.2, we have chosen a comparable approach in this section. <strong>The</strong> differences are the<br />
survey sample and the <strong>road</strong> <strong>pricing</strong> measures that have been evaluated. Again, we start with<br />
an explanation <strong>of</strong> the data collection including the survey sample. We apply the same<br />
methodology, which will not be explained again (see Section 9.2.3 for this explanation).<br />
9.3.1 Data collection and survey<br />
<strong>The</strong> data have been obtained by conducting an Internet survey among Dutch car owners. <strong>The</strong><br />
total sample consists <strong>of</strong> 562 respondents, <strong>of</strong> whom 288 are car commuters who experience<br />
congestion on a regular basis (the respondents included in the survey discussed in the<br />
previous section). <strong>The</strong> respondents were again confronted with three different <strong>road</strong> <strong>pricing</strong><br />
measures. First, we asked them to indicate their intentions to change their driving behaviour<br />
when these measures are actually implemented. <strong>The</strong> results from this part <strong>of</strong> the survey (on<br />
the effectiveness <strong>of</strong> <strong>road</strong> <strong>pricing</strong>) were discussed earlier in Chapter 5. Secondly, we addressed<br />
the issue <strong>of</strong> the acceptance <strong>of</strong> the three different measures. <strong>The</strong>se outcomes will be analysed<br />
in this section.<br />
<strong>The</strong> data were collected during three weeks in February 2005. <strong>The</strong> survey began with some<br />
general and personal questions, providing important information on the respondents that may<br />
help explain the differences in (self-reported) effectiveness and acceptance levels. Most<br />
variables <strong>of</strong> interest are explained in Appendix 9e, which also shows the pr<strong>of</strong>ile <strong>of</strong> our sample<br />
(Section 5.2.2 discusses this pr<strong>of</strong>ile).<br />
188
<strong>The</strong> respondent was confronted with three different types <strong>of</strong> <strong>road</strong> <strong>pricing</strong> measures. All<br />
descriptions <strong>of</strong> the measures consisted <strong>of</strong> two major components: we explained the level <strong>of</strong><br />
the charge and the allocation <strong>of</strong> the revenues. Furthermore, we provided each respondent<br />
individually with an estimation <strong>of</strong> the financial consequences <strong>of</strong> the implementation <strong>of</strong> the<br />
proposed measure under unchanged behaviour. Answers to previous questions allowed us to<br />
calculate the costs in the new situation. Information on the annual number <strong>of</strong> kilometres<br />
driven, and for some measures also on the type <strong>of</strong> vehicle (measure 2B) and time <strong>of</strong> driving<br />
(measures 2A and 3)) is the input for the cost estimation based on current behaviour. <strong>The</strong><br />
financial benefits depend on the type <strong>of</strong> revenue use (only for those measures where existing<br />
car taxes are abolished) 24 . This is different from the previous survey where we only presented<br />
the costs for an average driver and neglected the type <strong>of</strong> revenue use and type <strong>of</strong> car. We also<br />
explained some practical issues with the intention to minimise biases due to the more practical<br />
aspects <strong>of</strong> kilometre charging; the privacy <strong>of</strong> car users is guaranteed, electronic equipment<br />
registers the toll and the driver can freely choose the payment method (e.g. credit card, bank<br />
transfer, etc.).<br />
Table 9.5: Short description <strong>of</strong> the <strong>road</strong> <strong>pricing</strong> measures presented to the respondents<br />
Measure Variant<br />
1:Kilometre charge with 1A: 3 €cents, abolition <strong>of</strong> car ownership taxes<br />
different charge levels 1B: 6 €cents, abolition <strong>of</strong> existing car taxation (purchase and ownership)<br />
and different revenue<br />
allocations<br />
1C: 12 €cents, abolition <strong>of</strong> existing car taxation and new <strong>road</strong>s<br />
1D: 3 €cents, revenues used to lower income taxes<br />
1E: 6 €cents, revenues used to lower income taxes<br />
1F: 12 €cents, revenues used to lower income taxes<br />
2:Kilometre charge 2A: 2 €cents with multi-step (morning and evening) peak-time charge, revenues used to<br />
differentiated according abolish car ownership taxes<br />
to time (2A) or weight <strong>of</strong> 2B: differentiated according to weight <strong>of</strong> the car, revenues used to abolish existing car<br />
the vehicle (2B) taxation<br />
3: Peak and <strong>of</strong>f-peak 3A: 2 €cents outside peak times and 6 €cents in peak, abolition <strong>of</strong> car ownership taxes<br />
kilometre charge, 3B: 4 €cents outside peak times and 12 €cents in peak, abolition <strong>of</strong> existing car taxation<br />
different revenue 3C: 8 €cents outside peak times and 24 €cents in peak, abolition <strong>of</strong> existing car taxation and<br />
allocations<br />
new <strong>road</strong>s<br />
3D: 2 €cents outside peak times and 6 €cents in peak, revenues used to lower income taxes<br />
3E: 4 €cents outside peak times and 12 €cents in peak, revenues used to lower income taxes<br />
3F: 8 €cents outside peak times and 24 €cents in peak, revenues used to lower income taxes<br />
Table 9.5 shows the various measures that have been composed: 6 different variants for<br />
measure 1, 2 variants for measure 2, and again 6 variants for the third measure (a more<br />
detailed description can be found in Appendix 9f). All variants were randomly divided over<br />
the respondents, and each respondent evaluated one variant <strong>of</strong> each measure (so three in<br />
total). This means that we obtained at least 88 observations for each variant <strong>of</strong> measure 1, 282<br />
for measure 2A and 280 for measure 2B, and at least 88 for each variant <strong>of</strong> measure 3.<br />
9.3.2 General results<br />
Before investigating the distribution <strong>of</strong> the levels <strong>of</strong> acceptance, we begin with an overview <strong>of</strong><br />
the average acceptance levels for each single measure. Figure 9.3 shows the mean acceptance<br />
outcomes and the confidence intervals.<br />
24 <strong>The</strong> benefits from paying less car taxation depend on the type <strong>of</strong> car that the respondents<br />
own (fuel and weight). We have estimated averages for nine categories (a combination <strong>of</strong><br />
three fuel types and three weight categories), for an abolition <strong>of</strong> car ownership taxes (MRB)<br />
only, and for an abolition <strong>of</strong> all existing car taxation (MRB and BPM).<br />
189
<strong>The</strong> mean level <strong>of</strong> acceptance for all different measures varies around 3, on a scale <strong>of</strong> 7,<br />
which was described, in words, as ‘somewhat unacceptable’. This is similar to what we found<br />
for the measures discussed in the previous section, despite the differences in structure. <strong>The</strong><br />
variation in answers given by the respondents is very small. Measure 1F (a charge <strong>of</strong> 12<br />
€cents, with revenues allocated to lower income taxes) is least popular and classified as<br />
unacceptable, whereas even the most acceptable (or better: least unacceptable) measures, 1A<br />
and 1B, are below the neutral category.<br />
<strong>The</strong> patterns <strong>of</strong> outcomes for measures 1 and 3 may, in the first place, be explained by the<br />
structure <strong>of</strong> the measure. Increasing charge levels (measure 1A to 1C, 1D to 1F and measure<br />
3A to 3C, 3D to 3F) are generally less acceptable. <strong>The</strong> exceptions <strong>of</strong> 1B (relative to 1A) and<br />
3C (relative to 3B) may be explained by the fact that the increase in charge levels is more or<br />
less <strong>of</strong>f-set by increased compensation levels.<br />
<strong>The</strong> allocation <strong>of</strong> the revenues is the other characteristic <strong>of</strong> the measures that may explain the<br />
difference in acceptance between these sets <strong>of</strong> variants. In most cases, the respondents seem<br />
to prefer revenues being used for the abolition <strong>of</strong> car taxation over that <strong>of</strong> lowering income<br />
taxes. <strong>The</strong> only exception is measure 3E, which is more popular than measure 3B. Appendix<br />
9e shows the percentages <strong>of</strong> respondents who find the various measures ‘unacceptable’ or<br />
‘very unacceptable’. <strong>The</strong>se outcomes confirm the previously described ‘mean’ pattern. For<br />
instance, measure 1F and measure 3F are least acceptable, not only on average acceptance but<br />
also in terms <strong>of</strong> the number <strong>of</strong> respondents (about 70% <strong>of</strong> the respondents) who find these<br />
“unacceptable” or “very unacceptable”). This figure drops below 40% for measures 1A, 1B<br />
and 2B; these measures are clearly more popular.<br />
Acceptance level<br />
7<br />
6<br />
5<br />
4<br />
3<br />
2<br />
1<br />
1A 1B 1C 1D 1E 1F 2A 2B 3A 3B 3C 3D 3E 3F<br />
Type <strong>of</strong> measure<br />
Figure 9.3: Mean and 95% confidence intervals <strong>of</strong> acceptance scores on each single measure<br />
(level 1 = very unacceptable; level 7 = very acceptable)<br />
9.3.3 A search for explanatory variables <strong>of</strong> acceptance levels for 3 <strong>road</strong> <strong>pricing</strong> measures<br />
We applied the same (ordered probit (OP)) technique as we did in the previous section to<br />
analyse the data. Again, we tried various specifications <strong>of</strong> the model for all measures (by<br />
including and excluding variables that may be expected to have some explanatory power).<br />
<strong>The</strong> following tables present our preferred specifications.<br />
190
Measure 1: Flat kilometre charge and varying revenue use<br />
Table 9.6 presents the estimation results for measure 1. <strong>The</strong> first row presents the estimates<br />
for the threshold values (μ’s) explained above. <strong>The</strong> second row presents all explanatory<br />
variables that have been included in the estimation. It appears that the type <strong>of</strong> measure (in<br />
terms <strong>of</strong> charge level and revenue use) is very important for the level <strong>of</strong> acceptance. <strong>The</strong> signs<br />
<strong>of</strong> the coefficients are as expected: the measures with a kilometre charge <strong>of</strong> 3 and 6 €cents are<br />
more acceptable than the 12 €cents measure. Allocating the revenues to lower the income<br />
taxes is less popular than a decrease <strong>of</strong> current car taxation. This result corresponds with<br />
previous findings (see also the results <strong>of</strong> the other questionnaire), which may be explained by<br />
the lower perceived costs for the individual. We have estimated the financial benefits from an<br />
abolition <strong>of</strong> <strong>road</strong> taxes, and presented this to the respondents together with the estimated costs<br />
from the charge. Unfortunately, this was not possible for the other type <strong>of</strong> revenue use (lower<br />
income taxes).<br />
<strong>The</strong> weight <strong>of</strong> the car and the number <strong>of</strong> kilometres driven yearly are also significant.<br />
Respondents owning a heavy car find this measure relatively more acceptable than people<br />
with smaller cars. This may be explained by the impact <strong>of</strong> the type <strong>of</strong> revenue use, since<br />
current Dutch car taxation is differentiated according to the weight <strong>of</strong> the car. Owners <strong>of</strong><br />
heavier cars pay relatively more taxes and benefit more than other car owners. But this only<br />
holds for three <strong>of</strong> the six variants. Assuming that heavier (and more expensive) cars are<br />
owned by higher income people, this is the same group that benefits relatively more from an<br />
income tax reduction. This may also explain the importance <strong>of</strong> weight for the other three<br />
variants (D to F). It seems rather plausible that people who use the car intensively (driving<br />
many kilometres) are relatively more against a kilometre charge than others. It is this group<br />
that will pay most.<br />
<strong>The</strong> perceived level <strong>of</strong> ‘general effectiveness’ in terms <strong>of</strong> (reducing) congestion has (again) an<br />
important impact on acceptance. <strong>The</strong> results suggest that respondents who think that the<br />
measure will be effective also tend to find it more acceptable (note that the base is different<br />
from the previous survey, which explains the negative signs here). Since we have information<br />
on the self-reported behavioural changes <strong>of</strong> the respondents (in terms <strong>of</strong> the proportion <strong>of</strong><br />
trips that will be changed), it is also possible to include ‘personal effectiveness’ into the<br />
analysis. <strong>The</strong> ‘self-reported behavioural change’ dummy is not significant, suggesting no<br />
difference in impact on the level <strong>of</strong> acceptance between respondents who do and do not<br />
expect to change their behaviour. We also found this also for a similar type <strong>of</strong> measure<br />
(measure 3) in the previous survey.<br />
<strong>The</strong> highest income group (inc4) is slightly more positive about the measure than the other<br />
income groups. While income seems not to be very important, employment is. People who<br />
have a job are more opposed to the measure than others. This group may also use the car for<br />
commuting reasons (not every employed person makes commuting trips by car, about 9.5% <strong>of</strong><br />
this group uses another mode), and our data confirms that commuters in most cases drive<br />
more kilometres. It is also this group that tends to experience congestion relatively more<br />
<strong>of</strong>ten, so the employment dummy may include this effect. However, we included a separate<br />
variable accounting for the number <strong>of</strong> times in congestion. <strong>The</strong> effect is modest (with the<br />
expected sign), but becomes stronger when the employment dummy is left out <strong>of</strong> the analysis,<br />
thus confirming our previous suspicion. Apparently this group does not expect the measure to<br />
be effective, even though they may benefit relatively most from reduced levels <strong>of</strong> congestion.<br />
We did test the impact <strong>of</strong> the compensation <strong>of</strong> costs by employers, but this was not important.<br />
<strong>The</strong> same holds for education, which is also correlated with income.<br />
191
Table 9.6: Results <strong>of</strong> ordered probit analysis with the acceptance <strong>of</strong> measure 1 as the<br />
dependent variable<br />
Variable Probit ACC measure 1 Sign.<br />
Threshold (μ’s)<br />
μ 1<br />
μ 2<br />
μ 3<br />
μ 4<br />
μ 5<br />
μ 6<br />
Age<br />
Income (inc5 (do not know/won’t say) = base)<br />
Inc1 (< € 28,500)<br />
Inc2 (€ 28,500-45,000)<br />
Inc3 (€ 45,000-68,000)<br />
Inc4 (>€ 68,000)<br />
Type <strong>of</strong> measure (charge, dummy 12 €cents = base)<br />
charge 3 €cents<br />
charge 6 €cents<br />
Type <strong>of</strong> measure (revenue use)<br />
Dummy income taxes<br />
Number <strong>of</strong> kilometres driven yearly<br />
Vehicle weight (dummy weight3 = base)<br />
Weight1 (low weight)<br />
Weight2 (middle weight)<br />
General effectiveness (less congestion) (Geff7 = base)^<br />
Geff1<br />
Geff2<br />
Geff3<br />
Geff4<br />
Geff5<br />
Geff6<br />
Self-reported behavioural change (dummy = yes)<br />
Employed (dummy = yes)<br />
Residential location (south = base)<br />
Loc1 (3 large cities)<br />
Loc2 (rest west)<br />
Loc3 (north)<br />
Loc4 (east)<br />
Weekly number <strong>of</strong> times in congestion<br />
-3.451 (.739)<br />
-2.617 (.737)<br />
-2.214 (.736)<br />
-1.827 (.735)<br />
-1.360 (.733)<br />
-.285 (.732)<br />
-.003 (.004)<br />
.226 (.280)<br />
.314 (.276)<br />
.299 (.280)<br />
.523 (.291)<br />
.606 (.114)<br />
.486 (.114)<br />
-.457 (.093)<br />
-7.27E-06 (.000)<br />
-.408 (.134)<br />
-.306 (.116)<br />
-2.341 (.642)<br />
-1.917 (.639)<br />
-1.763 (.649)<br />
-1.462 (.668)<br />
-1.321 (.653)<br />
-.948 (.734)<br />
.057 (.099)<br />
-.494 (.148)<br />
-.238 (.150)<br />
-.166 (.124)<br />
-.126 (.201)<br />
-.231 (.134)<br />
-.030 (.017)<br />
N 562<br />
Log-likelihood -917.490 ***<br />
Pseudo R-square Cox and Snell .250<br />
Nagelkerke .258<br />
McFadden .081<br />
Notes: <strong>The</strong> standard errors are shown in brackets. *, ** and *** denote significance at the 10%, 5% and 1%<br />
level, respectively, (two-sided t-test). ^ For comparison reasons (measure 2B has no geff7 observations)<br />
we use geff7 as base (and not geff1).<br />
Resuming, we may conclude that characteristics <strong>of</strong> the measure (level <strong>of</strong> charge, allocation)<br />
and mobility-related behaviour have an impact on the level <strong>of</strong> acceptance. Variabilisation with<br />
low kilometre charges are less opposed. Acceptance levels tend to be lower among people<br />
that <strong>of</strong>ten experience congestion. This is also the group who does not believe in the<br />
effectiveness <strong>of</strong> the measure. Policy makers may therefore target their communication<br />
strategy on this group when explaining the objectives and reducing opposition.<br />
Measure 2: Kilometre charge differentiated according to time (2A) or weight <strong>of</strong> the car<br />
(2B)<br />
<strong>The</strong> two variants <strong>of</strong> measure 2 are very different: a flat fee with a bottleneck charge during<br />
peak hours (2A), and a charge differentiated according to the weight <strong>of</strong> the vehicle (2B). For<br />
this reason, we have estimated two models, a separate one for each variant. <strong>The</strong>re is also a<br />
***<br />
***<br />
***<br />
**<br />
*<br />
*<br />
***<br />
***<br />
***<br />
**<br />
***<br />
***<br />
***<br />
***<br />
***<br />
**<br />
**<br />
***<br />
*<br />
*<br />
192
significant difference in acceptance levels between these two variants. When estimating one<br />
model for the whole data set, it appears that the bottleneck charge (2A) is less acceptable than<br />
measure 2B (as suggested by Figure 9.3). This may be due to the considerable costs involved<br />
for peak-hour drivers (48% <strong>of</strong> the respondents who evaluated measure 2A indicated that they<br />
encounter a bottleneck at least once). Table 9.7 presents the estimation results for both<br />
variants. <strong>The</strong>re are similarities but also some differences between the two variants. Both<br />
measures are a kilometre charge, so it is not so surprising that the number <strong>of</strong> kilometres<br />
driven is significantly important, with frequent car users being less supportive. A similar<br />
result is found for the number <strong>of</strong> times that respondents experience congestion. This may be<br />
somewhat surprising because measure 2A affects peak hour drivers relatively more and might<br />
therefore be less acceptable to drivers who experience congestion.<br />
Table 9.7: Results <strong>of</strong> ordered probit analysis with the acceptance <strong>of</strong> measure 2A and 2B as<br />
the dependent variable<br />
Variable Probit ACC measure 2A Sign. Probit ACC measure 2B Sign.<br />
Threshold (μ’s)<br />
μ 1<br />
μ 2<br />
μ 3<br />
μ 4<br />
μ 5<br />
μ 6<br />
Age<br />
Income (inc5 (do not know/won’t say) = base)<br />
Inc1 (< € 28,500)<br />
Inc2 (€ 28,500-45,000)<br />
Inc3 (€ 45,000-68,000)<br />
Inc4 (>€ 68,000)<br />
Number <strong>of</strong> kilometres driven yearly<br />
Vehicle weight (dummy weight3 = base)<br />
Weight1 (low weight)<br />
Weight2 (middle weight)<br />
General effect. (less congestion) (Geff7 = base)<br />
Geff1<br />
Geff2<br />
Geff3<br />
Geff4<br />
Geff5<br />
Geff6<br />
Self-reported behavioural change (dummy = yes)<br />
Employed (dummy = yes)<br />
Residential location (south = base)<br />
Loc1 (3 large cities)<br />
Loc2 (rest west)<br />
Loc3 (north)<br />
Loc4 (east)<br />
Weekly number <strong>of</strong> times in congestion<br />
-4.426 (1.221)<br />
-3.568 (1.216)<br />
-3.071 (1.214)<br />
-2.629 (1.212)<br />
-2.152 (1.210)<br />
-1.091 (1.208)<br />
.004 (.005)<br />
.299 (.334)<br />
.023 (.325)<br />
.134 (.329)<br />
.353 (.354)<br />
-2.34E-05 (.000)<br />
-.687 (.191)<br />
-.428 (.167)<br />
-3.132 (1.113)<br />
-2.663 (1.111)<br />
-2.168 (1.120)<br />
-1.946 (1.126)<br />
-2.003 (1.115)<br />
-1.472 (1.132)<br />
-.158 (.147)<br />
-.275 (.210)<br />
***<br />
***<br />
**<br />
**<br />
*<br />
***<br />
***<br />
***<br />
***<br />
**<br />
*<br />
*<br />
*<br />
-.218 (.889)<br />
.633 (.890)<br />
1.090 (.891)<br />
1.533 (.891)<br />
2.001 (.893)<br />
3.227 (.906)<br />
-.004 (.006)<br />
1.748 (.661)<br />
1.951 (.661)<br />
1.861 (.663)<br />
2.037 (.675)<br />
-9.38E-06 (.000)<br />
.241 (.197)<br />
-.072 (.169)<br />
-.828 (.447)<br />
-.334 (.442)<br />
-.204 (.478)<br />
.287 (.503)<br />
.230 (.522)<br />
0^<br />
-.176 (.155)<br />
-.073 (.215)<br />
-.180 (.233)<br />
-.145 (.202)<br />
.216 (.180)<br />
.310 (.175) *<br />
-.165 (.272)<br />
-.111 (.304)<br />
.005 (.191)<br />
-.066 (.195)<br />
-.049 (.025) ** -.054 (.023) **<br />
N 282 280<br />
Log-likelihood -461.738 -481.436<br />
Pseudo R-square Cox and Snell .333 Cox and Snell .214<br />
Nagelkerke .342 Nagelkerke .219<br />
McFadden .110 McFadden .065<br />
Notes: <strong>The</strong> standard errors are shown in brackets. *, ** and *** denote significance at the 10%, 5% and 1%<br />
level, respectively, (two-sided t-test). ^ Geff7 is for all respondents 0, so for measure 2B Geff6 + Geff7 = base.<br />
It is counterintuitive that the weight <strong>of</strong> the car is important for measure 2A and not for 2B<br />
(differentiated according to weight <strong>of</strong> the vehicle). Measure 2B might have been expected to<br />
be more acceptable to small vehicle owners because <strong>of</strong> the lower charge level, but our results<br />
do not confirm this. <strong>The</strong> allocation <strong>of</strong> revenues differs between the two measures, and the<br />
*<br />
**<br />
***<br />
***<br />
***<br />
***<br />
***<br />
***<br />
*<br />
193
abolition <strong>of</strong> purchase taxation (included in measure 2B) may explain why we do not find this<br />
effect. We do find the opposite effect (more acceptance among heavy vehicle owners) for<br />
measure 2A, similar to what we found for measure 1. <strong>The</strong> explanation may be the same. <strong>The</strong><br />
importance <strong>of</strong> income for measure 2B can be explained by the relatively few respondents <strong>of</strong><br />
the fifth (reference) income category who have a relatively low level <strong>of</strong> acceptance.<br />
Again we see the importance <strong>of</strong> the perceived general effectiveness in terms <strong>of</strong> congestion<br />
(with lower acceptance levels among those who think that the measure will not be very<br />
effective), but only for measure 2A. On average, it would be expected that the bottleneck<br />
measure is more effective in solving congestion than measure 2B. Respondents who do not<br />
believe in the effectiveness <strong>of</strong> measure 2A tend to find the measure less acceptable.<br />
While a bottleneck charge may be more effective, it is not more acceptable. Those who think<br />
that the measure is not effective are also indicating that this measure is not very acceptable;<br />
protest voting may be involved here. Remarkable from the analyses is that policy makers can<br />
not necessarily count on more acceptance among small vehicle owners when considering a<br />
weight-based kilometre charge. <strong>The</strong> type <strong>of</strong> revenue allocation may be <strong>of</strong> crucial importance<br />
here. Again, for both measures here, the importance <strong>of</strong> the group who drives many kilometres<br />
and <strong>of</strong>ten experience congestion is significant.<br />
Measure 3: Peak and <strong>of</strong>f-peak kilometre charge and different revenue allocations<br />
<strong>The</strong> third measure that we have analysed consists <strong>of</strong> 6 sub-measures. <strong>The</strong> charge depends on<br />
time <strong>of</strong> driving, and revenues are allocated to lower income taxes or to abolish fixed <strong>road</strong><br />
taxation. <strong>The</strong> charge levels differ considerably, ranging from an extra peak-period charge <strong>of</strong> 6<br />
€cents per kilometre to one <strong>of</strong> 24 €cents. <strong>The</strong> results in Table 9.8 indicate that, as may be<br />
expected, the lowest charge level is more acceptable than the highest charge level. <strong>The</strong><br />
difference with the 12 €cent level is not significant. <strong>The</strong> impact <strong>of</strong> revenue use is less obvious.<br />
<strong>The</strong> earlier conclusion in Section 9.2.3 and the above measure 1 for this survey that income<br />
tax reductions are less popular is not confirmed here.<br />
<strong>The</strong> weight <strong>of</strong> the vehicle again has an explanatory impact. Effectiveness has only a<br />
significant impact for the group who finds the measure very ineffective: these respondents are<br />
generally more opposed than the rest. <strong>The</strong> financially most-affected respondents, those<br />
experiencing daily congestion, find the measure less acceptable. Employed people, in general,<br />
also tend to find this measure less popular, many <strong>of</strong> them being car commuters. In contrast<br />
with the results from the previous measures, the number <strong>of</strong> kilometres driven has no<br />
explanatory importance. When we test the importance <strong>of</strong> education (replacing income), it<br />
appeared that higher educated people find the measure more acceptable at the 1% significance<br />
level.<br />
This measure is really targeted at reducing congestion with high peak-charge levels.<br />
Acceptance levels are generally lower when charge levels increase. <strong>The</strong> results for this<br />
measure suggest that there may exist some sort <strong>of</strong> a limit after which increasing the charge no<br />
longer matters. <strong>The</strong>re is no significant difference between a peak charge <strong>of</strong> 12 €cents and one<br />
<strong>of</strong> 24 €cents. <strong>The</strong> individuals who potentially benefit most from reduced congestion levels are<br />
again also most opposed, probably because <strong>of</strong> the high financial burden when behaviour is not<br />
changed. Effectiveness therefore seems a crucial point <strong>of</strong> attention in communication when<br />
high (time-differentiated) charge levels are considered. <strong>The</strong> importance <strong>of</strong> revenue allocation<br />
with this type <strong>of</strong> measures seems to decrease.<br />
194
Table 9.8: Results <strong>of</strong> ordered probit analysis with the acceptance <strong>of</strong> measure 3 as the<br />
dependent variable<br />
Variable Probit ACC measure 3 Sign.<br />
Threshold (μ’s)<br />
μ 1<br />
μ 2<br />
μ 3<br />
μ 4<br />
μ 5<br />
μ 6<br />
Age<br />
Income (inc5 (do not know/won’t say) = base)<br />
Inc1 (< € 28,500)<br />
Inc2 (€ 28,500-45,000)<br />
Inc3 (€ 45,000-68,000)<br />
Inc4 (>€ 68,000)<br />
Type <strong>of</strong> measure (charge, dummy 24 €cents = base)<br />
charge 6 €cents<br />
charge 12 €cents<br />
Type <strong>of</strong> measure (revenue use)<br />
Dummy income taxes<br />
Number <strong>of</strong> kilometres driven yearly<br />
Vehicle weight (dummy weight3 = base)<br />
Weight1 (low weight)<br />
Weight2 (middle weight)<br />
General effectiveness (less congestion) (Geff7 = base)<br />
Geff1<br />
Geff2<br />
Geff3<br />
Geff4<br />
Geff5<br />
Geff6<br />
Self-reported behavioural change (dummy = yes)<br />
Employed (dummy = yes)<br />
Residential location (south = base)<br />
Loc1 (3 large cities)<br />
Loc2 (rest west)<br />
Loc3 (north)<br />
Loc4 (east)<br />
Weekly number <strong>of</strong> times in congestion<br />
-1.637 (.529)<br />
-.759 (.527)<br />
-.370 (.527)<br />
.149 (.527)<br />
.805 (.529)<br />
1.618 (.541)<br />
-9.76E-06 (.004)<br />
.154 (.283)<br />
.301 (.280)<br />
.311 (.282)<br />
.376 (.295)<br />
.424 (.113)<br />
.133 (.115)<br />
-.060 (.094)<br />
-4.64E-06 (.000)<br />
-.288 (.136)<br />
-.299 (.118)<br />
-1.444 (.382)<br />
-.589 (.377)<br />
-.389 (.394)<br />
-.044 (.401)<br />
.101 (.387)<br />
.080 (.404)<br />
-.018 (.098)<br />
-.355 (.149)<br />
-.137 (.156)<br />
.042 (.127)<br />
-.039 (.204)<br />
.066 (.137)<br />
-.071 (.017)<br />
***<br />
N 562<br />
Log-likelihood -857.254 ***<br />
Pseudo R-square Cox and Snell .302<br />
Nagelkerke .313<br />
McFadden .106<br />
Notes: <strong>The</strong> standard errors are shown in brackets. *, ** and *** denote significance at the 10%, 5% and 1%<br />
level, respectively, (two-sided t-test).<br />
9.3.4 Effectiveness and acceptance<br />
We not only know the acceptance scores for the three different <strong>road</strong> <strong>pricing</strong> measures<br />
discussed here; from Chapter 5 we also know the effectiveness scores. It is interesting to<br />
compare the measures and find out whether there is a trade-<strong>of</strong>f between effectiveness and<br />
acceptance. Figure 9.4 illustrates the differences in the scores for all 14 different variants.<br />
Effectiveness <strong>of</strong> a measure is here defined as the number <strong>of</strong> trips that will be adjusted for all<br />
travel purposes (as indicated by the respondents) as a percentage <strong>of</strong> the total trips made. <strong>The</strong><br />
acceptance scores are the mean scores that follow from Figure 9.3. Note that we can only<br />
make this comparison for the group <strong>of</strong> car owners, and that effectiveness is the self-reported<br />
effectiveness (and not the perceived level <strong>of</strong> effectiveness).<br />
<strong>The</strong> pattern weakly suggests a trade-<strong>of</strong>f between acceptance and effectiveness. <strong>The</strong> measures<br />
with high charge levels (1F and 3F) have low acceptance scores and rather high effectiveness<br />
levels. <strong>The</strong> opposite holds for measures 1A and 1B. Interesting exceptions are measure 3A<br />
***<br />
***<br />
***<br />
*<br />
**<br />
**<br />
***<br />
**<br />
195
and 2A, both time-differentiated measures with relatively low charge levels. <strong>The</strong>se seem to be<br />
relatively effective and acceptable (although still not ‘very acceptable’).<br />
Effectiveness (% <strong>of</strong> total trips)<br />
20<br />
18<br />
16<br />
14<br />
12<br />
10<br />
8<br />
6<br />
4<br />
2<br />
0<br />
1F<br />
3F<br />
3C<br />
3B<br />
1E<br />
1C<br />
3D<br />
3E<br />
1D<br />
2 2.2 2.4 2.6 2.8 3 3.2 3.4 3.6 3.8 4<br />
3A<br />
Acceptance<br />
Figure 9.4: Effectiveness and acceptance scores for the different variants<br />
9.4 Overview and comparison<br />
After a discussion <strong>of</strong> such a variety <strong>of</strong> measures, it is useful to summarise and compare. We<br />
focus on the differences between the two surveys. <strong>The</strong> first three measures were evaluated by<br />
car commuters experiencing congestion, whereas the latter three measures were assessed by<br />
car owners in general. Besides differences in sample size and type <strong>of</strong> sample, also different<br />
types <strong>of</strong> measures have been evaluated. Moreover, in the ‘car owner’ survey we provided the<br />
respondents with a more refined cost estimation when revenues were used to abolish car<br />
taxation. Table 9.9 shows the most important results for both surveys.<br />
Despite the described differences in surveys, we did find comparable mean scores: most<br />
measures are not very acceptable. Variabilisation in the car commuters survey (measures 3G,<br />
3H, and 3I) seems slightly less unacceptable, which may be explained by the somewhat lower<br />
charge levels compared with all measures in the second survey among car owners. <strong>The</strong><br />
difference in charge levels may also explain why findings <strong>of</strong> the survey among car owners<br />
indicate that car commuters are slightly less positive. Characteristics that apply to this group,<br />
such as the weekly number <strong>of</strong> times in congestion, being employed, and the number <strong>of</strong><br />
kilometres driven, have a significant and negative impact on the level <strong>of</strong> acceptance.<br />
Somewhat higher charge levels weaken the slightly more positive attitude <strong>of</strong> the sample. This<br />
also suggests that the general public, who uses the <strong>road</strong> less <strong>of</strong>ten, seems less opposed.<br />
Both surveys confirm that respondents who indicate that the measure will be effective in<br />
reducing congestion tend to find the measures more acceptable. In contrast, vehicle weight<br />
only matters for car owners, and compensation <strong>of</strong> costs was only significant with commuters<br />
(note that 17.3% <strong>of</strong> the respondents were not employed in the second survey). <strong>The</strong> value <strong>of</strong><br />
time was only available for respondents in the first survey.<br />
2A<br />
2B<br />
1A<br />
1B<br />
196
Table 9.9: Comparison <strong>of</strong> both surveys<br />
Commuters (N=564) Car owners (N=562)<br />
Measures<br />
• Diverse<br />
Kilometre charges combined with<br />
evaluated<br />
• Revenue use included (also<br />
separately)<br />
two types <strong>of</strong> revenue use<br />
Mean acceptance Not very acceptable (‘3’), with<br />
Not very acceptable (‘3’), not much<br />
score<br />
variabilisation more acceptable variation<br />
Statistical<br />
• Charge level and revenue use • Charge level and revenue use<br />
findings<br />
important (abolition <strong>of</strong> transport- somewhat less important<br />
related taxes more acceptable) • General effectiveness positively<br />
• VOT positive impact<br />
related to acceptance<br />
• General effectiveness positively • Vehicle weight relevant<br />
related to acceptance<br />
• Weekly number <strong>of</strong> times in<br />
• Compensation <strong>of</strong> costs relevant congestion and number <strong>of</strong> kms<br />
driven less positive<br />
9.5 Conclusions<br />
Despite the fact that politicians and the public regard transport problems as very urgent and<br />
important, people nevertheless have concerns about <strong>road</strong> <strong>pricing</strong>, resulting in low acceptance<br />
levels. But the literature suggests that there is some level <strong>of</strong> variation in the level <strong>of</strong><br />
acceptance depending on issues such as the type <strong>of</strong> measure proposed and the way in which<br />
revenues are used. In addition, individual aspects such as the perceived (low level <strong>of</strong>)<br />
effectiveness <strong>of</strong> the measure have an impact on acceptance levels, as we observed in the<br />
previous chapter.<br />
In this chapter, we have analysed support levels for different <strong>road</strong> <strong>pricing</strong> measures<br />
(systematically varied over dimensions <strong>of</strong> charge level, differentiation, and revenue use) many<br />
<strong>of</strong> which are seriously considered by Dutch policy makers. We have questioned two different<br />
groups <strong>of</strong> respondents: commuters who regularly experience congestion, and car owners in<br />
general. <strong>The</strong> importance <strong>of</strong> individual characteristics <strong>of</strong> the respondent and the type <strong>of</strong> price<br />
measure for explaining the acceptance levels were tested statistically.<br />
We find (for both surveys) that the implementation <strong>of</strong> <strong>road</strong> <strong>pricing</strong> is generally considered as<br />
‘not very acceptable’. However, the average acceptability <strong>of</strong> quite a few measures considered<br />
is only one point (out <strong>of</strong> 7) below neutral, which is less dramatic than outright disapproval. A<br />
flat kilometre charge (with low charge levels) and revenues used to lower existing car taxation<br />
are most acceptable.<br />
When we look at the impact <strong>of</strong> the structure <strong>of</strong> the measure, we find that charge level and<br />
revenue use matter. Higher charges are generally less acceptable, as may be expected.<br />
Interestingly, it seems that the complexity <strong>of</strong> a measure does not affect the levels <strong>of</strong><br />
acceptance. This suggests that policy makers may consider more differentiated <strong>pricing</strong><br />
schemes instead <strong>of</strong> a rather simple flat fee without losing acceptance. <strong>The</strong> first survey reveals<br />
that <strong>road</strong> <strong>pricing</strong> is more acceptable when revenues are used to decrease fuel taxes or to<br />
abolish existing car taxation; indeed those targets that are in the direct interest <strong>of</strong> the<br />
respondent (car driver). <strong>The</strong> second survey weakly suggests that a decrease <strong>of</strong> existing car<br />
taxes is more acceptable than a decrease in income taxes. <strong>The</strong>se findings on revenue use<br />
targets are largely confirmed when we do not present the type <strong>of</strong> measure, and ask directly<br />
about the acceptance <strong>of</strong> various ways to redistribute the revenues. Dutch car commuters find<br />
it almost acceptable when policy makers decide to use the revenues to compensate the car<br />
drivers by abandoning current car taxation. This option outperforms all other revenue<br />
destinations in terms <strong>of</strong> acceptance. By far the least attractive option is the public treasury.<br />
197
Most <strong>of</strong> our findings for the importance <strong>of</strong> individual characteristics are in line with the<br />
results <strong>of</strong> the previous literature. <strong>The</strong> results <strong>of</strong> the survey among car commuters (where we<br />
included information on the individual’s VOT, value <strong>of</strong> schedule delay and uncertainty) show<br />
that education, the VOT <strong>of</strong> the respondents, and financial compensation (part or full) by the<br />
employer are important explanatory variables. Higher educated people, as well as respondents<br />
with a higher VOT, seem to find <strong>road</strong> <strong>pricing</strong> measures more acceptable than others. <strong>The</strong><br />
same holds for people who receive financial support for their commuting costs. Both surveys<br />
confirm that the perceived effectiveness <strong>of</strong> the measure (in terms <strong>of</strong> less congestion) does<br />
have an important (positive) impact on the support levels. An intelligent communication<br />
strategy explaining aims and intended <strong>effects</strong> is therefore <strong>of</strong> importance. In contrast, we found<br />
no effect between self-reported effectiveness (in terms <strong>of</strong> changing car trips) and support<br />
levels.<br />
<strong>The</strong> difference in results between both surveys seems to be in mobility-related characteristics<br />
<strong>of</strong> the respondent. <strong>The</strong> number <strong>of</strong> kilometres driven and weight <strong>of</strong> the car do not matter when<br />
the sample consists <strong>of</strong> all car commuters. <strong>The</strong>se issues do become relevant, however, when<br />
car owners (including those who use the car less <strong>of</strong>ten) are interviewed. Those affected most<br />
(driving many kilometres, <strong>of</strong>ten experience congestion) tend to find <strong>road</strong> <strong>pricing</strong> less<br />
acceptable. Compensation <strong>of</strong> costs by the employer was only <strong>of</strong> significance in the survey<br />
among car commuters.<br />
It is clear that policy makers will face some level <strong>of</strong> opposition when considering <strong>road</strong> <strong>pricing</strong><br />
for implementation, which makes the job not easy. But the empirical work done in this<br />
chapter suggests that there are important factors that determine the level <strong>of</strong> social<br />
acceptability such as the structure <strong>of</strong> the measure. For instance, there seems to be scope for<br />
variabilisation. But we should not forget that acceptance is only one issue: effectiveness and<br />
equity are also important when <strong>road</strong> <strong>pricing</strong> is considered. We can confirm that acceptable<br />
measures may not always be effective and vice-versa. However, we also find that timedifferentiated<br />
measures, which can be effective (see Chapter 5) and efficient, are not<br />
necessarily less acceptable than other measures.<br />
198
Appendix 9A<br />
Explanation and population share <strong>of</strong> explanatory (dummy)<br />
variables <strong>of</strong> data for survey among car commuters<br />
(N=564)<br />
Variable Type<br />
Levels<br />
Gender Dummy Male (75.2%); Female (24.8%)<br />
Age Dummies Age1: 18-25 (7.3%); Age2: 26-35 (39.7%); Age3:<br />
36-45 (28.2%); Age4: 46-55 (18.1%); Age5: 56+<br />
(6.7%)<br />
Education Dummies Edu1: primary (15.6%); Edu2: junior general<br />
secondary (MAVO) (6.0%); edu3: intermediate<br />
vocational (MBO) (24.8%); edu4: senior general<br />
secondary (HAVO/VWO) (9.4%); edu5: Bachelor<br />
(31.9%); edu6: Master (12.2%)<br />
Income (gross yearly) Continuous<br />
Residential location Dummies Loc1: 3 large cities* (17.9%); loc2: rest west<br />
(33.9); loc3: north (3.7%); loc4: east (23.9); loc5:<br />
south (20.6%)<br />
Family size Dummies Fam1: 1 person (23%); fam2: 2 (31.6%); fam3: 3<br />
(18.3%); fam4: 4 (18.3%); fam5: 5 (7.6%); fam6:<br />
6 (1.2%)<br />
Number <strong>of</strong> children younger than 11 Dummies Childno: 0 (72.5%); childyes: 1 or more (27.5%)<br />
Type <strong>of</strong> measure Dummies Measure 1A to 1D; 2A to 2G (see app. 9b)<br />
Measure 3: charge level Dummies Charge=2.5 €cents; charge=5 €cents; charge=7.5<br />
€cents<br />
Measure 3: revenue use Dummies Revenue use is unclear, revenue use is new <strong>road</strong>s,<br />
revenue use is abandon car taxes<br />
VOT Continuous<br />
Vehicle weight Dummies Weight1: low (< 1000 kg, 22.7%); weight2:<br />
middle class (1000-1250 kg, 67.2%); weight3:<br />
heavy (>1250 kg, 10.1%)<br />
Number <strong>of</strong> kilometres driven yearly Continuous<br />
Compensation <strong>of</strong> costs by employer Dummies Comp1: none (11.9%); comp2: partly (43.8%);<br />
comp3: completely (44.3%)<br />
Travel time with congestion/free flow Continuous<br />
travel time<br />
General effectiveness (will this<br />
measure lead to less congestion)<br />
Personal effectiveness (will this<br />
measure make you drive fewer<br />
kilometres)<br />
* <strong>Amsterdam</strong>, Rotterdam and <strong>The</strong> Hague<br />
Dummies Geff1: very unlikely; geff2: unlikely; geff3: a<br />
little unlikely; geff4: not likely, not unlikely;<br />
geff5: a little likely; geff6: likely; geff7: very<br />
likely<br />
Dummies Peff1: very unlikely, peff2: unlikely, peff3: a little<br />
unlikely, peff4: not likely, not unlikely, peff5: a<br />
little likely, peff6: likely, peff7: very likely<br />
199
Appendix 9B<br />
Description <strong>of</strong> first set <strong>of</strong> measures evaluated by car<br />
commuters<br />
Measure Variants<br />
1. Electronic toll on daily bottlenecks<br />
(independent <strong>of</strong> bad weather); revenues<br />
hypothecated to construct new <strong>road</strong>s and<br />
improve existing <strong>road</strong>s<br />
2. Kilometre charge depending on weight <strong>of</strong> the<br />
car (heavy cars are less environmentally<br />
friendly). Light cars pay 4 €cents per<br />
kilometre; middle weight cars pay 5 €cents per<br />
kilometre; heavy cars pay 6 €cents per<br />
kilometre. Monthly (extra) costs for the various<br />
types <strong>of</strong> cars based on average kilometrage<br />
were presented to respondent.<br />
3. Kilometre charge with different allocations <strong>of</strong><br />
revenues<br />
A) charge <strong>of</strong> € 1.00 at all times<br />
B) charge <strong>of</strong> € 2.00 on working days, during peak hours:<br />
7.00-9.00 and 17.00-19.00, no charge on other times<br />
C) peak-time charge: 6:00- 7:00 € 0.50,<br />
7:00-7:30 € 1.00; 7:30-8:00 € 1.75; 8:00-8:30 € 2.50;<br />
8:30-9:00 € 1.75; 9:00-9:30 € 1.00, 9:30-10:00 € 0.50.<br />
<strong>The</strong> same structure for the evening peak (16.00-20.00)<br />
D) charge depends on traffic density, more congestion<br />
means a higher charge with a maximum <strong>of</strong> € 5,00<br />
A) Revenues hypothecated to general budget <strong>of</strong> the<br />
government<br />
B) Revenues hypothecated to the traffic system in<br />
general, this may include new <strong>road</strong>s or improvement<br />
<strong>of</strong> public transport<br />
C) Revenues used to lower existing car taxes and<br />
improve or construct new <strong>road</strong>s<br />
D) Revenues hypothecated to public transport<br />
E) Revenues used to abolish existing car ownership taxes<br />
F) Revenues used to lower existing fuel taxes<br />
G) Revenues used to improve <strong>road</strong>s and construct new<br />
<strong>road</strong> infrastructure<br />
A) charge <strong>of</strong> 2.5 €cents per kilometre; revenue use<br />
unclear<br />
B) charge <strong>of</strong> 5 €cents per kilometre; revenue use unclear<br />
C) charge <strong>of</strong> 7.5 €cents per kilometre; revenue use<br />
unclear<br />
D) charge <strong>of</strong> 2.5 €cents per kilometre; revenues used for<br />
new and better <strong>road</strong>s<br />
E) charge <strong>of</strong> 5 €cents per kilometre; revenues used for<br />
new and better <strong>road</strong>s<br />
F) charge <strong>of</strong> 7.5 €cents per kilometre; revenues used for<br />
new and better <strong>road</strong>s<br />
G) charge <strong>of</strong> 2.5 €cents per kilometre; revenues used to<br />
abolish existing car taxes (ownership and purchase)<br />
H) charge <strong>of</strong> 5 €cents per kilometre; revenues used to<br />
abolish existing car taxes (ownership and purchase)<br />
I) charge <strong>of</strong> 7,5 €cents per kilometre; revenues used to<br />
abolish existing car taxes (ownership and purchase)<br />
200
Appendix 9C<br />
Percentage <strong>of</strong> respondents ranking measures and revenue<br />
allocations as ‘unacceptable’ or ‘very unacceptable’ (for<br />
both surveys)<br />
Type <strong>of</strong> Measure (commuters<br />
survey)<br />
1A: flat toll throughout the week<br />
1B: coarse toll (no toll outside peak)<br />
1C: multi-step toll during peak hours only<br />
1D: toll depends on actual traffic conditions<br />
2A: km charge/general budget<br />
2B: km charge/traffic system<br />
2C: km charge/car taxation and new <strong>road</strong>s<br />
2D: km charge/public transport<br />
2E: km charge/car ownership taxes<br />
2F: km charge/fuel taxes<br />
2G: km charge/improve and construct <strong>road</strong>s<br />
3A: 2.5 €cents, unclear revenue use<br />
3B: 5 €cents, unclear revenue use<br />
3C: 7.5 €cents, unclear revenue use<br />
3D: 2.5 €cents, improvement <strong>of</strong> <strong>road</strong> network<br />
3E: 5 €cents, improvement <strong>of</strong> <strong>road</strong> network<br />
3F: 7.5 €cents, improvement <strong>of</strong> <strong>road</strong> network<br />
3G: 2.5 €cents, abolish existing car taxation<br />
3H: 5 €cents, abolish existing car taxation<br />
3I: 7.5 €cents, abolish existing car taxation<br />
% <strong>of</strong><br />
respondents<br />
53.6<br />
51.5<br />
52.9<br />
55.9<br />
52.3<br />
50.0<br />
28.6<br />
48.3<br />
35.5<br />
37.2<br />
53.9<br />
59.3<br />
75.0<br />
81.5<br />
55.2<br />
48.6<br />
60.6<br />
13.6<br />
18.0<br />
32.3<br />
Type <strong>of</strong> revenue use % <strong>of</strong><br />
respondents<br />
General budget 74.3<br />
New <strong>road</strong>s<br />
8.6<br />
Improve public 31.0<br />
transport<br />
3.2<br />
Abolish existing car 5.3<br />
taxation<br />
Lower fuel taxes<br />
Lower income taxes<br />
33.5<br />
Type <strong>of</strong> Measure (survey among car owners) % <strong>of</strong> respondents<br />
1A: 3 €cents, car ownership taxes<br />
1B: 6 €cents, ownership and purchase taxes (car taxation)<br />
1C: 12 €cents, car taxation and new <strong>road</strong>s<br />
1D: 3 €cents, income taxes<br />
1E: 6 €cents, income taxes<br />
1F: 12 €cents, income taxes<br />
2A: 2 €cents + multi-step toll, car ownership taxes<br />
2B: weight differentiated charge, car taxation<br />
3A: 2/6 €cents (<strong>of</strong>f-peak/peak), car ownership taxes<br />
3B: 4/12 €cents (<strong>of</strong>f-peak/peak), car taxation<br />
3C: 8/24 €cents (<strong>of</strong>f-peak/peak), car taxation and new <strong>road</strong>s<br />
3D: 2/6 €cents (<strong>of</strong>f-peak/peak), income taxes<br />
3E: 4/12 €cents (<strong>of</strong>f-peak/peak), income taxes<br />
3F: 8/24 €cents (<strong>of</strong>f-peak/peak), income taxes<br />
36,5%<br />
39,4%<br />
58,0%<br />
48,5%<br />
59,3%<br />
71,7%<br />
44,0%<br />
38,6%<br />
49,0%<br />
57,1%<br />
58,8%<br />
53,1%<br />
54,3%<br />
69,3%<br />
201
Appendix 9D<br />
Ordered probit analysis with revenue use only as a<br />
dependent variable<br />
Variable Revenue use: general Revenue use: new<br />
budget <strong>road</strong>s<br />
Threshold (μ’s)<br />
μ1<br />
μ2<br />
μ3<br />
μ4<br />
μ5<br />
μ6<br />
Income (gross yearly) (inc4 = base)<br />
Income 1 (less than €28,500)<br />
Income 2 (€28,500-€45,000)<br />
Income 3 (€45,000-€68,000)<br />
Gender (female)<br />
Loc1<br />
Age (Age 5 (56+) = base)<br />
Age1 (18-25)<br />
Age2 (26-35)<br />
Age3 (36-45)<br />
Age4 (46-55)<br />
Number <strong>of</strong> kilometres driven yearly<br />
Compensation <strong>of</strong> costs by employer<br />
Comp1 (no transport costs paid by employer)<br />
Comp2 (transport costs partly compensated)<br />
Vehicle weight (weight3 = base)<br />
Weight1 (low weight)<br />
Weight2 (middle weight)<br />
VOT<br />
-3.51E-02 (.288)<br />
.728 (.289)<br />
.987 (.290)<br />
1.259 (.292)<br />
1.783 (.299)<br />
2.674 (.351)<br />
6.74E-02 (.151)<br />
4.31E-04 (.143)<br />
-2.07E-02 (.147)<br />
7.94E-02 (.151)<br />
-.136 (.125)<br />
4.65E-02 (.249)<br />
-7.72E-02 (.195)<br />
-.151 (.200)<br />
-4.49E-02 (.210)<br />
-2.67E-02 (.000)<br />
-.447 (.166)<br />
-.203 (.108)<br />
Significance<br />
**<br />
***<br />
***<br />
***<br />
***<br />
***<br />
*<br />
-2.712 (.297)<br />
-2.186 (.283)<br />
-1.784 (.278)<br />
-1.345 (.275)<br />
-.691 (.272)<br />
.492 (.272)<br />
-.451 (.145)<br />
-.360 (.137)<br />
-.265 (.140)<br />
-.137 (.115)<br />
7.236E-03 (.116)<br />
-.490 (.240)<br />
-.275 (.195)<br />
-.324 (.192)<br />
-.407 (.202)<br />
-1.129E-06 (.000)<br />
-.128 (.152)<br />
-.179 (.102)<br />
Significance<br />
***<br />
***<br />
***<br />
***<br />
**<br />
*<br />
***<br />
***<br />
*<br />
**<br />
*<br />
**<br />
*<br />
Revenue use: improve<br />
public transport<br />
-.510 (.268)<br />
.167 (.267)<br />
.406 (.267)<br />
.734 (.268)<br />
1.332 (.270)<br />
2.030 (.276)<br />
8.66E-02 (.142)<br />
1.163E-02 (.134)<br />
.129 (.137)<br />
3.342E-02 (.113)<br />
6.312E-02 (.115)<br />
-.257 (.236)<br />
-7.023E-02 (.184)<br />
-.149 (.188)<br />
-.236 (.197)<br />
1.930E-06 (.000)<br />
-.104 (.151)<br />
-.152 (.100)<br />
Significance<br />
***<br />
***<br />
***<br />
***<br />
**<br />
*<br />
.155 (.195)<br />
-1.984E-02 (.249)<br />
.544 (.180) ***<br />
.168 (.163)<br />
9.005E-02 (.151)<br />
.354 (.180) **<br />
2.20E-02 (.010) ** 9.026E-02 (.009)<br />
2.24E-02 (.009) **<br />
N 564 564 564<br />
Log-likelihood -795.618 ** -899.676 ** -1054.943 **<br />
Pseudo R-square Cox and Snell .035 Cox and Snell .051 Cox and Snell .044<br />
Nagelkerke .037 Nagelkerke .053 Nagelkerke .045<br />
McFadden .012 McFadden .016 McFadden .012<br />
Notes: <strong>The</strong> standard errors are shown in brackets. *, ** and *** denote significance at the 10%, 5% and 1%<br />
level, respectively, (two-sided t-test).<br />
202
Variable<br />
Threshold (μ’s)<br />
μ1<br />
μ2<br />
μ3<br />
μ4<br />
μ5<br />
μ6<br />
Income (gross yearly) (inc4 = base)<br />
Income 1 (less than €28,500)<br />
Income 2 (€28,500-€45,000)<br />
Income 3 (€45,000-€68,000)<br />
Gender (female)<br />
Loc1<br />
Age (Age 5 (56+) = base)<br />
Age1 (18-25)<br />
Age2 (26-35)<br />
Age3 (36-45)<br />
Age4 (46-55)<br />
Number <strong>of</strong> kilometres driven yearly<br />
Compensation <strong>of</strong> costs by employer<br />
Comp1 (no transport costs paid by employer)<br />
Comp2 (transport costs partly compensated)<br />
Vehicle weight (weight3 = base)<br />
Weight1 (low weight)<br />
Weight2 (middle weight)<br />
VOT<br />
Revenue use: abandon existing Revenue use: lower fuel taxes<br />
car taxation<br />
Revenue use: lower income taxes<br />
Significance<br />
Significance<br />
Significance<br />
-2.324 (.317)<br />
-2.233 (.299) *** -.715 (.270) ***<br />
-1.854 (.295) ** -1.771 (.286) *** .169 (.267)<br />
-1.660 (.290) *** -1.487 (.282) *** .468 (.268)<br />
*<br />
-1.154 (.284) *** -1.107 (.279) *** .797 (.268) ***<br />
-.586 (.281) *** -.598 (.277) ** 1.304 (.270) ***<br />
.504 (.281) *** .622 (.277) ** 2.121 (.278) ***<br />
1.21E-02 (.148)<br />
-3.73E-02 (.139)<br />
.180 (.144)<br />
-2.86E-02 (.118)<br />
-7.317E-02 (.120)<br />
-.430 (.246)<br />
-.221 (.194)<br />
-7.54E-02 (.199)<br />
-6.23E-02 (.209)<br />
1.17E-06 (.000)<br />
.411 (.159)<br />
.249 (.105)<br />
-.199 (.187)<br />
-3.52E-02 (.156)<br />
4.85E-03 (.010)<br />
*<br />
***<br />
**<br />
.174 (.146)<br />
.171 (.137)<br />
.297 (.141)<br />
3.323E-02 (.117)<br />
-.242 (.118)<br />
-5.82E-02 (.244)<br />
-4.95E-02 (.191)<br />
-.129 (.195)<br />
2.18E-02 (.205)<br />
-1.43E-06 (.000)<br />
.436 (.158)<br />
.120 (.103)<br />
-.506 (.187)<br />
-.284 (.156)<br />
4.87E-03 (.010)<br />
**<br />
**<br />
***<br />
***<br />
*<br />
.421 (.142)<br />
.225 (.134)<br />
.241 (.137)<br />
6.70E-02 (.113)<br />
-.287 (.115)<br />
.456 (.236)<br />
.449 (.185)<br />
.374 (.189)<br />
7.03E-02 (.198)<br />
-2.660E-06 (.000)<br />
9.84E-02 (.150)<br />
-6.45E-02 (.100)<br />
2.80E-03 (.179)<br />
7.56E-02 (.179)<br />
1.24E-02 (.009)<br />
N 564 564 564<br />
Log-likelihood -777.800 * -830.182 ** -1041.136 ***<br />
Pseudo R-square Cox and Snell .040 Cox and Snell .045 Cox and Snell .062<br />
Nagelkerke .043 Nagelkerke .048 Nagelkerke .063<br />
McFadden .015 McFadden .015 McFadden .017<br />
Notes: <strong>The</strong> standard errors are shown in brackets. *, ** and *** denote significance at the 10%, 5% and 1%<br />
level, respectively, (two-sided t-test).<br />
203<br />
***<br />
*<br />
*<br />
**<br />
*<br />
**<br />
**<br />
*
Appendix 9E<br />
Explanation and population share <strong>of</strong> explanatory (dummy)<br />
variables <strong>of</strong> data set for the survey among car owners<br />
(N=562)<br />
Variable Type<br />
Levels<br />
Age Continuous<br />
Employed Dummy Employed (82.7%); Not employed (17.3%)<br />
Income (gross yearly) Dummies Inc1: less than € 28,500 (21.4%); Inc2: € 28,500-<br />
45,000 (31.5%); Inc3: € 45,000-68,000 (28.5%);<br />
Inc4: more than € 68,000 (15.7%); Inc5: do not<br />
know or won’t say (3.0%)<br />
Residential location (region) Dummies Loc1: 3 large cities* (16.0%); loc2: rest west<br />
(31.9); loc3: north (6.6%); loc4: east (23.1); loc5:<br />
south (22.4%)<br />
Vehicle weight Dummies Weight1: low (1250 kg, 24.6%)<br />
Number <strong>of</strong> kilometres driven yearly Continuous<br />
Weekly number <strong>of</strong> times in<br />
Continuous<br />
congestion<br />
General effectiveness (how probable<br />
is it that this measure lead to less<br />
congestion)<br />
Dummies Geff1: very unlikely (percentages differ<br />
depending on measure); geff2: unlikely; geff3: a<br />
little unlikely; geff4: not likely, not unlikely;<br />
geff5: a little likely; geff6: likely; geff7: very<br />
likely<br />
Type <strong>of</strong> measure (charge) Dummies Dummy charge 3 €cents (measure 1)<br />
Dummy charge 6 €cents (measure 1)<br />
Dummy charge 12 €cents (measure 1)<br />
Dummy charge 6 €cents (measure 3)<br />
Dummy charge 12 €cents (measure 3)<br />
Dummy charge 24 €cents (measure 3)<br />
Type <strong>of</strong> measure (only for measure 2) Dummy Dummy measure 2<br />
Type <strong>of</strong> measure (revenue use) Dummy Dummy <strong>road</strong> taxes (revenues are used to lower existing<br />
<strong>road</strong> taxes (1A, 1B, 3A,3B) and construct new <strong>road</strong>s<br />
(1C and 3C))<br />
Other: income taxes (revenues are used to lower<br />
income taxes, measures 1D to 1F and 3D to 3F)<br />
Self-reported behavioural change Dummy Dummy Change (respondents that indicate to adjust<br />
behaviour for at least one trip purpose, 35.8%), No<br />
change (64.2% indicate they will not change)<br />
* <strong>Amsterdam</strong>, Rotterdam and <strong>The</strong> Hague<br />
204
Appendix 9F<br />
Description <strong>of</strong> second set <strong>of</strong> measures evaluated by car<br />
owners<br />
Measure Variants<br />
1: Flat kilometre charge, with<br />
different revenue allocations<br />
2: Flat kilometre charge, with<br />
additional bottleneck charge<br />
(2A) or differentiated according<br />
to weight <strong>of</strong> the car (2B)<br />
3: Peak and <strong>of</strong>f-peak kilometre<br />
charge and different revenue<br />
allocations<br />
A: 3 €cents, revenues used to abolish car ownership taxes (MRB)<br />
B: 6 €cents, revenues used to abolish existing car taxation (purchase (BPM) and<br />
ownership (MRB))<br />
C: 12 €cents, revenues used to abolish existing car taxation and construct new<br />
<strong>road</strong>s<br />
D: 3 €cents, revenues used to lower income taxes<br />
E: 6 €cents, revenues used to lower income taxes<br />
F: 12 €cents, revenues used to lower income taxes<br />
A: 2 €cents, additional multi-step toll during peak times (morning and evening)<br />
on working days at daily bottlenecks: 6:00-7:00 € 0.50; 7:00-7:30 € 1.00; 7:30-<br />
8:00 € 1.75; 8:00-8:30 € 2.50; 8:30-9:00 € 1.75; 9:00-9:30 € 1.00; 9:30-10:00 €<br />
0.50. <strong>The</strong> same structure for the evening peak (16.00-20.00). Revenues used to<br />
abolish car ownership taxes (MRB)<br />
B: Light cars pay 4 €cents per kilometre; middle-weight cars pay 6 €cents per<br />
kilometre; heavy cars pay 8 €cents per kilometre, revenues used to abolish<br />
existing car taxation (MRB and BPM)<br />
A: 2 €cents outside peak times and 6 €cents in peak on working days (7.00-9.00<br />
and 17.00-19.00), abolition <strong>of</strong> car ownership taxes<br />
B: 4 €cents outside peak times and 12 €cents in peak on working days (7.00-9.00<br />
and 17.00-19.00), abolition <strong>of</strong> existing car taxation<br />
C: 8 €cents outside peak times and 24 €cents in peak on working days (7.00-9.00<br />
and 17.00-19.00), abolition <strong>of</strong> existing car taxation and new <strong>road</strong>s<br />
D: 2 €cents outside peak times and 6 €cents in peak on working days (7.00-9.00<br />
and 17.00-19.00), revenues used to lower income taxes<br />
E: 4 €cents outside peak times and 12 €cents in peak on working days (7.00-9.00<br />
and 17.00-19.00), revenues to lower income taxes<br />
F: 8 €cents outside peak times and 24 €cents in peak on working days (7.00-9.00<br />
and 17.00-19.00), revenues used to lower income taxes<br />
205
Chapter 10<br />
Synthesis<br />
10.1 Overview and conclusions<br />
Road transport is known to generate considerable external costs, in particular in the form <strong>of</strong><br />
congestion, emissions, accidents and noise. Governments may use different types <strong>of</strong> measures<br />
to deal with these problems, <strong>pricing</strong> being one <strong>of</strong> them. Most countries use a number <strong>of</strong> coarse<br />
<strong>pricing</strong> mechanisms, such as fuel duties, registration fees, and parking charges. This current<br />
charging regime is, however, not very efficient. Economists have advocated the use <strong>of</strong> more<br />
targeted <strong>pricing</strong> tools for a long time. Nevertheless, these more efficient <strong>road</strong> <strong>pricing</strong><br />
measures have up till now only seldom been implemented in practice. <strong>The</strong> low level <strong>of</strong><br />
implementation is nowadays caused not so much by technical or administrative problems.<br />
Rather, it is generally acknowledged that <strong>pricing</strong> measures are likely to meet public resistance<br />
and that acceptability is one <strong>of</strong> the major barriers to the successful implementation <strong>of</strong> new and<br />
more efficient <strong>pricing</strong> measures. Policy makers are therefore very much interested in ways to<br />
find <strong>pricing</strong> measures that are both efficient and acceptable at the same time.<br />
This thesis has considered this trade-<strong>of</strong>f by looking at the <strong>effects</strong> <strong>of</strong> a wide range <strong>of</strong> feasible<br />
<strong>road</strong> <strong>pricing</strong> policies. <strong>The</strong> <strong>effects</strong> studied included the behavioural responses, as well as<br />
acceptability issues <strong>of</strong> various <strong>road</strong> <strong>pricing</strong> measures and tax recycling schemes. Also<br />
important for the <strong>effects</strong> <strong>of</strong> the price measures is the institutional organisation. Competition<br />
between (public or private) institutions may have important implications. <strong>The</strong>refore, the<br />
evaluation <strong>of</strong> <strong>road</strong> <strong>pricing</strong> measures carried out in this study has considerable implications for<br />
policy formulation.<br />
In Chapter 1 we explained the aim <strong>of</strong> this study which could be achieved by answering the<br />
three research questions raised:<br />
• What behavioural responses to transport <strong>pricing</strong> can be expected to occur, and what<br />
does this mean for the design <strong>of</strong> first-best and second-best <strong>pricing</strong> schemes?<br />
• What implications can institutional issues have for the design and effectiveness <strong>of</strong> <strong>road</strong><br />
<strong>pricing</strong>? What is the impact <strong>of</strong> regulating private involvement in <strong>road</strong> <strong>pricing</strong> and<br />
investment; and what are the implications <strong>of</strong> different levels <strong>of</strong> government setting<br />
<strong>road</strong> tolls and choosing <strong>road</strong> capacity?<br />
• What factors determine the social acceptability <strong>of</strong> transport <strong>pricing</strong>; what role does the<br />
allocation <strong>of</strong> revenues play here; and what are the most important trade-<strong>of</strong>fs that have<br />
to be made between the efficiency and social acceptability <strong>of</strong> <strong>pricing</strong> schemes and<br />
revenue allocation schemes?<br />
In order to comply with the aim <strong>of</strong> the study and answer these questions it was necessary to<br />
start with the economics <strong>of</strong> transport <strong>pricing</strong> in Chapter 2. <strong>The</strong> theoretical economic<br />
background on transport <strong>pricing</strong> discussed in that chapter was fundamental to understand the<br />
rest <strong>of</strong> this thesis. It appeared that there are many transport <strong>pricing</strong> objectives, but economists<br />
will usually argue that the pursuance <strong>of</strong> economic efficiency should take precedence. Firstbest<br />
prices equate marginal social costs, which will only prevail as a market equilibrium<br />
under certain conditions, i.e. all other markets also have efficient <strong>pricing</strong>, there are no<br />
constraints on transport prices, and market failures are non-existent. However, optimal <strong>pricing</strong><br />
is not very realistic in practice. <strong>The</strong> transport market has some characteristics which make it<br />
very unlikely that the market, without regulation, will set transport prices equal to marginal<br />
social costs. <strong>The</strong>refore, social welfare is not optimised. Governments may want to intervene<br />
and set more efficient prices. This is not straightforward, as the regulator may face several<br />
barriers and constraints (e.g. technical or political in nature) which prevent it from setting<br />
207
optimal prices (e.g. technical or political in nature). Obviously, the regulator then has to resort<br />
to ‘second-best’ <strong>pricing</strong>: setting available prices optimally under the constraints applying.<br />
Nowadays, therefore, the focus is more on the <strong>effects</strong> <strong>of</strong>, more realistic, second-best <strong>pricing</strong>,<br />
as we did in this study. <strong>The</strong> first research question addressed this issue by asking what<br />
behavioural responses can be expected when <strong>road</strong> <strong>pricing</strong> measures are implemented in<br />
practice. An overview <strong>of</strong> the previous literature, discussed in Chapter 3, provided a first<br />
indication <strong>of</strong> possible <strong>effects</strong> and sensitivity. We found that many responses have been<br />
studied, ranging from departure time choice to people’s locational choices. <strong>The</strong> empirical and<br />
theoretical (modelling) literature suggests that <strong>road</strong> <strong>pricing</strong> is in potential very effective, but<br />
much depends on the type <strong>of</strong> price measure. Price sensitivity is also influenced by other<br />
factors, such as the quality and the price <strong>of</strong> alternative modes and destinations, and the type <strong>of</strong><br />
trip and traveller (e.g. business trips are relatively less price elastic than social trips). While<br />
economists (and traffic engineers) might be convinced about the effectiveness <strong>of</strong> <strong>road</strong> <strong>pricing</strong>,<br />
psychologists tend to be more sceptical.<br />
<strong>The</strong> empirical research presented in Chapter 4 confirms the effectiveness <strong>of</strong> <strong>road</strong> <strong>pricing</strong>. Car<br />
commuters are willing to pay to save travel time, and to reduce their uncertainty in this travel<br />
time. We also find that respondents (car owners) prefer car use in the new situation (which<br />
involves paying a charge and/or changed departure times) over the public transport<br />
alternative. <strong>The</strong> significant values we have found for concepts such as the value <strong>of</strong> time, the<br />
value <strong>of</strong> schedule delay early, and the value <strong>of</strong> uncertainty suggests that these values may be<br />
considerable. Commuters seem to be willing to pay about €9 to save one hour <strong>of</strong> travel time.<br />
<strong>The</strong>y attach less value to arriving too early or to uncertain travel times. Another survey,<br />
asking car owners about their likeliness to change behaviour after several <strong>pricing</strong> measures,<br />
suggests that about 10% <strong>of</strong> the trips presently made by car will be adjusted. This level <strong>of</strong><br />
sensitivity, described in Chapter 5, is in line with previous findings. We have also found that<br />
commuting trips are hard to replace. However, people do consider the alternative <strong>of</strong> nonmotorised<br />
transport (in particular for visits) and are likely to change departure time when a<br />
time-differentiated measure is implemented. Car ownership has also been addressed, because<br />
it is not evident from previous research what will happen after variabilisation (replacement <strong>of</strong><br />
existing tax structures that are independent <strong>of</strong> car use with a kilometre charge). We find that<br />
people are not very eager to give up their car. We may conclude from this that changes in<br />
departure time choices are most likely to occur, at least if a time-differentiated measure is<br />
implemented. Route change, mode choice and trip suppression are less popular.<br />
Part II presents a theoretical analysis <strong>of</strong> (second-best) situations where different institutions<br />
are responsible for setting <strong>road</strong> prices. In an efficient world, there needs only to be one<br />
operator who sets optimal tolls on every link <strong>of</strong> the network. But this is not very realistic:<br />
there are, for instance, different levels <strong>of</strong> government that set different prices, and, more<br />
recently, private parties are also receiving attention as possible parties for setting <strong>road</strong> tolls.<br />
Private involvement in <strong>road</strong> construction and <strong>road</strong> tolling may be attractive to governments,<br />
but the literature suggests that some form <strong>of</strong> regulation is recommended to limit welfare<br />
losses from market power abuse. In this connection, first, chapter 6 analysed whether an<br />
auction, where private organisations may bid for <strong>road</strong> construction and operation, might be an<br />
interesting tool for governments when some form <strong>of</strong> control over private <strong>road</strong> operators is<br />
wanted. <strong>The</strong> results show that an auction can indeed be an attractive instrument for<br />
governments, although much depends on the auction rule. It appears that, when capacity and<br />
tolls are chosen freely by the private parties (and they maximise pr<strong>of</strong>its), considerable welfare<br />
losses may result in the setting studied (a two-link network). However, when choosing the<br />
right type <strong>of</strong> regulation in an auction, second-best welfare levels can almost be obtained (but<br />
not without a subsidy).<br />
208
<strong>The</strong> second institutional issue <strong>of</strong> interest focuses on the implications <strong>of</strong> <strong>road</strong> <strong>pricing</strong> when<br />
different levels <strong>of</strong> government are responsible for different policy instruments that affect users<br />
from both jurisdictions, resulting in a variety <strong>of</strong> interaction <strong>effects</strong>. Again, we have included<br />
not only <strong>pricing</strong> as a policy instrument, but also capacity choice. This is studied in Chapter 7.<br />
We find that competition between governments may not be very beneficial to overall welfare<br />
in society compared with one central government. It appears that the tendency <strong>of</strong> tax<br />
exporting is very strong in this setting where commuters have to pay <strong>road</strong> tolls set by the city<br />
government. <strong>The</strong> incentive to set excessive tolls is present in all scenarios where the city has<br />
control over this instrument. We conclude that, although, at first, it may seem attractive to<br />
national governments to deregulate and give powers to lower levels <strong>of</strong> government, since they<br />
know local situations best, the outcomes <strong>of</strong> interaction may not always be desirable when<br />
accounting for policy competition.<br />
Part I and Part II show that <strong>road</strong> <strong>pricing</strong> can be an attractive instrument to policy makers: it<br />
can be effective, and it provides revenues. One important barrier, however, is that <strong>of</strong><br />
acceptability. <strong>The</strong> literature review described in Chapter 8 says that acceptance levels are<br />
generally rather low, but that this can be influenced by the type <strong>of</strong> revenue use. In Chapter 9,<br />
we have verified these results for different <strong>pricing</strong> measures by conducting two empirical<br />
studies: one amongst commuters and one amongst car owners. Our findings are line with the<br />
literature, most measures are generally not very acceptable and revenue use does matter. <strong>The</strong><br />
third research question asks for explanatory factors <strong>of</strong> social acceptance. In this context, the<br />
type <strong>of</strong> measure is important. Kilometre charges with low price levels and tax recycling to<br />
lower (or abolish) existing car taxes are relatively most acceptable. Next, education, followed<br />
by the value <strong>of</strong> time <strong>of</strong> the respondents, the expected effectiveness <strong>of</strong> the measure, and<br />
financial compensation (in part or in full) by the employer are important explanatory<br />
variables. We have paid explicit attention to the role <strong>of</strong> revenue use because <strong>of</strong> its proven<br />
relevance. We find that Dutch car commuters think most positively about the abolition <strong>of</strong><br />
current car taxation. On the other hand, lower fuel taxes and new <strong>road</strong>s are slightly less<br />
acceptable. A reduction in income taxes and the financing <strong>of</strong> the public treasury are generally<br />
not attractive options.<br />
10.2 Policy recommendations<br />
One <strong>of</strong> the main aims <strong>of</strong> this study is to derive policy conclusions for the design and<br />
implementation <strong>of</strong> <strong>road</strong> <strong>pricing</strong> measures. Aggregating our findings we can formulate the<br />
following recommendations that may help to make policy makers less empty-handed when it<br />
comes to the implementation <strong>of</strong> <strong>road</strong> <strong>pricing</strong> in reality.<br />
First, the results from Chapter 4 indicate that the value <strong>of</strong> time for Dutch commuters that<br />
policy makers use nowadays in cost-benefit analysis, is in line with our finding for commuters<br />
who experience congestion. This study has also found considerable monetary values for<br />
scheduling costs and uncertainty, making it worthwhile to consider their inclusion in costbenefit<br />
analysis. However, when scheduling costs are taken into account, it is unnecessary to<br />
include uncertainty, and it is therefore recommended to include only one <strong>of</strong> these concepts.<br />
Variabilisation, the replacement <strong>of</strong> fixed car taxation with a kilometre charge, is currently a<br />
relevant policy in the Netherlands. This measure can be effective for various trip purposes<br />
(with up to 15% <strong>of</strong> the trips adjusted), but much depends on the design <strong>of</strong> the price measure.<br />
Variabilisation with a low flat fee seems not to be very effective in changing car behaviour.<br />
When policy makers want to affect peak-time (commuting) <strong>road</strong> traffic, a time-differentiated<br />
charge seems most appropriate. Nevertheless, governments should be aware that the<br />
implementation <strong>of</strong> these (time-dependent) charges most probably leads to driving at other<br />
times, especially for commuting trips. Although commuting trips are generally insensitive<br />
(working at home or not making the trip are not serious options for most <strong>of</strong> the respondents),<br />
209
there does seem to be some level <strong>of</strong> flexibility which allows scheduling <strong>of</strong> trips. According to<br />
Vickrey’s bottleneck model (1969), such rescheduling <strong>of</strong> trips can greatly contribute to<br />
efficiency, even if total demand remains constant.<br />
When considering implementation <strong>of</strong> <strong>road</strong> <strong>pricing</strong>, policy makers should be aware <strong>of</strong> factors<br />
that possibly affect the effectiveness <strong>of</strong> this measure. Our study among commuters suggests<br />
for instance that compensation by employers affects their behaviour, with those who are fully<br />
compensated willing to pay more to save travel time. Similarly, we found that effectiveness<br />
levels increase when car owners have the possibility to work at home. Road <strong>pricing</strong> as part <strong>of</strong><br />
a wider policy package with supplementary measures (e.g. improving possibilities to work at<br />
home or fiscal disincentives for compensation) may then be interesting to politicians. While<br />
the effectiveness may be enhanced, it is uncertain what happens with efficiency. This needs a<br />
more careful evaluation <strong>of</strong> costs and benefits including for instance the responses <strong>of</strong> firms<br />
(e.g. the response <strong>of</strong> firms to a disincentive <strong>of</strong> cost compensation may lead to compensation<br />
<strong>of</strong> only specific groups <strong>of</strong> employees potentially affecting productivity levels).<br />
Road <strong>pricing</strong> can have considerable consequences for <strong>road</strong> usage, but it may also affect car<br />
ownership (and indirectly also <strong>road</strong> use). <strong>The</strong> <strong>effects</strong> <strong>of</strong> <strong>road</strong> <strong>pricing</strong> and revenue recycling on<br />
the car stock are an as yet unsettled issue, given the mixed results in the literature. Our results<br />
indicate that car ownership will only change in a modest way: not very many people are<br />
willing to give up their car. However, it seems that there are more possibilities to influence<br />
the composition <strong>of</strong> the car stock. <strong>The</strong> weight-differentiated charge has more effect on heavy<br />
vehicle owners, and the results also indicate that respondents seriously consider buying a<br />
smaller (more fuel-efficient) type <strong>of</strong> vehicle.<br />
An important issue for policy makers is the trade-<strong>of</strong>f between effectiveness and acceptance.<br />
More effective <strong>pricing</strong> measures are generally less acceptable to the public. Our findings seem<br />
to confirm this rule, at least for the Dutch situation. For instance, variabilisation with a low<br />
kilometre charge and abolition <strong>of</strong> car taxation is most acceptable. But, at the same time, this<br />
measure appears not to be very effective. A time-differentiated kilometre charge with<br />
revenues used to compensate income taxation is rather effective (in terms <strong>of</strong> trips adjusted).<br />
However, acceptance <strong>of</strong> this measure is generally low (‘not very acceptable’), and tax<br />
recycling to reduce income taxation is relatively unpopular compared with other spending<br />
objectives. An interesting measure for policy makers would, <strong>of</strong> course, score positive on both<br />
aspects. Although still ‘not very acceptable’ overall, a time-differentiated kilometre charge<br />
where revenues are used to abolish car ownership taxation seems to perform relatively best in<br />
this context. This measure is rather effective, can be efficient, and in addition, the type <strong>of</strong><br />
revenue use is relatively acceptable to commuters.<br />
Hence, it is important for policy makers to know that acceptance can be influenced. Revenue<br />
use and price level (although not definitely confirmed) seem to be important, but the level <strong>of</strong><br />
acceptance is also explained by personal factors. Both surveys indicate that the perceived<br />
effectiveness <strong>of</strong> the measure (in terms <strong>of</strong> less congestion) does have a positive impact on the<br />
support levels. This emphasises the relevance <strong>of</strong> an intelligent communication strategy that<br />
explains aims and intended (and expected) <strong>effects</strong>.<br />
<strong>The</strong> involvement <strong>of</strong> private firms in the provision and tolling <strong>of</strong> <strong>road</strong> infrastructure may<br />
nowadays seem realistic and attractive to governments, but is not without risks. We were in<br />
particular concerned with the dilemma caused by the fact that private operators – potentially<br />
bringing efficiency improvements – will be primarily (or exclusively) concerned with pr<strong>of</strong>it<br />
maximisation. Our findings, however, indicate that the associated welfare losses can be<br />
mitigated by optimising the design <strong>of</strong> auctions for the right to privately build and operate a<br />
certain <strong>road</strong>, in terms <strong>of</strong> the criterion or indicator that is used to identify the winning bid. Any<br />
auction – or, indeed, any other selection mechanism – to choose between competing potential<br />
private <strong>road</strong> operators will affect the eventual characteristics <strong>of</strong> the <strong>road</strong> to be built and the<br />
210
tolling scheme to be applied. Auctioning can therefore be a useful tool to policy makers, but<br />
again much depends on the design.<br />
<strong>The</strong> final recommendation follows from our analysis <strong>of</strong> governmental competition. Although<br />
it can be attractive for national governments to deregulate and give powers to lower levels <strong>of</strong><br />
government since they know the local situations best, the outcomes <strong>of</strong> such interaction are not<br />
necessarily desirable. It is shown that overall welfare is not helped very much, and in some<br />
cases can even be lower than without <strong>pricing</strong>. Toll regulation for instance, although not<br />
included in the analysis, should seriously be considered as a tool to control one <strong>of</strong> the<br />
jurisdictions, and to improve overall welfare levels.<br />
10.3 Research agenda<br />
We began our study with the words that there are a great number <strong>of</strong> blind spots in our<br />
knowledge and understanding <strong>of</strong> the optimal design and possible consequences <strong>of</strong> <strong>pricing</strong><br />
policies in transport. We have addressed and analysed some issues, and may thus have<br />
contributed to a better understanding <strong>of</strong> <strong>road</strong> <strong>pricing</strong> policies. However, there still remain<br />
many interesting issues to be solved. In the following, we mention some intriguing issues and<br />
possible future directions <strong>of</strong> research that result from our work.<br />
A first point we want to raise is that, although much <strong>of</strong> the empirical work focuses on the<br />
Dutch situation, most <strong>of</strong> the findings are also relevant to policy makers outside the<br />
Netherlands. However, it is uncertain whether or not these results can be generalised to other<br />
countries. For example, the availability (e.g. <strong>of</strong> public transport) and the inherent popularity<br />
<strong>of</strong> alternatives (e.g. cycling) differs between countries; the spatial structure may be different,<br />
and many other factors may cause further deviations. Although it would be tempting to<br />
present, for example, the conclusion on the importance <strong>of</strong> time differentiation <strong>of</strong> charges for<br />
effectiveness in commuting as a more general result, we cannot draw such conclusions from<br />
our study and therefore leave it as material for further (local) study.<br />
<strong>The</strong> modelling analyses <strong>of</strong> Part II provide useful insights, but we should not forget that these<br />
focus on two specific second-best cases and include various simplifications, which leaves<br />
ample scope for further research. We have indicated the most pressing simplifications.<br />
Candidates for future research include overcoming the static nature <strong>of</strong> the models, and the<br />
issue that competing firms or governments are identical, and – for example – have identical<br />
capacity cost functions. We have also concluded that toll regulation may seriously be<br />
considered as a useful tool to control one <strong>of</strong> the jurisdictions and improve welfare levels. This<br />
is not considered in this thesis and is another issue for further research. One more issue that<br />
seems relevant in this context is empirical research on the welfare <strong>effects</strong> <strong>of</strong> tax competition.<br />
This is only a simple illustrative numerical example, but it remains to be seen whether the<br />
costs <strong>of</strong> non-cooperative behaviour are substantial in other plausible settings.<br />
<strong>The</strong>se modelling studies consider only few out <strong>of</strong> many interesting second-best <strong>road</strong> <strong>pricing</strong><br />
issues. <strong>The</strong> relevance <strong>of</strong> second-best research is clear given the constraints <strong>of</strong> first-best<br />
<strong>pricing</strong>. Existing literature on intersectoral issues shows the importance <strong>of</strong> the relation with<br />
the labour market. A reform in transport <strong>pricing</strong> may therefore have considerable<br />
consequences on the labour market, in particular when revenues are used to reduce<br />
distortionary labour taxes. We have shown that revenues used to reduce income taxes are<br />
more effective than other ways. Road <strong>pricing</strong> and labour tax reduction may be therefore be<br />
interesting to policy makers. However, more information about the size <strong>of</strong> the welfare <strong>effects</strong>,<br />
consequences for the governmental budget, impacts on equity and institutional issues (e.g.<br />
coordination) is needed.<br />
Another interesting issue addressed in this study is the effect <strong>of</strong> variabilisation on car<br />
ownership. <strong>The</strong> impact on car ownership is ambiguous due to the change in costs (lower fixed<br />
costs and higher variable costs). People without a car may decide to purchase one after<br />
211
variabilisation, as cars become cheaper to own. <strong>The</strong>oretically one may expect that this will<br />
lead to an increase in car ownership. However, studies have shown some mixed results on<br />
this. This suggests that it is not completely clear what can be expected; much depends on the<br />
price structure and the type <strong>of</strong> revenue allocation. Variabilisation tends to increase car<br />
ownership, while <strong>road</strong> <strong>pricing</strong> alone seems to have a (mild) limiting effect on the car stock.<br />
We have analysed car ownership, but only for those who already own a car. It would also be<br />
interesting to study behaviour <strong>of</strong> people who do not own a car. <strong>The</strong> decrease in car taxation<br />
may lead to increased car ownership levels, and more kilometres driven. Given the few<br />
studies done, and the uncertainties in effect sizes, there is scope for further research on this<br />
issue.<br />
We find that revenue use for reduced income taxation is more effective in reducing trips,<br />
though less acceptable, than the abolition <strong>of</strong> car taxation, while in both cases the financial<br />
compensation was presented as equal. <strong>The</strong> data do not allow us to identify the reason for this<br />
difference, but we can speculate. One possible explanation is that we could not tell the<br />
respondents how much they would receive due to the reduced labour tax, while we could<br />
make an estimate for the vehicle taxes. If respondents were pessimistic about the net benefit<br />
from reduced labour taxes, a perceived stronger income effect might explain the stronger<br />
effectiveness. But respondents might also have been less rational. Perhaps they work,<br />
implicitly, with predetermined budget allocations over b<strong>road</strong>er groups <strong>of</strong> consumer products.<br />
If so, they may not have realised that they could allocate all benefits from reduced labour<br />
taxes to the mobility budget. This is not a very satisfactory explanation, but we can simply not<br />
exclude the possibility <strong>of</strong> irrational responses from at least some <strong>of</strong> our respondents. Followup<br />
research on this phenomenon might be useful and interesting.<br />
We used a stated preference type <strong>of</strong> approach to determine important transport policy<br />
concepts such as the value <strong>of</strong> time and uncertainty. Stated preference studies like these may<br />
suffer from various biases, e.g. due to the hypothetical nature <strong>of</strong> the alternatives evaluated and<br />
the inclusion <strong>of</strong> concepts such as reliability. <strong>The</strong> derived values provide a useful estimate, but<br />
should be regarded only as an indication. This is particularly true for the value <strong>of</strong> uncertainty.<br />
Depending on the specification and presentation to the respondents, this parameter has<br />
different estimates. Given the importance <strong>of</strong> reliability in recent policy documents, further<br />
advances in studying reliability should have priority. Comparisons with revealed preference<br />
estimates from other countries would also be helpful in this perspective.<br />
212
References<br />
Aarts, H., 1996. Habits and Decision Making: the Case <strong>of</strong> Travel Mode Choice, Nijmegen:<br />
Katholieke <strong>Universiteit</strong> Nijmegen (dissertation).<br />
Aarts, H., B. Verplanken and A. van Knippenberg, 1997, Habit and Information Use in Travel<br />
Mode Choices. Acta Psychologica, 96, pp. 1-14.<br />
Aarts, H. and A. Dijksterhuis, 2000, <strong>The</strong> Automatic Activation <strong>of</strong> Goal-directed Behaviour:<br />
the Case <strong>of</strong> Travel Habit, Journal <strong>of</strong> Environmental Psychology, 20 (1), pp. 75-82.<br />
Ajzen, I., 1991, <strong>The</strong> <strong>The</strong>ory <strong>of</strong> Planned Behavior, Organizational Behavior and Human<br />
Decision Processes, 50, 179-211.<br />
Amelsfort, D. van, 2004, Description <strong>of</strong> choice experiment, internal working document, Delft.<br />
Arnott, R., A. de Palma and R. Lindsey, 1990, Departure Time and Route Choice for the<br />
Morning Commute, Transportation Research B, 24 (3), pp. 209-228.<br />
Arnott, R., A. de Palma and R. Lindsey, 1993, A Structural Model <strong>of</strong> Peak Period Congestion:<br />
a Traffic Bottleneck with Elastic Demand, American Economic Review, 83 (1), pp. 161-179.<br />
Arnott, R., A. de Palma and R. Lindsey, 1998, Recent Developments in the Bottleneck Model,<br />
in: K.J. Button and E.T. Verhoef (eds), Road Pricing Traffic Congestion and the<br />
Environment: Issues <strong>of</strong> Efficiency and Social Feasibility, Cheltenham, Edward Elgar.<br />
Arnott, R. and A. Yan, 2000, <strong>The</strong> Two-mode Problem: Second-best Pricing and Capacity,<br />
Review <strong>of</strong> Urban and Regional Development Studies, 12 (3), pp. 170-199.<br />
Atkinson, A.B. and J.E. Stiglitz, 1980, Lectures on Public Economics, McGraw-Hill, London.<br />
AVV (Adviesdienst Verkeer en Vervoer), 1998, Advies Inzake Reistijdwaardering van<br />
Personen, Rotterdam.<br />
AVV (Adviesdienst Verkeer en Vervoer), 2005, Verkeerskundige Effecten Varianten ‘Anders<br />
Betalen voor Mobiliteit’, Rotterdam.<br />
AVV (Adviesdienst Verkeer en Vervoer), 2006, Value <strong>of</strong> Time Personenvervoer en Value <strong>of</strong><br />
Reliability Personvervoer, http://www.rwsavv.nl/servlet/page?_pageid=116&_dad=portal30&_schema=PORTAL30&p_item_type=the<br />
me&p_theme_name=PERSONENVERVOER, accessed 9th <strong>of</strong> June, 2006.<br />
Bamberg, S., 2002, Effects <strong>of</strong> Implementation Intentions on the Actual Performance <strong>of</strong> New<br />
Environmentally Friendly Behaviours – Results <strong>of</strong> Two Field Experiments. Journal <strong>of</strong><br />
Environmental Psychology, 22 (4), pp. 399-411.<br />
Banister, D., 1994, Equity and Acceptability Question in Internalising the Social Costs <strong>of</strong><br />
Transport, in: OECD/ECMT, Internalising the Social Costs <strong>of</strong> Transport, Paris.<br />
Banister, D., 2003, Critical Pragmatism and Congestion Charging in London, International<br />
Social Science Journal, 55 (2), pp. 249-264.<br />
213
Banister, D., D. Stead, P. Steen, K. Dreborg, J. Akerman, P. Nijkamp, and R. Schleicher-<br />
Tappeser, 2000, European Transport Policy and Sustainable Mobility, Taylor & Francis<br />
Group; Spon Press, London.<br />
Bartley, B., 1995, Traffic demand management options in Europe: the MIRO project, Traffic<br />
Engineering and Control, 95, pp. 596-603.<br />
Bates, J., 2000, History <strong>of</strong> demand modelling, in: D.A. Hensher and K.J. Button (eds),<br />
Handbook <strong>of</strong> Transport Modelling, Pergamon, <strong>Amsterdam</strong>.<br />
Baumol, W.J., 1962, On the theory <strong>of</strong> the expansion <strong>of</strong> the firm, American Economic Review,<br />
52, pp. 1078-1087.<br />
Ben-Akiva, M. and S.R. Lerman, 1987, Discrete Choice Analysis: <strong>The</strong>ory and Application to<br />
Travel Demand, MIT press, Cambridge MA.<br />
Braeutigam, R.R., 1999, Learning about Transport Costs, in: J.A. Gomez-Ibanez, W. B. Tye<br />
and C. Winston (eds), Essays in Transportation Economics and Policy, Brookings Institution<br />
Press, Washington.<br />
Braid, R.M, 1996, Peak Load Pricing <strong>of</strong> a Transportation Route with an Unpriced Substitute,<br />
Journal <strong>of</strong> Urban Economics, 40 (2), pp. 179-197.<br />
Brons, M., 2006, A Meta-Analysis <strong>of</strong> Price Elasticities <strong>of</strong> Gasoline Demand: a System <strong>of</strong><br />
Equations Approach, Tinbergen Institute Discussion Paper, <strong>Amsterdam</strong>.<br />
Button, K., 1993, Transport Economics, Edward Elgar, Aldershot.<br />
Button K. and E.T. Verhoef, 1998, Road Pricing, Traffic Congestion and the Environment,<br />
Edward Elgar, Cheltenham.<br />
CAPRI, 1998, Current Position and Proposed Outline <strong>of</strong> the Concerted Action (Deliverable<br />
1), concerted action on transport <strong>pricing</strong> research integration funded by the European<br />
Commission (DG Transport), Brussels.<br />
Calthrop, E., S. Proost and K. van Dender, 2000, Parking policies and <strong>road</strong> <strong>pricing</strong>, Urban<br />
Studies, 37 (1), pp. 63-76.<br />
Cavalini, P.M., L. Hendrickx and A.J. Rooijers, 1996, Verschillen tussen groepen<br />
automobilisten met betrekking tot hun gevoeligheid voor beleidsmaatregelen. Milieu, 3, pp.<br />
138-147.<br />
CE (Centrum voor Energiebesparing en Schone Technologie), 1999, Efficiente prijzen voor<br />
het verkeer, eindrapportage, Delft.<br />
Chin, A.T.H., 1990, Influences on Commuter Trip Departure Time Decisions in Singapore,<br />
Transportation Research A, 24 (5), pp. 321-333.<br />
Coase, R.H., 1960, <strong>The</strong> Problem <strong>of</strong> Social Cost, Journal <strong>of</strong> Law and Economics, 3, pp. 1-44.<br />
214
CUPID, 2000, State <strong>of</strong> the Art – Frequently Asked Questions, Deliverable 3, Project funded<br />
by the European Commission under the Growth Programme, Brussels.<br />
Daganzo, C., 1982, Equilibrium Model for Carpools on an Urban Network, Transportation<br />
Research Record, 835, pp. 74-79.<br />
Dargay, J.M., 1998, Estimation <strong>of</strong> a Dynamic Car Ownership Model for France Using a<br />
Pseudo-Panel Approach, Transport Studies Unit, University College London.<br />
Dargay, J.M. and D. Gately, 1997, Demand for Transportation Fuels: Imperfect Price-<br />
Reversibility?, Transportation Research B, 31 (1), pp. 71-82.<br />
De Borger, B., 2001, Discrete choice models and optimal two-part tariffs in the presence <strong>of</strong><br />
externalities: optimal taxation <strong>of</strong> cars, Regional Science and Urban Economics, 31, pp.471-<br />
504.<br />
De Borger, B. and S. Proost, 2004, Vertical and Horizontal Competition in Transport, paper<br />
presented at a STELLA meeting, Athens.<br />
De Borger, B., C. Courcelle and D. Swysen, 2004, Optimal Pricing <strong>of</strong> Transport Externalities<br />
in an International Environment: Some Empirical Results Based on a Numerical Optimization<br />
Model, Regional Science and Urban Economics, 34 (2), pp. 163-201.<br />
De Borger, B. and K. van Dender, 2005, Prices, capacities and service quality in a congestible<br />
Bertrand duopoly, paper presented at the ERSA 2005 conference in <strong>Amsterdam</strong>.<br />
De Borger, B. S. Proost, and K. van Dender, 2005, Congestion and Tax Competition in a<br />
Parallel Network, European Economic Review, 49 (8), pp. 2013-2040.<br />
De Jong, G. and H. Gunn, 2001, Recent Evidence on Car Cost and Time Elasticities <strong>of</strong> Travel<br />
Demand in Europe, Journal <strong>of</strong> Transport Economics and Policy, 35 (2), pp. 137-160.<br />
De Jong, G.C., O. Tegge, R. Dohmen, D.F. Ettema, R.N. Hamer, J. Massiani and T. van<br />
Vuren, 1998, Review <strong>of</strong> Existing Evidence on Time and Cost Elasticities <strong>of</strong> Travel Demand<br />
and on Value <strong>of</strong> Travel Time (Deliverable 1), Prepared for the European Commission;<br />
Directorate-General for Transport, <strong>The</strong> Hague.<br />
De Jong, G.C., L. Biggiero, P. Coppola, H. Gunn, R. Dohmen, O. Tegge, A. de Palma, H.<br />
Duchateau, and S. Gayda, 1999, Elasticities Handbook: Elasticities for Prototypical Contexts,<br />
TRACE project (Deliverable 5), research funded by the European Commission (DG<br />
Transport).<br />
De Palma, A. and R. Lindsey, 2000, Private Toll Roads: Competition under Various<br />
Ownership Regimes, <strong>The</strong> Annals <strong>of</strong> Regional Science, 34 (1), pp. 13-35.<br />
Dowrick, S., 1986, Von Stackelberg and Cournot Duopoly: Choosing Roles, <strong>The</strong> RAND<br />
Journal <strong>of</strong> Economics, 17 (2), pp. 251-260.<br />
Dreze, J.H., and N. Stern, 1987, <strong>The</strong> <strong>The</strong>ory <strong>of</strong> Cost Benefit Analysis, in A.J. Auerbach and<br />
M. Feldstein (eds), Handbook <strong>of</strong> Public Economics II, <strong>Amsterdam</strong>, North Holland, pp. 909-<br />
989.<br />
215
Edelson, N.E., 1971, Congestion Tolls under Monopoly, American Economic Review, 61 (5),<br />
pp. 872-882.<br />
Eliasson, J. and L.G. Mattsson, 2001, Transport and Location Effects <strong>of</strong> Road Pricing: a<br />
Simulation Approach, Journal <strong>of</strong> Transport Economics and Policy, 35 (3), pp. 417-456.<br />
Engel, E., R. Fisher, and Galetovic, A., 1996, Highway Franchising: Pitfalls and<br />
Opportunities. American Economic Review, Papers and Proceedings, 87 (2), pp. 68-72.<br />
Espey, M., 1998, Gasoline Demand Revisited: an International Meta-analysis <strong>of</strong> Elasticities,<br />
Energy Economics, 20, pp. 273-295.<br />
European Commission, 1996, Urban Transport, Pricing and Financing <strong>of</strong> Urban Transport<br />
(APAS), DG VII, Transport Research, Brussels.<br />
Eurostat, 2003, Panorama <strong>of</strong> Transport: Statistical Overview <strong>of</strong> Transport in the European<br />
Union (part 2, data 1970-2001), Luxembourg.<br />
Eurostat, 2004, Energy, Transport and Environment Indicators, data 1991-2001, Luxembourg.<br />
Farrell, S., 1999, Financing European Transport Infrastructure, MacMillan Press, London.<br />
Festinger, L., 1954, A <strong>The</strong>ory <strong>of</strong> Social Comparison Processes. Human Relations, 7, pp. 117-<br />
140.<br />
Fisher, G. and S. Babbar, 1996, Private Financing <strong>of</strong> Toll Roads, RMC Discussion paper,<br />
Worldbank, Washington D.C.<br />
Garvill, J., 1999, Choice <strong>of</strong> Transportation Mode: Factors Influencing Drivers' Wilingness to<br />
Reduce Personal Car Use and Support Car Regulations. In: M. Foddy, M. Smithson, S.<br />
Schneider, and M. Hogg (eds), Resolving social dilemmas, Psychology Press, Philadelphia,<br />
pp. 263-279.<br />
Geurs, K.T. and G.P. van Wee, 1997, Effecten van prijsbeleid op verkeer en vervoer, RIVM,<br />
Bilthoven.<br />
Goodwin, P.B., 1992, Review <strong>of</strong> New Demand Elasticities With Special Reference to Short<br />
and Long Run Effects <strong>of</strong> Price Changes, Journal <strong>of</strong> Transport Economics and Policy, 26 (2),<br />
pp. 155-171.<br />
Gomez-Ibanez, J.A., 1999, Pricing, in: J.A. Gomez-Ibanez, W. B. Tye and C. Winston (eds),<br />
Essays in Transportation Economics and Policy, Brookings Institution Press, Washington.<br />
Gomez-Ibanez, J.A. and J.R. Meyer, 1993, Going Private: <strong>The</strong> International Experience with<br />
Transport Privatization. <strong>The</strong> Brookings Institution, Washington D.C.<br />
Goudappel C<strong>of</strong>feng, 1997, Marktpr<strong>of</strong>iel van de filerijder, rapport in opdracht van<br />
Adviesdienst Verkeer en Vervoer, Deventer.<br />
Greene, W. H., 1993, Econometric Analysis, second edition, MacMillan Publishing Company,<br />
New York.<br />
216
Guiliano, G., 1993, An Assessment <strong>of</strong> the Political Acceptability <strong>of</strong> Congestion Pricing,<br />
Transportation, 19 (4), pp. 385-358.<br />
Gunn, H., 2001, Spatial and temporal transferability <strong>of</strong> relationships between travel demand ,<br />
trip cost and travel time, Transportation Research E, 37 (18), pp. 163-198.<br />
Hau, T.D., 1998, Congestion Pricing and Road Investment, in: K.J. Button and E.T. Verhoef<br />
(eds), Road Pricing, Traffic Congestion and the Environment: Issues <strong>of</strong> Efficiency and Social<br />
Feasibility, Edward Elgar, Cheltenham, pp. 39-78.<br />
Henderson, J.V., 1985, Economic <strong>The</strong>ory and the Cities, second edition, Academic Press,<br />
New York.<br />
Hendrickson, C., and E. Plank, 1984, <strong>The</strong> Flexibility <strong>of</strong> Departure Times for<br />
Work Trips, Transportation Research Part A, 18 (1), pp.25-36.<br />
INFRAS, 2000, Variabilisation and Differentiation Strategies in Road Taxation, Report for<br />
the ECMT Group on transport and environment, Zurich.<br />
Jackson, W. B. and J.V. Jucker, 1981, An Empirical Study <strong>of</strong> Travel Time Variability and<br />
Travel Choice Behavior, Transportation Science, 16 (4), pp. 460-475.<br />
Jaensirisak, S., M. Wardman, and A.D. May, 2005, Explaining Variations in Public<br />
Acceptability <strong>of</strong> Road Pricing Schemes, Journal <strong>of</strong> Transport Economics and Policy, 39 (2),<br />
pp. 127-153.<br />
Jakobsson, C., S. Fujii, and T. Gärling, 2002, Effects <strong>of</strong> Economic Disincentives on Private<br />
Car Use, Transportation, 29 (4), pp. 349-370.<br />
Jiang M. and T. Morikawa, 2004, <strong>The</strong>oretical analysis on the variation <strong>of</strong> value <strong>of</strong> travel time<br />
savings, Transportation Research A, 38 (8), pp.551-571.<br />
Johansson, B. and L.G. Mattsson, 1994, From <strong>The</strong>ory and Policy Analysis to the<br />
Implementation <strong>of</strong> Road Pricing: the Stockholm Region in the 1990’s, in: B. Johansson and<br />
L.G. Mattsson (eds), Road Pricing: <strong>The</strong>ory Empirical Assessment and Policy, Kluwer,<br />
Academic Publisher, Boston, pp. 181-204.<br />
Johansson, O. and L. Schipper, 1997, Measuring the Long-run Fuel Demand for Cars, Journal<br />
<strong>of</strong> Transport Economics and Policy, 31 (3), pp. 277-292.<br />
Jones, P., 1998, Urban Road Pricing: Public Acceptability and Barriers to Implementation, in:<br />
K.J. Button and E.T. Verhoef (eds), Road <strong>pricing</strong>, Traffic Congestion and the Environment:<br />
Issues <strong>of</strong> Efficiency and Social Feasibility, Edward Elgar, Cheltenham, pp. 264-283.<br />
Klemperer, P., 2002, What Really Matters in Auction Design, Journal <strong>of</strong> Economic<br />
Perspectives, 16 (1), pp. 169-189.<br />
Lam, T.C., and K.A. Small, 2001, <strong>The</strong> Value <strong>of</strong> Time and Reliability: Measurement from a<br />
Value Pricing Experiment, Transportation Research Part E, 37 (2-3), pp. 231-251.<br />
217
Larsen, O.I. and K. Østmoe, 2001, <strong>The</strong> Experience <strong>of</strong> Urban Toll Cordons in Norway,<br />
Journal <strong>of</strong> Transport Economics and Policy, 35 (3), pp. 457-471.<br />
Levinson, D., 2001, Why States Toll, an Empirical Model <strong>of</strong> Finance Costs, Journal <strong>of</strong><br />
Transport Economics and Policy, 35 (2), pp.223-238.<br />
Lévy-Lambert, H., 1968, Tarification des Services à Qualité Variable: Application aux Péages<br />
de Circulation, Econometrica, 36 (3-4), pp. 564-574.<br />
Linderh<strong>of</strong>, V.G.M., 2001, Household Demand for Energy, Water and the Collection <strong>of</strong> Waste:<br />
a Microeconometric Analysis. University <strong>of</strong> Groningen: Department <strong>of</strong> Economic Sciences<br />
(dissertation).<br />
Lindsey, C.R. and E.T. Verhoef, 2000, Congestion Modeling, in: D.A. Hensher, and K.<br />
Button (eds), Handbook <strong>of</strong> Transport Modelling, Pergamon, <strong>Amsterdam</strong>, pp. 353-373.<br />
Lindsey, C.R. and E.T. Verhoef, 2001, Traffic Congestion and Congestion Pricing, in: K.<br />
Button and D.A. Hensher (eds), Handbook <strong>of</strong> Transport Systems and Traffic Control,<br />
Pergamon, <strong>Amsterdam</strong>.<br />
Liu, L.N. and J.F. McDonald, 1998, Efficient Congestion Tolls in the Presence <strong>of</strong> Unpriced<br />
Congestion: a Peak and Off-peak Simulation Model, Journal <strong>of</strong> Urban Economics, 44 (3), pp.<br />
352-366.<br />
Liu, L.N. and J.F. McDonald, 1999, Economic Efficiency <strong>of</strong> Second-best Congestion Pricing<br />
Schemes in Urban Highway Systems, Transportation Research Part B, 33 (3), pp. 157-188.<br />
Litman, T., 1996, Using Road Pricing Revenue: Economic Efficiency and Equity<br />
Considerations, Transportation Research Record, 1558, pp. 24-28.<br />
Maddala, G.S., 1983, Limited-Dependent and Qualitative Variables in Econometrics,<br />
Cambridge University Press, New York.<br />
Marchand, M., 1968, A Note on Optimal Tolls in an Imperfect Environment, Econometrica,<br />
36 (3-4), pp. 575-581.<br />
Markusen, J. E. Morey, and N. Olewiler, 1995, Competition in Regional Environmental<br />
Policies when Plant Locations are Endogenous, Journal <strong>of</strong> Public Economics, 56 (1), pp. 55-<br />
73.<br />
Mayeres, I., and S. Proost, 1997, Optimal Tax and Investment Rules for Congestion Type <strong>of</strong><br />
Externalities, Scandinavian Journal <strong>of</strong> Economics, 99 (2), pp. 261-279.<br />
Mayeres, I., and S. Proost, 2001, Marginal Tax Reform, Externalities and Income<br />
Distribution, Journal <strong>of</strong> Public Economics, 79 (2), pp. 343-363.<br />
MC-ICAM, 2001, MC-ICAM Approach to Pricing in Transport (Deliverable 1), project<br />
funded by the European Commission under the 5 th Framework program, Brussels.<br />
218
MC-ICAM, 2002, Relevant Optima and Constraints (Deliverable 2), project funded by the<br />
European Commission under the 5 th Framework program, Brussels.<br />
MC-ICAM, 2004, Welfare Effects – Urban Transport (Deliverable 7), project funded by the<br />
European Commission under the 5 th framework RTD program, Brussels.<br />
Mills, D.E., 1981, Ownership Arrangements and Congestion-prone Facilities, American<br />
Economic Review, Papers and Proceedings, 71 (3), pp. 493-502.<br />
Mohring, H., 1970, <strong>The</strong> Peak Load Problem with Increasing Returns and Pricing Constraints,<br />
American Economic Review, 60 (4), pp. 693-705.<br />
Mohring, H and M. Harwitz, 1962, Highway Benefits: An Analytical Framework,<br />
Northwestern University Press, Evanston.<br />
MuConsult, 1998, Variabilisatie van de Autokosten, Eindrapport, Amersfoort.<br />
MuConsult, 2002, Onderzoek naar de Effecten van de Kilometerheffing, concept<br />
Onderzoeksrapport, Amersfoort.<br />
Nash, C., 2001, Equity versus Efficiency in Transport Systems, in: K. Button and D.A.<br />
Hensher (eds), Handbook <strong>of</strong> Transport Systems and Traffic Control, Pergamon, <strong>Amsterdam</strong>.<br />
Nash, C. 2003, Marginal Cost and Other Pricing Principles for User Charging in Transport: a<br />
Comment, Transport Policy, 10, pp 345-348.<br />
NERA, COWI, and BPM, 1998, Infrafin (final report for publication), project funded by the<br />
European Commission under the 4th framework RTD program, Brussels.<br />
Nijkamp, P. and S.A. Rienstra, 1995, Private sector involvement in financing and operating<br />
transport infrastructure, Annals <strong>of</strong> Regional Science, 29, pp. 221-235.<br />
Noland, R. B., and K.A. Small, 1995, Travel Time Uncertainty, Departure Time and the Cost<br />
<strong>of</strong> the Morning Commute, Paper presented to the 74th annual meeting <strong>of</strong> the Transportation<br />
Research Board, Washington, January 1995.<br />
Oates, W.E., 1983, <strong>The</strong> Regulation <strong>of</strong> Externalities: efficient behaviour by sources and<br />
victims, Public Finance, 38, pp. 362-375.<br />
OECD, 2001, Integrating Transport in the City; reconciling the economic, social and<br />
environmental dimensions, Paris.<br />
Olszewski, P. and L. Xie, 2005, Modelling the Effects <strong>of</strong> Road Pricing on Traffic in<br />
Singapore, Transportation Research A, 39 (7-9), pp. 755-772.<br />
Oron, Y., D. Pines and E. Sheshinski, 1973, Optimum vs. Equilibrium Land Use Pattern and<br />
Congestion Tolls, Bell Journal <strong>of</strong> Economics, 4(2), pp. 619-636.<br />
Ortùzar, J. and L.G. Willumsen, 1994, Modelling Transport, John Wiley & Sons, second<br />
edition, Chichester.<br />
219
Oum, T.H. and Y. Zhang, 1990, Airport Pricing: congestion tolls, lumpy investment and cost<br />
recovery, Journal <strong>of</strong> Public Economics, 48, pp.353-374.<br />
Oum, T. H., W.G. Waters II and J.S. Yong, 1992, Concepts <strong>of</strong> Price Elasticities <strong>of</strong> Transport<br />
Demand and Recent Empirical Estimates, Journal <strong>of</strong> Transport Economics and Policy, 26 (2),<br />
pp. 139-154.<br />
Parry, I.W.H. and A. Bento, 1999, Revenue recycling and the welfare <strong>effects</strong> <strong>of</strong> congestion<br />
<strong>pricing</strong>, Resources for the future, Washington, Working Paper.<br />
Parry, I.W.H. and A. Bento, 2001, Revenue Recycling and the Welfare Effects <strong>of</strong> Road<br />
Pricing, Scandinavian Journal <strong>of</strong> Economics, 103 (4), pp. 645-671.<br />
Parry, I.W.H. and A. Bento, 2002, Estimating the Welfare Effect <strong>of</strong> Congestion Taxes: the<br />
Critical Importance <strong>of</strong> other Distortions within the Transport System, Journal <strong>of</strong> Urban<br />
Economics, 51 (2), pp. 339-365.<br />
PATS, 1999, State <strong>of</strong> the Art Synthesis on Price Acceptability (Deliverable 1), project funded<br />
by the European Commission under the 4 th Framework Program, Brussels.<br />
Pigou, A.C., 1920, Wealth and Welfare, Macmillan, London.<br />
PROSAM, 2000, <strong>The</strong> Toll Cordon – Public Attitudes 1989 – 1999, Report 67, Public Roads<br />
Authorities, Oslo.<br />
Proost, S. and K. van Dender, 2001, Methodology and Structure <strong>of</strong> the Model, in: B. de<br />
Borger and S. Proost (eds), Reforming Transport Pricing in the European Union, Edward<br />
Elgar, Cheltenham, pp. 65-92.<br />
Proost, S., K. van Dender, C. Courcelle, B. de Borger, J. Peirson, D. Sharp, R. Vickerman, E.<br />
Gibbons, M. O’Mahony, Q. Heaney, J.C.J.M. van den Bergh and E.T. Verhoef, 2001, How<br />
Large is the Gap Between Present and Efficient Transport Prices in Europe, in: B. de Borger<br />
and S. Proost (eds), Reforming Transport Pricing in the European Union, Edward Elgar,<br />
Cheltenham, pp. 389-412.<br />
Rienstra, S.A. and P. Nijkamp, 1997, Lessons from Private Financing <strong>of</strong> Transport<br />
Infrastructure, Revue Economique, 48 (2), pp. 231-245.<br />
Rienstra, S.A., P. Rietveld and E.T. Verhoef, 1999, <strong>The</strong> social support for policy measures in<br />
passenger transport. A statistical analysis for the Netherlands, Transportation Research D, 4,<br />
pp. 181-200.<br />
Rothengatter, W., 2003, How Good is First-best? Marginal cost and other <strong>pricing</strong> principles<br />
for user charging in transport, Transport Policy, 10, pp. 121-130.<br />
Ruggeri, G., 1999, <strong>The</strong> Marginal Costs <strong>of</strong> Public Funds in Closed and Small Open<br />
Economies, Fiscal Studies, 20 (1), pp. 41-60.<br />
220
Schade, J., 2003, European Research Results on Transport Pricing Acceptability, in: J. Schade<br />
and B. Schlag (eds), Acceptability <strong>of</strong> Transport Pricing Strategies, Elsevier, Oxford, pp. 109-<br />
123.<br />
Schade, J. and B. Schlag, 2000, Acceptability <strong>of</strong> Urban Transport Pricing (AFFORD<br />
publication), VATT research report 72, Helsinki.<br />
Schade, J. and B. Schlag, 2003, Acceptability <strong>of</strong> Urban Transport Pricing Strategies,<br />
Transportation Research Part F, 6 (1), pp. 45-61.<br />
Schwartz, S.H., 1977, Normative Influences on Altruism, In: L. Berkowitz (ed). Advances in<br />
Experimental Social Psychology, Academic Press, San Diego, pp. 221-279.<br />
Shepherd, S. and A. Sumalee, 2004, A Genetic Algorithm Based Approach to Optimal Toll<br />
Level and Location Problems, Networks and Spatial Economics, 4 (2), pp. 161-179.<br />
Simon, H.A., 1959, <strong>The</strong>ories <strong>of</strong> Decision-making in Economics and Behavioural Science,<br />
American Economic Review, 49, pp. 253-283.<br />
Slotegraaf, G., L. Steg and C.A.J. Vlek, 1997, Diepere drijfveren van het autogebruik:<br />
ontwikkeling en toepassing van een projectieve onderzoeksmethode voor het traceren van<br />
affectief-emotionele determinanten van het autogebruik. Rijksuniversiteit Groningen.<br />
Small, K.A., 1982, <strong>The</strong> Scheduling <strong>of</strong> Consumer Activities: Work Trips, American Economic<br />
Review, 72, pp. 467-479.<br />
Small, K.A., 1992, Using the Revenues from Congestion Pricing, Transportation, 19, pp.<br />
359-381.<br />
Small, K.A., 1992, Urban Transportation Economics, Fundamentals <strong>of</strong> pure and applied<br />
economics, Harwood, Chur.<br />
Small, K.A., 1999, Economies <strong>of</strong> Scale and Self-financing Rules with Non-competitive Factor<br />
Markets, Journal <strong>of</strong> Public Economics, 74 (3), pp. 431-450.<br />
Small, K.A. and J.A. Gomez-Ibanez, 1998, Road Pricing for Congestion Management: the<br />
Transition from <strong>The</strong>ory to Policy, in: K.J. Button and E.T. Verhoef (eds), Road Pricing,<br />
Traffic Congestion and the Environment, Edward Eldar, Cheltenham, pp. 213-247.<br />
Small, K.A., C. Winston, and C.A. Evans, 1989, Road Work, <strong>The</strong> Brookings Institute,<br />
Washington D.C.<br />
Small, K.A., R. Noland, X. Chu, and D. Lewis, 1999, Valuation <strong>of</strong> Travel-time Savings and<br />
Predictability in Congested Conditions for Highway User-cost Estimation, Transportation<br />
Research Board, NCHRP Report 431.<br />
Small, K.A., C. Winston, and J. Yan, 2005, Uncovering the Distribution <strong>of</strong> Motorists’<br />
Preference for Travel Time and Reliability, Econometrica, 73 (4), pp. 1367-1383.<br />
Solow, R.M., 1973, Congestion Cost and the Use <strong>of</strong> Land for Streets, Bell Journal <strong>of</strong><br />
Economics, 4(2), pp. 602-618.<br />
221
Solow, R.M. and W.S. Vickrey, 1971, Land Use in a Long Narrow City, Journal <strong>of</strong> Economic<br />
<strong>The</strong>ory, 3(4), pp. 430-447.<br />
Steg, E.M., 1991, Er leiden vele wegen naar Rome. Vermindering van het Autogebruik door<br />
middel van Gedragsbeïnvloeding, Rijksuniversiteit Groningen/ Verkeerskundig studiecentrum<br />
(final thesis), Haren.<br />
Steg, E.M., 1996,. Gedragsverandering ter Vermindering van het Autogebruik,<br />
Rijksuniversiteit Groningen, Faculteit der Psychologische, Sociologische en Pedagogische<br />
Wetenschappen, Groningen (dissertation).<br />
Steg, L, 2003, Factors Influencing the Acceptability and Effectiveness <strong>of</strong> Transport Pricing.<br />
In: J. Schade and B. Schlag (eds), Acceptability <strong>of</strong> Transport Pricing Strategies, Elsevier,<br />
Oxford, pp. 187-202.<br />
Steg, L. and R. Gifford, 2005, Sustainable Transport and Quality <strong>of</strong> Life, Journal <strong>of</strong><br />
Transport Geography, 13 (1), pp. 59-69.<br />
Steg, E.M., C. Vlek, and G. Slotegraaf, 2001, Instrumental-reasoned and Symbolic-affective<br />
Motives for Using a Motor Car, Transportation Research Part F, 4, pp. 151-169.<br />
Sterner, T., C. Dahl, and M. Franzen, 1992, Gasoline Tax Policies, Carbon Emissions and the<br />
Global Environment, Journal <strong>of</strong> Transport Economics and Policy, 26 (2), pp. 109-119.<br />
Stiglitz, J.E. and J. Driffill, 2000, Economics , W.W. Norton & Company, New York<br />
Strotz, R.H., 1964, Urban Transportation Parables, In: J. Margolis (ed), <strong>The</strong> Public Economy<br />
<strong>of</strong> Urban Communities Resources for the Future, John Hopkins University Press, Baltimore,<br />
pp. 127-169.<br />
Sullivan, E.C., 1998, Evaluating the Impacts <strong>of</strong> the SR 91 Variable Toll Lane Facility,<br />
Cal Poly State University, San Luis Obispo.<br />
Sullivan, E.C., 2000, Continuation Study to Evaluate the Impacts <strong>of</strong> the SR 91 Value Priced<br />
Express Lanes, Cal Poly State University, San Luis Obispo<br />
Sullivan, E.C., 2002, Implementing Value Pricing for U.S. Roadways, paper presented at the<br />
IMPRINT workshop Brussels, California Polytechnic State University, San Luis Ibispo.<br />
Tabuchi, T., 1993, Bottleneck Congestion and Modal Split, Journal <strong>of</strong> Urban Economics, 34<br />
(3), pp. 414-431.<br />
TfL (Transport for London), 2004, Impacts Monitoring - Second Annual Report, London.<br />
Tobin, J., 1958, Estimation <strong>of</strong> Relationships for Limited Dependent Variables, Econometrica,<br />
26 (1), pp. 24-36.<br />
TransPrice, 1999, Public Acceptability (Deliverable 6), project funded by the European<br />
Commission under the 4 th Framework program, Brussels.<br />
222
Tsai, J-F, and C-P Chu, 2003, <strong>The</strong> Analysis <strong>of</strong> Regulation on Private Highway Investment<br />
under a Build-Operate-Transfer Scheme, Transportation, 30 (2), pp. 221-243.<br />
Y-Y Tseng, Rietveld P. and E.T. Verhoef, 2005, A Meta-analysis <strong>of</strong> Valuation <strong>of</strong> Travel Time<br />
Reliability, paper presented at Colloquium Vervoersplanologisch Speurwerk, Antwerp 2005.<br />
Ubbels, B., P. Nijkamp, E.T. Verhoef, S. Potter and M. Enoch, 2001, Alternative Ways <strong>of</strong><br />
Funding Public Transport, European Journal <strong>of</strong> Transport and Infrastructure Research, 1 (1),<br />
pp. 73-89.<br />
Ubbels, B., P. Rietveld and P.M. Peeters, 2002, Environmental Effects <strong>of</strong> a Kilometre Charge<br />
in Road Transport: an Investigation for the Netherlands, Transportation Research D, 7 (4),<br />
pp. 255-264.<br />
UNITE, 2003, Final Report for Publication, project funded by the European Commission<br />
under the 5 th framework RTD program, Brussels.<br />
United Nations, 2001, Sustainable Transport Pricing and Charges: Principles and Issues,<br />
Bangkok, New Delhi.<br />
USEPA, 1998, Technical Methods for Analyzing Pricing Measures to Reduce Transportation<br />
Emissions, USEPA Report #231-R-98-006.<br />
Van Dender, K., 1996, A dynamic partial equilibrium model for passenger car transport,<br />
Msc. Paper, KULeuven.<br />
Varian, H.R., 1999, Intermediate Microeconomics: a Modern Approach, W.W. Norton &<br />
Company, New York.<br />
Verhoef, E.T., 1994, Efficiency and Equity in Externalities: a Partial Equilibrium Analysis,<br />
Environment and Planning, 26 (3), pp. 361-382.<br />
Verhoef, E.T., 1996, Economic Efficiency and Social Feasibility in the Regulation <strong>of</strong> Road<br />
Transport Externalities, <strong>The</strong>sis Publishers, <strong>Amsterdam</strong>.<br />
Verhoef, E.T., 2000, <strong>The</strong> Implementation <strong>of</strong> Marginal External Cost Pricing in Road<br />
Transport, Papers in Regional Science, 79 (3), pp. 307-332.<br />
Verhoef, E.T., 2002, Marginal Cost Based Pricing in Transport: Key Implementation Issues<br />
from the Economic Perspective, unpublished paper, <strong>Amsterdam</strong>.<br />
Verhoef, E.T., 2002, Inside the Queue; Hypercongestion and Road Pricing in a Continuous<br />
Time – Continuous Place Model <strong>of</strong> Traffic Congestion, Discussion Paper, Tinbergen<br />
Institute, <strong>Amsterdam</strong>.<br />
Verhoef, E.T., 2003, Phasing and Packaging <strong>of</strong> Pricing Reform: the MC-ICAM approach,<br />
unpublished IMPRINT discussion paper.<br />
Verhoef, E.T., 2005, Second-best Road Pricing Through Highway Franchising, Discussion<br />
paper TI, 2005-082/3, Tinbergen Institute, <strong>Amsterdam</strong>-Rotterdam.<br />
223
Verhoef, E.T. and J. Rouwendal, 2004, A Behavioural Model <strong>of</strong> Traffic Congestion:<br />
endogenizing speed choice, traffic safety and time losses, Journal <strong>of</strong> Urban Economics, 56,<br />
pp. 408-434.<br />
Verhoef, E.T. and K.A. Small, 2004, Product Differentiation on Roads: Constrained<br />
Congestion Pricing with Heterogeneous Users, Journal <strong>of</strong> Transport Economics and Policy,<br />
38(1), pp. 127-156.<br />
Verhoef, E.T., P. Nijkamp and P. Rietveld, 1996, Second-best Congestion Pricing: <strong>The</strong> Case<br />
<strong>of</strong> an Untolled Alternative, Journal <strong>of</strong> Urban Economics, 40 (3), pp. 279-302.<br />
Verhoef, E.T., P. Nijkamp, and P. Rietveld, 1997, <strong>The</strong> Social Feasibility <strong>of</strong> Road Pricing: a<br />
Case Study for the Randstad Area, Journal <strong>of</strong> Transport Economics and Policy, 31 (3), pp.<br />
255-276.<br />
Vickerman, R., 2002, Public and Private Initiatives in Infrastructure Provision, Paper<br />
presented at the Stella Workshop in Brussels (26-27 April).<br />
Vickrey, W.S., 1969, Congestion <strong>The</strong>ory and Transport Investment, American Economic<br />
Review (Papers and Proceedings), 59, pp. 251-260.<br />
Vlek, C., W. Jager and L. Steg, 1997,. Modellen en Strategieën voor Gedragsverandering ter<br />
Beheersing van Collectieve Risico’s. Nederlands Tijdschrift Voor De Psychologie, 52, pp.<br />
174-191.<br />
VTPI, 2002, Transportation Elasticities; how prices and other factors affect travel behaviour,<br />
Victoria Transport Policy Institute, Online TDM Encyclopaedia at<br />
http://www.vtpi.org/tdm/tdm11.htm#_Toc18128471, accessed June 2002.<br />
Wardrop, J., 1952, Some <strong>The</strong>oretical Aspects <strong>of</strong> Road Traffic Research, Proceedings <strong>of</strong> the<br />
Institute <strong>of</strong> civil Engineers, 1, pp. 325-378.<br />
Willig, R., 1976, Consumer’s Surplus without Apology, American Economic Review, 66 (4),<br />
pp. 589-597.<br />
Wilson, P. W., 1989, Scheduling Costs and the Value <strong>of</strong> Travel Time, Urban Studies, 26 (3),<br />
pp. 356-366.<br />
Wilson, J.D., 1999, <strong>The</strong>ories <strong>of</strong> Tax Competition, National Tax Journal, 52 (2), pp. 269-304.<br />
Yang, H. and H.J. Huang, 1999, Carpooling and Congestion Pricing in a Multilane Highway<br />
with High-Occupancy-Vehicle Lanes, Transportation Research A, 33 (2), pp. 139-155.<br />
Yang, H. and Q. Meng, 2000, Highway Pricing and Capacity Choice in a Road Network<br />
under a Build-Operate-Transfer Scheme, Transportation Research Part A, 34 (3), pp. 207-<br />
222.<br />
Yang, H. and Q. Meng, 2002, A note on “highway <strong>pricing</strong> and capacity choice in a <strong>road</strong><br />
network under a build-operate-transfer scheme”, Transportation Research Part A, 36 (7), pp.<br />
659-663.<br />
224
Yang, H. and X. Zhang, 2002, Determination <strong>of</strong> Optimal Toll Levels and Toll Locations <strong>of</strong><br />
Alternative Congestion Pricing schemes, In: M.A.P. Taylor (ed), Proceedings <strong>of</strong> the 15 th<br />
International Symposium on Transportation and Traffic <strong>The</strong>ory, Adelaide, Australia,<br />
Pergamon, pp. 519-540.<br />
225
Nederlandse samenvatting (Summary in Dutch)<br />
Mobiliteit is van essentieel belang voor de hedendaagse samenleving. Het goederenvervoer<br />
zorgt ervoor dat mensen producten kunnen kopen in de winkels. Het personenvervoer stelt<br />
mensen in staat om de dagelijkse activiteiten te ontplooien, zoals naar het werk te gaan <strong>of</strong><br />
winkels en andere sociale <strong>of</strong> recreatieve voorzieningen te bezoeken. De voordelen van een<br />
goed functionerend transportsysteem kunnen uiteenlopend zijn: efficiënte mobiliteit levert een<br />
bijdrage aan economische welvaart, en draagt bij aan een verbeterde concurrentiepositie van<br />
een land <strong>of</strong> regio. De Nederlandse overheid stelt bijvoorbeeld recent dat een goed<br />
functionerend verkeers- en vervoerssysteem en een betrouwbare bereikbaarheid van deur tot<br />
deur essentieel zijn om de economie en internationale concurrentiepositie van Nederland<br />
versterken.<br />
Echter, de toenemende vraag naar mobiliteit zorgt er voor dat een efficiënt functionerend<br />
transportsysteem niet meer vanzelfsprekend is. Er is grote druk op de beschikbare<br />
infrastructuurcapaciteit. De grote vraag naar verplaatsingen op bepaalde plaatsen en<br />
tijdstippen zorgt voor aanzienlijke congestie, hetgeen zich vertaalt in tijdsverliezen voor<br />
zowel personen als bedrijven. Daarnaast zorgt de toename in mobiliteit ook voor andere<br />
problemen. Hierbij valt te denken aan geluidsoverlast van auto’s <strong>of</strong> vliegtuigen, uitstoot van<br />
milieubelastende st<strong>of</strong>fen en de verkeersveiligheid.<br />
Deze problematiek wordt onderkend door beleidsmakers. De schaal van de problemen (lokaal,<br />
regionaal, nationaal, en ook internationaal) zorgt ervoor dat diverse overheden zoeken naar<br />
passende maatregelen om de groeiende overlast van diverse vormen van mobiliteit op te<br />
lossen <strong>of</strong> in ieder geval te beheersen. Afhankelijk van de problematiek die men wil aanpakken<br />
zijn diverse maatregelen denkbaar om in te grijpen op de markt van verkeer en vervoer. Zo<br />
wordt het openbaar vervoer bijvoorbeeld in veel landen gesubsidieerd. Daarnaast bestaat<br />
diverse regelgeving binnen het autoverkeer om de veiligheid te verbeteren, zoals maximum<br />
snelheden. Prijsbeleid is een andere mogelijkheid voor overheidsregulering. Momenteel wordt<br />
prijsbeleid in feite al veelvuldig toegepast, denk bijvoorbeeld aan de belastingen op brandst<strong>of</strong><br />
en op de aankoop <strong>of</strong> het bezitten van een (nieuwe) auto. Recentelijk wordt nagedacht over<br />
verandering van dit belastingstelsel. Andere prijsmaatregelen zouden daarbij mogelijk<br />
effectiever kunnen zijn bij de aanpak van de huidige verkeersproblematiek. Een van de<br />
maatregelen die momenteel in de (politieke) belangstelling staat is de kilometerheffing,<br />
waarbij per gereden kilometer een bepaald bedrag moet worden betaald.<br />
Dit proefschrift stelt prijsbeleid in het autoverkeer centraal. Het onderzoek richt zich op een<br />
drietal belangrijke aspecten van eventueel nieuw in te voeren prijsbeleid. Ten eerste wordt de<br />
mogelijke effectiviteit van diverse vormen van “anders betalen” onderzocht. Mensen kunnen<br />
door de prijsmaatregel hun gedrag veranderen, en bijvoorbeeld ervoor kiezen om niet meer<br />
met de auto te gaan, maar meer met het openbaar vervoer. Onderzoek naar de effectiviteit kan<br />
belangrijke inzichten opleveren voor beleidsmakers omdat bepaalde maatregelen in meer <strong>of</strong><br />
mindere mate gevolgen hebben voor bijvoorbeeld het aantal en de lengte van files.<br />
Effectiviteit van prijsbeleid is slechts één aspect, acceptatie is misschien wel net zo belangrijk<br />
voor een succesvolle invoering. In Nederland herinneren we ons nog de sterke oppositie tegen<br />
Rekeningrijden, waardoor de politiek uiteindelijk af zag van invoering. Dit onderzoek<br />
226
analyseert de mate van acceptatie van verschillende beleidsrelevante vormen van een<br />
kilometerheffing waarbij de effecten van determinanten als type prijsmaatregel, aanwending<br />
van opbrengsten en persoonlijke factoren nadrukkelijk worden onderzocht. Zowel het<br />
effectiviteits- als het acceptatieonderzoek is empirisch, en steunt op resultaten van een tweetal<br />
enquêtes.<br />
Tenslotte wordt door modelstudies aandacht besteed aan een tweetal belangrijke institutionele<br />
aspecten die van belang zijn bij prijsbeleid. Zo bestaat de mogelijkheid voor de overheid om<br />
de private sector te betrekken bij de aanleg en beprijzing van nieuwe wegen. Dit kan voor<br />
beide partijen aantrekkelijk zijn, toch zijn er enkele belangrijke aspecten waar rekening mee<br />
gehouden dient te worden. De eerste analyse bespreekt dit vanuit het perspectief van<br />
veilingontwerp. De andere institutionele analyse richt zich op de concurrentie tussen<br />
overheden. Het kan bijvoorbeeld zo zijn dat een provincie en een gemeente de bevoegdheid<br />
krijgen om prijsbeleid op de door hun beheerde wegen te gaan invoeren. De keuze voor prijs<br />
en capaciteit van de weg kan dan gaan afhangen van gedrag van de andere overheid, en<br />
welvaartseffecten van niet-ingezeten negeren, met verstrekkende gevolgen voor de welvaart.<br />
<strong>The</strong>oretisch kader van prijsbeleid in transport<br />
Op een volledig concurrerende markt wordt de prijs bepaald door vraag en aanbod. Toename<br />
in vraag en/<strong>of</strong> afname van aanbod heeft tot gevolg dat de prijs veelal stijgt. De economische<br />
theorie geeft aan dat op de lange termijn de prijs in een dergelijke markt met volledige<br />
mededinging gelijk is aan de marginale kosten. Wanneer dit voor de gehele economie geldt, is<br />
er sprake van een welvaartsmaximum. Voor het wegverkeer zou dit betekenen dat<br />
bijvoorbeeld elke link van het netwerk optimaal beprijsd dient te zijn. Natuurlijk zijn er<br />
meerdere doeleinden voor prijsbeleid denkbaar (efficiëntie prijzen verschillen van prijzen<br />
gezet door bijvoorbeeld winstmaximaliserende ondernemingen), maar economen leggen<br />
veelal de prioriteit bij efficiëntie.<br />
De transportmarkt functioneert in de praktijk verre van optimaal. De prijs die weggebruikers<br />
betalen is vaak niet gelijk aan de marginale sociale kosten. Zo wordt bijvoorbeeld geen<br />
rekening gehouden met de congestiekosten die een extra kilometer rijden veroorzaken, terwijl<br />
deze wel aanzienlijk kunnen zijn. Daarnaast worden ook de kosten van geluidsoverlast en de<br />
uitstoot van milieubelastende st<strong>of</strong>fen niet correct in rekening gebracht bij de weggebruiker,<br />
waardoor hij <strong>of</strong> zij hier geen rekening mee houdt in de beslissing om de auto te gaan<br />
gebruiken (<strong>of</strong> niet). Naast externe kosten zijn er nog meer redenen, samenhangend met<br />
marktfalen, waardoor de transportmarkt niet efficiënt functioneert. In sommige sectoren is er<br />
bijvoorbeeld slechts één aanbieder van vervoersdiensten die veelal de neiging zal hebben om<br />
inefficiënt hoge (monopolistische) prijzen te zetten.<br />
Marktfalen is een van de belangrijkste economische argumenten voor overheidsingrijpen in<br />
marktprocessen. De congestiekosten kunnen bijvoorbeeld in rekening worden gebracht door<br />
een heffing in te voeren. Om de welvaart te maximaliseren dient de overheid een first-best<br />
heffing in te voeren, waarbij aangetekend dient te worden dat de rest van de economie dan<br />
ook efficiënt zou moeten functioneren. Dit optimale prijsbeleid is echter praktisch minder<br />
relevant, omdat (andere) markten vaak inefficiënt functioneren en overheden vaak tegen<br />
andere beperkingen aanlopen wanneer (optimaal) ingegrepen moet worden. Daarom wordt<br />
tegenwoordig veel onderzoek en aandacht besteed aan meer realistisch ‘second-best’ beleid:<br />
optimaal prijsbeleid onder de geldende (beperkende) omstandigheden. Prijzen zijn dan veelal<br />
wel gebaseerd op marginale kosten, maar niet identiek daaraan. Recent onderzoek heeft<br />
uitgewezen dat welvaartsverliezen van second-best beleid, ten opzichte van de first-best<br />
benchmark, aanzienlijk kunnen zijn.<br />
Effectiviteit<br />
227
Afhankelijk van het type prijsmaatregel kunnen verschillende gedragseffecten optreden. Een<br />
kilometerheffing naar tijd en plaats kan er bijvoorbeeld voor zorgen dat automobilisten hun<br />
vertrektijdstip aanpassen, een andere route kiezen, <strong>of</strong> met de fiets <strong>of</strong> het openbaar vervoer<br />
reizen. Een overzicht van eerder economisch onderzoek naar de effectiviteit van prijsbeleid in<br />
het autoverkeer geeft aan dat de omvang van effecten aanzienlijk kan zijn. Empirisch<br />
onderzoek naar bijvoorbeeld het effect van de brandst<strong>of</strong>prijs <strong>of</strong> parkeertarieven heeft<br />
uitgewezen dat, afhankelijk van het motief van de trip, minder gebruik wordt gemaakt van de<br />
auto en meer van andere modaliteiten. Ook laten praktijkvoorbeelden zoals London en<br />
Singapore zien dat congestieheffingen aanzienlijke gedragseffecten tot gevolg kunnen<br />
hebben. In London is het autoverkeer binnen de centrumzone afgenomen en het gebruik van<br />
het openbaar vervoer toegenomen, terwijl in Singapore (tijdstipafhankelijke heffing) de<br />
vertrektijdstipkeuzes zijn veranderd.<br />
Naast zulke praktijkervaringen wordt ook gebruik gemaakt van modellen om (toekomstige)<br />
effecten van prijsbeleid te voorspellen. Met name in situaties waar nieuwe vormen van<br />
prijsbeleid worden voorgesteld (zoals in Nederland) kan dit zeer inzichtelijk zijn. Uit dit soort<br />
onderzoek is voor bijvoorbeeld Nederland gebleken dat variabilisatie (invoering<br />
kilometerheffing met afschaffing van de huidige wegenbelasting (MRB en BPM)) kan leiden<br />
tot een afname van autogebruik met ongeveer 11% in vergelijking met een toekomstige<br />
situatie zonder verandering. Psychologen zijn over het algemeen minder overtuigd van de<br />
omvang van de effecten prijsbeleid in het autoverkeer. Deze discipline hanteert andere<br />
theoretische concepten en kijkt meer naar individuele kenmerken van reizigers, zoals<br />
motivatie, gewoonten en normen waarbij men dan concludeert dat het autogebruik moeilijker<br />
is te beïnvloeden.<br />
Ho<strong>of</strong>dstuk 4 en 5 presenteren twee verschillende empirische analyses om de effectiviteit van<br />
verschillende vormen van beleidsrelevante prijsmaatregelen in het autoverkeer te onderzoeken<br />
voor de Nederlandse situatie. Hierbij wordt de Stated Preference methode toegepast, waarbij<br />
voor toekomstige situaties naar de gedragsreacties van de respondenten wordt gevraagd. In de<br />
eerste analyse hebben we ons gericht op automobilisten die dagelijks in de file staan. Deze<br />
groep werd gevraagd om een voorkeur uit te spreken voor alternatieven van een verplaatsing,<br />
die verschilden op kenmerken als reistijd, kosten, en onzekerheid. Hieruit bleek dat het woonwerkverkeer<br />
bereid is om geld te betalen voor reistijdwinsten en het verminderen van<br />
onzekerheid. De schatting van de tijdswaardering bedraagt ongeveer €9, waarbij de waarde<br />
van onzekerheid en te vroeg aankomen hieronder ligt en voor te laat arriveren hierboven.<br />
Openbaar vervoer werd niet als alternatief geprefereerd, wat deels kan worden verklaard uit<br />
het feit dat de steekproef alleen huidige auto woon-werkers betr<strong>of</strong>.<br />
In de tweede analyse, beschreven in ho<strong>of</strong>dstuk 5, werd na de beschrijving van de<br />
prijsmaatregel (veelal een vorm van kilometerheffing inclusief uitleg over het gebruik van de<br />
opbrengsten) direct gevraagd naar de gedragsreacties van autobezitters. De uitkomsten<br />
vertonen natuurlijk verschillen naar motief en type prijsmaatregel, maar gemiddeld gaat<br />
ongeveer 10% van het aantal autotrips gewijzigd worden bij invoering van variabilisatie.<br />
Woon-werkverkeer is het minst gevoelig. Veel autobezitters kiezen voor de fiets en lopen<br />
voor sociale verplaatsingen, en het reizen op andere tijdstippen wanneer een<br />
tijdsgedifferentieerde heffing is voorgelegd. Het effect van variabilisatie op autobezit is nog<br />
niet helder op basis van eerdere studies. Onze resultaten geven aan dat autobezitters slechts in<br />
beperkte mate afstand zullen doen van de auto, ook bij hogere kilometerheffingen. Dit,<br />
gecombineerd met het te verwachten effect van de lagere vaste lasten onder niet-autobezitters,<br />
maakt het aannemelijk dat het autobezit in ieder geval niet sterk zal dalen, en waarschijnlijk<br />
zal stijgen.<br />
228
Institutionele aspecten<br />
Efficiënte heffingen zullen – net als externe kosten – continu moeten kunnen variëren over<br />
tenminste de dimensies tijd, plaats en type voertuig, en daarnaast op elk moment over het hele<br />
wegennetwerk moeten gelden. Buiten het feit dat dergelijke heffingen technisch en praktisch<br />
moeilijk realiseerbaar zijn, geeft de laatste toevoeging aan dat het economisch gezien wel<br />
eens beter zou kunnen zijn om een landelijke aanpak te kiezen in vergelijking met selectief op<br />
bepaalde delen van het netwerk prijsbeleid in te voeren. Verschillende factoren kunnen<br />
hiervoor verantwoordelijk zijn; in het navolgende bespreken we enkele belangrijke<br />
aandachtspunten.<br />
Hierbij richten we ons op aandachtspunten die voortkomen uit het onvermijdelijke ‘secondbest’<br />
karakter dat regionaal <strong>of</strong> lokaal prijsbeleid zal hebben. Met ‘second-best’ wordt in de<br />
economische literatuur gedoeld op kenmerken van de beleidsinstrumenten, de institutionele<br />
setting, <strong>of</strong> de feitelijke situatie, die het voeren van theoretisch ‘first-best’ beleid, met<br />
heffingen gelijk aan de marginale externe kosten, <strong>of</strong>wel onmogelijk <strong>of</strong>wel ongewenst maken.<br />
Invoering van regionaal <strong>of</strong> lokaal prijsbeleid, op slechts een bepaald gedeelte van het netwerk<br />
en rekening houdend met de belangen van slechts een deel van de bevolking, is hier een goed<br />
voorbeeld van. Welvaartsverliezen kunnen dan aanzienlijk zijn, afhankelijk van de precieze<br />
vorm van prijsbeleid en netwerkkenmerken. Voor twee specifieke, nieuwe, situaties hebben<br />
wij de welvaartseffecten onderzocht van second-best beleid waarbij prijs en capaciteit beiden<br />
endogeen zijn.<br />
In een denkbeeldige efficiënte wereld is er een wegbeheerder die op elk onderdeel van het<br />
netwerk een efficiënte prijs vraagt. Dit is in de huidige situatie weinig realistisch. Zo zijn de<br />
meeste wegen momenteel ongeprijsd, waardoor aanleg en tolheffing op een nieuwe weg naast<br />
de bestaande weg verschillende implicaties kan hebben. De overheid kan overwegen om een<br />
dergelijke weg privaat aan te laten leggen en te beheren, hetgeen actueel is mede omdat<br />
overheden steeds vaker geconfronteerd worden met beperkte budgetten. Daarnaast wordt vaak<br />
gehoopt dat private aanbieders efficiënter zijn dan publieke. Aangezien een private<br />
onderneming andere doeleinden nastreeft dan een publieke overheid, bestaat echter de kans,<br />
zeker in de transportsector, dat er misbruik wordt gemaakt van een eventuele<br />
monopoliepositie. Een instrument dat de overheid kan inzetten om dit risico te beteugelen is<br />
de organisatie van een veiling. Onze modelanalyse richtte zich op de welvaartsgevolgen van<br />
een veiling van wegaanleg, waarbij de private bieders vrij zijn om capaciteit en prijs<br />
(tolheffing) te kiezen. De uitkomsten van ho<strong>of</strong>dstuk 6 geven aan dat een veiling een<br />
interessant reguleringsinstrument kan zijn voor de overheid. Veel hangt echter af van de<br />
vormgeving van de veiling, met name het maximaliseringsdoel voor private bieders. Het<br />
second-best optimum kan benaderd worden, waarbij wel opgemerkt dient te worden dat een<br />
subsidie waarschijnlijk is als er sprake is van een parallelle weg zonder heffing.<br />
Ho<strong>of</strong>dstuk 7 analyseert de situatie waar verschillende overheden zeggenschap hebben over<br />
verschillende delen van het wegennetwerk en eigen prijs- en capaciteitsbeleid mogen en<br />
kunnen voeren. Dit is in de realiteit niet onwaarschijnlijk en wijkt dus af van het optimale<br />
plaatje waarbij één beheerder alle prijzen bepaalt. Wij hebben ons gericht op de situatie<br />
waarbij een regio één weg beheert, en een andere weg wordt beheerd door een stad, waarbij<br />
inwoners van de regio de stad in gaan om te werken. Omdat beide overheden de welvaart van<br />
de eigen inwoners willen maximaliseren ontstaat beleidsconcurrentie, met negatieve gevolgen<br />
voor de (totale) welvaart. Het blijkt dat de stad de prikkel heeft om het woon-werkverkeer<br />
(inwoners van de regio) extra te belasten en zo de tol op wegen in de stad hoog te zetten<br />
(ondanks het feit dat ook inwoners van de stad deze moeten gebruiken). Deze uitkomsten<br />
geven aan dat deregulering van verantwoordelijkheden naar lagere overheden niet zonder<br />
gevaar is: beleidsconcurrentie kan onder bepaalde omstandigheden belangrijke gevolgen<br />
hebben voor de welvaart.<br />
229
Acceptatie<br />
Prijsbeleid in het autoverkeer is een interessant beleidsinstrument: het kan effectief en<br />
efficiënt zijn, zoals uit het voorgaande is gebleken, en bovendien levert het opbrengsten op.<br />
Toch is er een belangrijke factor van sterke invloed op het gehele proces van invoering van<br />
een prijsinstrument, dat in een aantal gevallen zelfs leidt tot afschaffing: acceptatie.<br />
Onderzoek, besproken in ho<strong>of</strong>dstuk 8, heeft aangetoond dat nieuwe vormen van prijsbeleid in<br />
het wegverkeer niet acceptabel worden gevonden. Dit wordt onder meer veroorzaakt door het<br />
feit dat men denkt dat de maatregel niet effectief zal zijn (men verwacht bijvoorbeeld dat de<br />
files niet zullen verminderen door prijsmaatregelen). Ook ziet men weginfrastructuur als een<br />
publiek goed waar niet voor betaald zou moeten worden en wordt er getwijfeld aan de<br />
betrouwbaarheid van het systeem. Onderzoek heeft verder uitgewezen dat de mate van<br />
acceptatie nogal kan variëren, waarbij verschillende verklarende factoren een rol spelen. Zo is<br />
de hoogte van de heffing van belang: hoe hoger de heffing, des te minder acceptabel.<br />
Daarnaast is ook de besteding van de opbrengsten relevant. Wanneer heffingsgelden worden<br />
aangewend binnen de vervoerssector (bijvoorbeeld verbetering van het openbaar vervoer) is<br />
hier over het algemeen meer steun voor dan voor aanwending buiten het vervoer, terwijl de<br />
steun verder toeneemt als het aan automobilisten ten goede komt. Belangrijk in dit geval is op<br />
te merken dat de besteding van de opbrengsten ook relevant is voor de efficiëntie van de<br />
maatregel. Zo kunnen de welvaartsbaten van prijsbeleid verder worden vergroot wanneer<br />
bestaande verstorende belastingen (op de arbeidsmarkt bijvoorbeeld) door de<br />
heffingsopbrengst kunnen worden verlaagd. Ondanks de relatief hoge mate van acceptatie, is<br />
investeren in inefficiënt openbaar vervoer vanuit welvaartsperspectief volgens sommige<br />
studies minder aan te bevelen. Tenslotte blijkt uit de praktijk dat goede communicatie en<br />
uitleg van de maatregel (inclusief doeleinden) de mate van acceptatie kan verhogen.<br />
Ho<strong>of</strong>dstuk 9 presenteert empirisch onderzoek naar de mate van acceptatie van verschillende<br />
vormen van een kilometerheffing, en probeert deze ook te verklaren. Het onderzoek vond<br />
plaats onder filerijders en, meer algemeen, onder autobezitters. Voor beide groepen kunnen<br />
we concluderen dat de voorgestelde (beleidsrelevante) prijsmaatregelen (inclusief uitleg van<br />
gebruik van opbrengsten) ‘niet erg acceptabel’ worden gevonden. Toch blijkt er nog wel wat<br />
variatie in de antwoorden te zitten, met name onder de groep filerijders. Daar blijkt een lage<br />
kilometerheffing met een verlaging <strong>of</strong> afschaffing van de huidige bestaande autobelastingen<br />
(variabilisatie) een stuk minder onacceptabel te zijn. Het gebruik van de opbrengsten is ook<br />
hier bepalend voor de mate van acceptatie. Een verlaging <strong>of</strong> afschaffing van de huidige<br />
autobelastingen kan zowel als onderdeel van de prijsmaatregel, als wanneer we er apart naar<br />
vragen op de meeste steun rekenen. Een verlaging van de inkomstenbelasting en het<br />
overheidsbudget in het algemeen (‘de schatkist’) zijn voor veel respondenten een stuk minder<br />
acceptabel als aanwendingsdoel. Bepaalde individuele kenmerken blijken ook van invloed te<br />
zijn op de mate van steun. De tijdswaardering, bekend voor de filerijders, is bijvoorbeeld van<br />
significant belang. Zoals verwacht vinden filerijders met een hogere tijdswaardering een<br />
maatregel meer acceptabel. Dit geldt ook voor mensen die verwachten dat de maatregel<br />
effectief zal zijn in het verminderen van de filedruk. Voor beide groepen respondenten bleek<br />
dat een hogere mate van verwachte effectiviteit samenhangt met meer acceptatie. Hoewel de<br />
gemiddelde acceptatie scores voor beide groepen niet veel verschillend waren, blijkt voor de<br />
autobezitters wel te gelden dat mensen die relatief veel kilometers maken en vaak met files te<br />
maken hebben, minder positief tegenover de voorgestelde prijsmaatregelen staan.<br />
Beleidsconclusies en verder onderzoek<br />
Beleidsmakers in Nederland kiezen nog altijd niet voor prijsmaatregelen wanneer het gaat om<br />
de aanpak van files. Huidig prijsbeleid richt zich met name op het bezit van het voertuig en<br />
230
niet zozeer op het gebruik (afgezien van de brandst<strong>of</strong>accijns). En dat terwijl congestie toch<br />
een fenomeen is dat voornamelijk veroorzaakt wordt door intensief weggebruik op bepaalde<br />
plaatsen en tijdstippen. Toch wordt veelal gekozen voor andere maatregelen, zoals extra<br />
infrastructuur <strong>of</strong> toeritdosering. De groeiende filedruk heeft er echter toe geleid dat<br />
beleidsmakers steeds meer geïnteresseerd raken in andere maatregelen die mogelijk meer<br />
effect hebben.<br />
Een van deze mogelijkheden, ondersteund door de verbeterde stand van de technologie, en al<br />
jaren bepleit door economen, is meer toegespitst prijsbeleid. Dit onderzoek wijst uit dat een<br />
differentiatie naar tijd inderdaad belangrijk is voor de effectiviteit van de heffing om de<br />
filedruk te verminderen. Een kilometerheffing met verhoogde prijzen in de spits geeft<br />
aanleiding voor het woon-werkverkeer om op andere tijdstippen te gaan reizen. Eerder<br />
economisch onderzoek heeft uitgewezen dat dergelijke gedragsveranderingen zeer efficiënt<br />
kunnen zijn. Echter, invoering van een vlakke kilometerheffing (en afschaffing van de<br />
wegenbelasting) heeft aanzienlijk minder effect op de autoverplaatsingen. Dit heeft alleen een<br />
bescheiden effect op verplaatsingen met een ander motief (winkelen, visite), die eenvoudiger<br />
vervangen kunnen worden door bijvoorbeeld gebruik van de fiets (veelal korte ritten).<br />
Wanneer beleidsmakers dus iets aan de files willen doen en variabilisatie met invoering van<br />
een kilometerheffing overwegen, ligt een differentiatie naar tijd en plaats voor de hand. De<br />
effecten op het autobezit van variabilisatie zijn minder eenduidig en verdienen nader<br />
onderzoek, met name onder die groep die momenteel nog geen auto bezitten en door een<br />
verlaging van de vaste kosten eventueel kunnen overgaan tot aankoop.<br />
Tevens geven onze resultaten aan dat Nederlandse filerijders bereid zijn om te betalen voor<br />
reistijdwinsten. Deze waarde komt redelijk overeen met de waarde voor woon-werkverkeer<br />
die momenteel gehanteerd wordt bij kosten-baten studies voor nieuwe weginfrastructuur. Ook<br />
onzekerheid en te vroeg <strong>of</strong> te laat arriveren zijn gewaardeerd in deze studie. Deze kosten<br />
kunnen aanzienlijk zijn en er dient overwogen te worden om bij dergelijke evaluaties ook<br />
eventuele baten van verminderde onzekerheid, <strong>of</strong> van te vroeg <strong>of</strong> te laat op het werk komen<br />
mee te nemen. Beiden meenemen is alleen aan te raden als gecorrigeerd wordt voor<br />
dubbeltellingen.<br />
De resultaten geven aan dat effectiviteit en acceptatie van de onderzochte prijsmaatregelen<br />
maar moeizaam samen gaan. Effectievere maatregelen (in termen van aantallen aangepaste<br />
trips) zijn in de regel in sterkere mate onacceptabel. De meest interessante maatregelen<br />
(relatief effectief en niet al te onacceptabel) zijn tijdsgedifferentieerd, met relatief lage<br />
heffingshoogten, waarbij de opbrengsten gebruikt worden om de huidge wegenbelasting af te<br />
schaffen. Daarentegen scoort een vlakke kilometerheffing beter op acceptatie, maar minder op<br />
effectiviteit. Het is uiteindelijk natuurlijk aan de politiek om hier een keuze tussen te maken.<br />
Wel benadrukt dit onderzoek nog maar eens de noodzaak om goed na te denken over de<br />
aanwending van de opbrengsten, en dit, samen met de doelstelling van de maatregel en de te<br />
verwachte effectiviteit, goed te communiceren naar het publiek. Ook de rol van de media, en<br />
andere institutionele partijen moet hierbij niet onderschat worden.<br />
De beleidsdiscussie over anders betalen voor mobiliteit wordt in Nederland altijd op landelijk<br />
niveau gevoerd: het initiatief ligt bij de nationale overheid en alle Nederlandse automobilisten<br />
zouden een heffing per gereden kilometer gaan betalen. Toch hebben veel van de eerder<br />
genoemde problemen een sterk lokaal <strong>of</strong> regionaal karakter. Het zijn dan ook vaak regionale<br />
partijen die aandacht vragen voor verkeersproblemen en aandringen op invoeren van<br />
prijsbeleid. Het kan dan ook interessant zijn om na te denken over de mogelijkheden van<br />
prijszetting door regionale <strong>of</strong> lokale overheden. Het zal tenslotte vaak zo zijn dat<br />
(samenwerkingsverbanden van) lokale instituties meer inzicht hebben in de lokale problemen<br />
en zodoende beter weten wat er leeft. Daarnaast zijn vrijwel alle geslaagde voorbeelden van<br />
prijsbeleid gerealiseerd in een lokale context; denk aan Singapore, Londen, Amerikaanse<br />
231
etaalstroken en tolwegen, Noorse tolringen, enzovoort. Onze analyse met behulp van een<br />
klein netwerkmodel geeft aan dat bij lokale initiatieven serieus met beleidsconcurrentie<br />
rekening moet worden gehouden, dit komt de welvaart op nationaal niveau doorgaans niet ten<br />
goede. Ook zijn er diverse praktische en juridische aspecten aan te wijzen die regionaal beleid<br />
op dit terrein niet eenvoudig maken, en zeker in een klein land als Nederland is het daarom<br />
misschien beter om als overheid de pijlen op een nationaal systeem te richten. Voordat<br />
regionalisering van prijsbeleid als een serieuze optie kan worden gezien zijn er in ieder geval<br />
nog wel enkele empirische en theoretische vragen te bedenken die solide beantwoording<br />
verdienen. Denk hierbij aan voorwaarden die door een nationale overheid moeten worden<br />
gezet om negatieve welvaartseffecten door beleidsconcurrentie te minimaliseren.<br />
Tot slot nog een aantal andere overwegingen die aanleiding kunnen vormen voor interessant<br />
verder onderzoek. In de eerste plaats is ons onderzoek ook relevant voor beleidsmakers in het<br />
buitenland. Toch heeft een grote mate van het (empirische) onderzoek betrekking op de<br />
Nederlandse situatie wat eventuele generalisatie lastig maakt. De beschikbaarheid en<br />
populariteit van alternatieven (fiets) verschilt bijvoorbeeld per land. Dit is dan ook iets wat<br />
verder (lokaal) onderzocht dient te worden. Ten tweede hebben we bij onze analyses gekozen<br />
voor een bepaalde aanpak die soms beperkingen met zich meebrengt. Zo zijn bijvoorbeeld<br />
voor de institutionele aspecten relatief eenvoudige netwerkmodellen toegepast met<br />
beperkende aannames. Verandering van aannames (geen competitieve veilingen bijvoorbeeld)<br />
en modelstructuur (dynamisch, grotere netwerken) zijn interessante mogelijkheden voor<br />
toekomstig onderzoek. Daarnaast gebruiken we bij het empirische onderzoek de Stated<br />
Prefence aanpak omdat de voorgestelde prijsmaatregelen nog niet in de praktijk zijn toegepast<br />
in Nederland. Gezien de hypothetische aard van de maatregelen en voorgestelde alternatieven<br />
zijn er nogal wat onzekerheden. We hebben getracht om een zo goed mogelijke uitleg te<br />
geven van de voorgestelde maatregelen met eventuele financiële consequenties om deze<br />
onzekerheid te minimaliseren. Toch verdient een concept als onzekerheid, mede gezien de<br />
toenemende beleidsimportantie, nog nadere studie omdat verschillende benaderingen<br />
mogelijk zijn welke niet allemaal eenduidig zijn. Lopend experimenteel onderzoek richt zich<br />
juist op het combineren van Revealed en Stated Preference technieken bij het bepalen van<br />
effecten van prijsbeleid.<br />
232