

Financial Stability Report - Financial Risk and Stability Network
Financial Stability Report - Financial Risk and Stability Network
Financial Stability Report - Financial Risk and Stability Network

You also want an ePaper? Increase the reach of your titles
YUMPU automatically turns print PDFs into web optimized ePapers that Google loves.
34<br />
3.5 BANKS’ CAPITAL AND PROFITABILITY<br />
Banks’ capital position<br />
strengthens further<br />
In the second half of 2012 the fourteen main listed banking groups continued to<br />
strengthen their capital positions. e improvement, although small, was due to<br />
their risk-weighted assets contracting more than their capital. eir highest quality<br />
capital was adversely aected by the losses recorded in the period. e reduction in risk-weighted assets<br />
stemmed partly from the banking groups’ portfolio rebalancing in favour of assets attracting lower<br />
capital charges. Some of the largest groups also completed the switch to internal models for the<br />
calculation of capital charges or exp<strong>and</strong>ed the scope of their application, thus completing a process<br />
initiated some time ago <strong>and</strong> monitored by the Bank of Italy.<br />
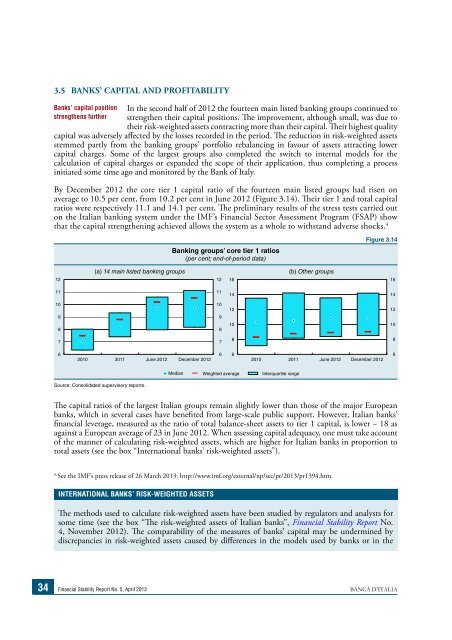
By December 2012 the core tier 1 capital ratio of the fourteen main listed groups had risen on<br />
average to 10.5 per cent, from 10.2 per cent in June 2012 (Figure 3.14). eir tier 1 <strong>and</strong> total capital<br />
ratios were respectively 11.1 <strong>and</strong> 14.1 per cent. e preliminary results of the stress tests carried out<br />
on the Italian banking system under the IMF’s <strong>Financial</strong> Sector Assessment Program (FSAP) show<br />
that the capital strengthening achieved allows the system as a whole to withst<strong>and</strong> adverse shocks. 4<br />
12<br />
11<br />
10<br />
9<br />
8<br />
7<br />
6<br />
Banking groups’ core tier 1 ratios<br />
(per cent; end-of-period data)<br />
(a) 14 main listed banking groups (b) Other groups<br />
2010 2011 2012 2012<br />
Source: Consolidated supervisory reports.<br />
Median hted avera Interq<br />
e capital ratios of the largest Italian groups remain slightly lower than those of the major European<br />
banks, which in several cases have beneted from large-scale public support. However, Italian banks’<br />
nancial leverage, measured as the ratio of total balance-sheet assets to tier 1 capital, is lower − 18 as<br />
against a European average of 23 in June 2012. When assessing capital adequacy, one must take account<br />
of the manner of calculating risk-weighted assets, which are higher for Italian banks in proportion to<br />
total assets (see the box “International banks’ risk-weighted assets”).<br />
4 See the IMF’s press release of 26 March 2013: http://www.imf.org/external/np/sec/pr/2013/pr1394.htm.<br />
INTERNATIONAL BANKS’ RISK-WEIGHTED ASSETS<br />
12<br />
11<br />
10<br />
9<br />
8<br />
7<br />
6<br />
Figure 3.14<br />
<strong>Financial</strong> <strong>Stability</strong> <strong>Report</strong> No. 5, April 2013 BANCA D’ITALIA<br />
16<br />
14<br />
12<br />
10<br />
8<br />
6<br />
2010 2011 2012 2012<br />
e methods used to calculate risk-weighted assets have been studied by regulators <strong>and</strong> analysts for<br />
some time (see the box “e risk-weighted assets of Italian banks”, <strong>Financial</strong> <strong>Stability</strong> <strong>Report</strong> No.<br />
4, November 2012). e comparability of the measures of banks’ capital may be undermined by<br />
discrepancies in risk-weighted assets caused by dierences in the models used by banks or in the


