Read the Report - FMC Corporation
Read the Report - FMC Corporation
Read the Report - FMC Corporation

You also want an ePaper? Increase the reach of your titles
YUMPU automatically turns print PDFs into web optimized ePapers that Google loves.
Total Waste by Type (KTons )<br />
50<br />
40<br />
30<br />
20<br />
10<br />
0<br />
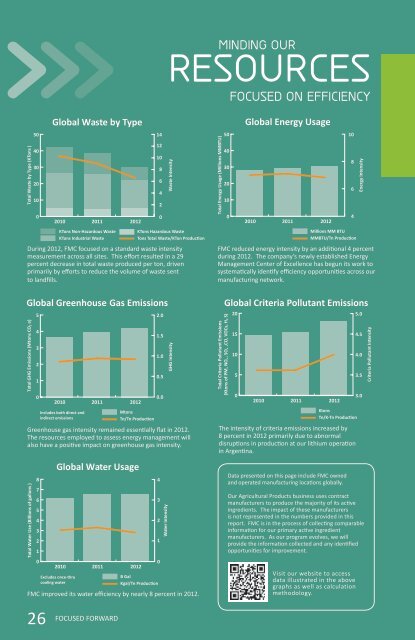
Global Waste by Type<br />
2010<br />
KTons Non-Hazardous Waste<br />
KTons Industrial Waste<br />
2011 2012<br />
During 2012, <strong>FMC</strong> focused on a standard waste intensity<br />
measurement across all sites. This effort resulted in a 29<br />
percent decrease in total waste produced per ton, driven<br />
primarily by efforts to reduce <strong>the</strong> volume of waste sent<br />
to landfills.<br />
Global Greenhouse Gas Emissions<br />
Total GHG Emissions (Mtons CO 2 e )<br />
Total Water Use (Billions of gallons )<br />
5<br />
4<br />
3<br />
2<br />
1<br />
0<br />
8<br />
7<br />
6<br />
5<br />
4<br />
3<br />
2<br />
1<br />
0<br />
2010<br />
Includes both direct and<br />
indirect emissions<br />
Global Water Usage<br />
2010<br />
Excludes once-thru<br />
cooling water<br />
2011 2012<br />
Greenhouse gas intensity remained essentially flat in 2012.<br />
The resources employed to assess energy management will<br />
also have a positive impact on greenhouse gas intensity.<br />
2011 2012<br />
<strong>FMC</strong> improved its water efficiency by nearly 8 percent in 2012.<br />
26<br />
FOCUSED FORWARD<br />
14<br />
12<br />
10<br />
8<br />
6<br />
4<br />
2<br />
0<br />
2.0<br />
1.5<br />
1.0<br />
0.5<br />
0.0<br />
4<br />
3<br />
2<br />
1<br />
0<br />
Water Intensity<br />
MINDING OUR<br />
RESOURCES<br />
FOCUSED ON EFFICIENCY<br />
Waste Intensity<br />
GHG Intensity<br />
Total Energy Usage (Millions MMBTU)<br />
50<br />
40<br />
30<br />
20<br />
10<br />
0<br />
Global Energy Usage<br />
2010<br />
2011 2012<br />
<strong>FMC</strong> reduced energy intensity by an additional 4 percent<br />
during 2012. The company’s newly established Energy<br />
Management Center of Excellence has begun its work to<br />
systematically identify efficiency opportunities across our<br />
manufacturing network.<br />
Total Criteria Pollutant Emissions<br />
(Ktons of PM, NOx , SOx , CO, VOCs, H2 S )<br />
Global Criteria Pollutant Emissions<br />
20<br />
15<br />
10<br />
5<br />
0<br />
2010<br />
2011 2012<br />
The intensity of criteria emissions increased by<br />
8 percent in 2012 primarily due to abnormal<br />
disruptions in production at our lithium operation<br />
in Argentina.<br />
Data presented on this page include <strong>FMC</strong> owned<br />
and operated manufacturing locations globally.<br />
10<br />
8<br />
6<br />
4<br />
Energy Intensity<br />
Our Agricultural Products business uses contract<br />
manufacturers to produce <strong>the</strong> majority of its active<br />
ingredients. The impact of <strong>the</strong>se manufacturers<br />
is not represented in <strong>the</strong> numbers provided in this<br />
report. <strong>FMC</strong> is in <strong>the</strong> process of collecting comparable<br />
information for our primary active ingredient<br />
manufacturers. As our program evolves, we will<br />
provide <strong>the</strong> information collected and any identified<br />
opportunities for improvement.<br />
Visit our website to access<br />
data illustrated in <strong>the</strong> above<br />
graphs as well as calculation<br />
methodology.<br />
5.0<br />
4.5<br />
4.0<br />
3.5<br />
3.0<br />
Criteria Pollutant Intensity