AGRICULTURAL VALUe ChAIn FInAnCInG In KenYA
AGRICULTURAL VALUe ChAIn FInAnCInG In KenYA
AGRICULTURAL VALUe ChAIn FInAnCInG In KenYA

Create successful ePaper yourself
Turn your PDF publications into a flip-book with our unique Google optimized e-Paper software.
28 • <strong>AGRICULTURAL</strong> VALUE CHAIN FINANCING IN KENYA: ASSESSMENT OF POTENTIAL OPPORTUNITIES FOR GROWTH<br />
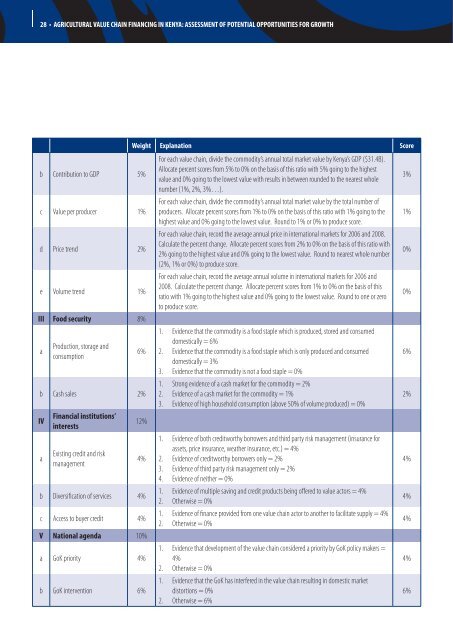
b Contribution to GDP 5%<br />
c Value per producer 1%<br />
d Price trend 2%<br />
e Volume trend 1%<br />
III Food security 8%<br />
a<br />
Production, storage and<br />
consumption<br />
Weight Explanation Score<br />
6%<br />
b Cash sales 2%<br />
IV<br />
a<br />
Financial institutions’<br />
interests<br />
Existing credit and risk<br />
management<br />
12%<br />
4%<br />
b Diversification of services 4%<br />
c Access to buyer credit 4%<br />
V National agenda 10%<br />
a GoK priority 4%<br />
b GoK intervention 6%<br />
For each value chain, divide the commodity’s annual total market value by Kenya’s GDP ($31.4B).<br />
Allocate percent scores from 5% to 0% on the basis of this ratio with 5% going to the highest<br />
value and 0% going to the lowest value with results in between rounded to the nearest whole<br />
number (1%, 2%, 3%…).<br />
For each value chain, divide the commodity’s annual total market value by the total number of<br />
producers. Allocate percent scores from 1% to 0% on the basis of this ratio with 1% going to the<br />
highest value and 0% going to the lowest value. Round to 1% or 0% to produce score.<br />
For each value chain, record the average annual price in international markets for 2006 and 2008.<br />
Calculate the percent change. Allocate percent scores from 2% to 0% on the basis of this ratio with<br />
2% going to the highest value and 0% going to the lowest value. Round to nearest whole number<br />
(2%, 1% or 0%) to produce score.<br />
For each value chain, record the average annual volume in international markets for 2006 and<br />
2008. Calculate the percent change. Allocate percent scores from 1% to 0% on the basis of this<br />
ratio with 1% going to the highest value and 0% going to the lowest value. Round to one or zero<br />
to produce score.<br />
1.<br />
2.<br />
3.<br />
1.<br />
2.<br />
3.<br />
1.<br />
2.<br />
3.<br />
4.<br />
1.<br />
2.<br />
1.<br />
2.<br />
1.<br />
2.<br />
1.<br />
2.<br />
Evidence that the commodity is a food staple which is produced, stored and consumed<br />
domestically = 6%<br />
Evidence that the commodity is a food staple which is only produced and consumed<br />
domestically = 3%<br />
Evidence that the commodity is not a food staple = 0%<br />
Strong evidence of a cash market for the commodity = 2%<br />
Evidence of a cash market for the commodity = 1%<br />
Evidence of high household consumption (above 50% of volume produced) = 0%<br />
Evidence of both creditworthy borrowers and third party risk management (insurance for<br />
assets, price insurance, weather insurance, etc.) = 4%<br />
Evidence of creditworthy borrowers only = 2%<br />
Evidence of third party risk management only = 2%<br />
Evidence of neither = 0%<br />
Evidence of multiple saving and credit products being offered to value actors = 4%<br />
Otherwise = 0%<br />
Evidence of finance provided from one value chain actor to another to facilitate supply = 4%<br />
Otherwise = 0%<br />
Evidence that development of the value chain considered a priority by GoK policy makers =<br />
4%<br />
Otherwise = 0%<br />
Evidence that the GoK has interfered in the value chain resulting in domestic market<br />
distortions = 0%<br />
Otherwise = 6%<br />
3%<br />
1%<br />
0%<br />
0%<br />
6%<br />
2%<br />
4%<br />
4%<br />
4%<br />
4%<br />
6%