Preliminary Performance Evaluation of a Near Zero Energy Home in ...
Preliminary Performance Evaluation of a Near Zero Energy Home in ...
Preliminary Performance Evaluation of a Near Zero Energy Home in ...

You also want an ePaper? Increase the reach of your titles
YUMPU automatically turns print PDFs into web optimized ePapers that Google loves.
Measured <strong>Home</strong> <strong>Energy</strong> <strong>Performance</strong><br />
The home is located <strong>in</strong> Ga<strong>in</strong>esville, Florida which is approximately 115 miles northwest <strong>of</strong> Orlando.<br />
Ga<strong>in</strong>eville has 1305 heat<strong>in</strong>g degree days and 2838 cool<strong>in</strong>g degree days (65 o F base; NOAA 2007). Us<strong>in</strong>g<br />
the <strong>Energy</strong>Gauge USA simulation (Version 2.8), the home has a prelim<strong>in</strong>ary HERS rat<strong>in</strong>g <strong>of</strong> 29 and a BA<br />
Benchmark estimated site energy sav<strong>in</strong>gs <strong>of</strong> 63.2% and a source energy sav<strong>in</strong>gs <strong>of</strong> 75.3%.<br />
It should be noted that the renewable energy portions <strong>of</strong> the home design strongly compliment the<br />
efficiency measures—particularly when source energy is considered. For <strong>in</strong>stance, without the 3.1 kW PV<br />
system, the HERS score rises to a 49 while site energy sav<strong>in</strong>gs drop to 48% and source energy sav<strong>in</strong>gs to<br />
only 55%. Similarly, with neither the PV system nor the solar water heat<strong>in</strong>g system, the HERS score rises<br />
to a 57 while site and source energy sav<strong>in</strong>gs fall to 41% and 46%, respectively.<br />
Based on the first six months <strong>of</strong> data, the home’s net energy performance has been close to<br />
expectations. The PV system was sized to achieve with<strong>in</strong> 70% <strong>of</strong> zero electricity use energy us<strong>in</strong>g TMY3<br />
weather data for Ga<strong>in</strong>esville, FL and BA Benchmark assumptions for occupant effects such as<br />
temperature setpo<strong>in</strong>ts and miscellaneous energy use (Hendron, et. al. 2004). The BA Benchmark<br />
represents U.S. average occupancy and behavior.<br />
The home was occupied by two adults <strong>in</strong> July <strong>of</strong> 2008. One <strong>of</strong> the occupants work dur<strong>in</strong>g the day and<br />
other, a retired pr<strong>of</strong>essor, rema<strong>in</strong>s at home. Both occupants are <strong>in</strong>terested <strong>in</strong> the energy use <strong>of</strong> their home<br />
and plan to choose appliances and equipment to reduce energy use when possible. Both also reported very<br />
actively us<strong>in</strong>g the <strong>in</strong>stalled build<strong>in</strong>g energy feedback system to manage loads.<br />
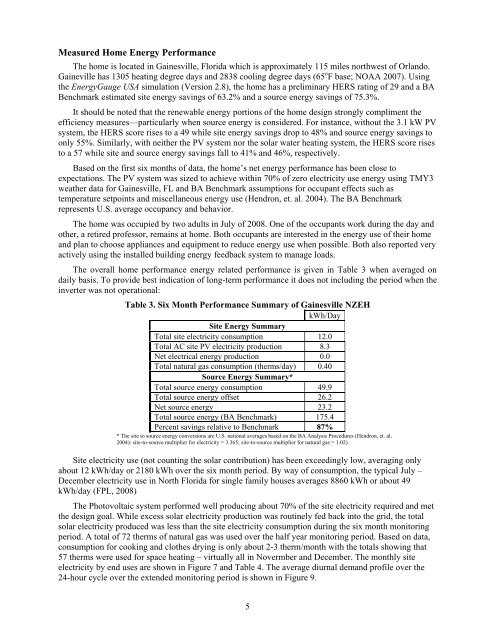
The overall home performance energy related performance is given <strong>in</strong> Table 3 when averaged on<br />
daily basis. To provide best <strong>in</strong>dication <strong>of</strong> long-term performance it does not <strong>in</strong>clud<strong>in</strong>g the period when the<br />
<strong>in</strong>verter was not operational:<br />
Table 3. Six Month <strong>Performance</strong> Summary <strong>of</strong> Ga<strong>in</strong>esville NZEH<br />
kWh/Day<br />
Site <strong>Energy</strong> Summary<br />
Total site electricity consumption 12.0<br />
Total AC site PV electricity production 8.3<br />
Net electrical energy production 0.0<br />
Total natural gas consumption (therms/day) 0.40<br />
Source <strong>Energy</strong> Summary*<br />
Total source energy consumption 49.9<br />
Total source energy <strong>of</strong>fset 26.2<br />
Net source energy 23.2<br />
Total source energy (BA Benchmark) 175.4<br />
Percent sav<strong>in</strong>gs relative to Benchmark 87%<br />
* The site to source energy conversions are U.S. national averages based on the BA Analysis Procedures (Hendron, et. al.<br />
2004): site-to-source multiplier for electricity = 3.365; site-to-source multiplier for natural gas = 1.02).<br />
Site electricity use (not count<strong>in</strong>g the solar contribution) has been exceed<strong>in</strong>gly low, averag<strong>in</strong>g only<br />
about 12 kWh/day or 2180 kWh over the six month period. By way <strong>of</strong> consumption, the typical July –<br />
December electricity use <strong>in</strong> North Florida for s<strong>in</strong>gle family houses averages 8860 kWh or about 49<br />
kWh/day (FPL, 2008)<br />
The Photovoltaic system performed well produc<strong>in</strong>g about 70% <strong>of</strong> the site electricity required and met<br />
the design goal. While excess solar electricity production was rout<strong>in</strong>ely fed back <strong>in</strong>to the grid, the total<br />
solar electricity produced was less than the site electricity consumption dur<strong>in</strong>g the six month monitor<strong>in</strong>g<br />
period. A total <strong>of</strong> 72 therms <strong>of</strong> natural gas was used over the half year monitor<strong>in</strong>g period. Based on data,<br />
consumption for cook<strong>in</strong>g and clothes dry<strong>in</strong>g is only about 2-3 therm/month with the totals show<strong>in</strong>g that<br />
57 therms were used for space heat<strong>in</strong>g – virtually all <strong>in</strong> Novermber and December. The monthly site<br />
electricity by end uses are shown <strong>in</strong> Figure 7 and Table 4. The average diurnal demand pr<strong>of</strong>ile over the<br />
24-hour cycle over the extended monitor<strong>in</strong>g period is shown <strong>in</strong> Figure 9.<br />
5