Preliminary Performance Evaluation of a Near Zero Energy Home in ...
Preliminary Performance Evaluation of a Near Zero Energy Home in ...
Preliminary Performance Evaluation of a Near Zero Energy Home in ...

Create successful ePaper yourself
Turn your PDF publications into a flip-book with our unique Google optimized e-Paper software.
CONTRACT REPORT<br />
<strong>Prelim<strong>in</strong>ary</strong> <strong>Performance</strong> <strong>Evaluation</strong><br />
<strong>of</strong> a <strong>Near</strong> <strong>Zero</strong> <strong>Energy</strong> <strong>Home</strong><br />
<strong>in</strong> Ga<strong>in</strong>esville, Florida<br />
FSEC-CR-1792-09<br />
F<strong>in</strong>al Report<br />
February 2009<br />
Submitted to:<br />
U.S. Department <strong>of</strong> <strong>Energy</strong><br />
Cooperative Agreement DE-FC26-06NY42767<br />
Authors:<br />
Danny Parker<br />
John Sherw<strong>in</strong><br />
David Hoak<br />
Subrato Chandra<br />
Eric Mart<strong>in</strong><br />
Florida Solar <strong>Energy</strong> Center
<strong>Prelim<strong>in</strong>ary</strong> <strong>Performance</strong> <strong>Evaluation</strong> <strong>of</strong> a <strong>Near</strong> <strong>Zero</strong> <strong>Energy</strong> <strong>Home</strong><br />
<strong>in</strong> Ga<strong>in</strong>esville, Florida<br />
D. Parker, J. Sherw<strong>in</strong>, D. Hoak, S. Chandra and E. Mart<strong>in</strong><br />
Florida Solar <strong>Energy</strong> Center<br />
February 2009<br />
Introduction<br />
The U.S. Department <strong>of</strong> <strong>Energy</strong>’s Build<strong>in</strong>g America (BA) program is work<strong>in</strong>g to <strong>in</strong>crease the energy<br />
efficiency <strong>of</strong> new and exist<strong>in</strong>g homes while <strong>in</strong>creas<strong>in</strong>g comfort, and durability and reduc<strong>in</strong>g resource use.<br />
As part <strong>of</strong> this program we pursue opportunities to research highly efficient homes with the goal <strong>of</strong><br />
understand<strong>in</strong>g what works, what doesn’t work, and the most economic ways to reach very high efficiency<br />
targets. The program aims to create cost neutral zero energy homes by 2020. In pursuit <strong>of</strong> this goal, this<br />
home and other research homes around the country designed to approach or achieve the zero energy goal<br />
are be<strong>in</strong>g built and studied.<br />
The performance summary on a near zero energy home (NZEH) presented here was a result <strong>of</strong><br />
collaboration between the Florida Solar <strong>Energy</strong> Center (FSEC), the Florida H.E.R.O., an <strong>in</strong>novative<br />
developer and builder <strong>in</strong> Ga<strong>in</strong>esville, Florida under the auspices <strong>of</strong> the U.S. DOE sponsored Build<strong>in</strong>g<br />
America Industrialized Hous<strong>in</strong>g Partnership (BAIHP) project . This paper briefly reviews the design and<br />
then focuses on the first half year energy performance <strong>of</strong> the project home dur<strong>in</strong>g the second half <strong>of</strong> 2008.<br />
In general, a zero energy home is designed to produce as much energy as it consumes over the course<br />
<strong>of</strong> a full year. The BA program def<strong>in</strong>ition is more specific: A zero energy home is designed to <strong>of</strong>fset as<br />
much source energy as it consumes over a typical year (based on TMY3 data) us<strong>in</strong>g BA Benchmark<br />
assumptions for typical occupant behavior. To achieve zero energy the home exchanges energy with the<br />
utility power grid. It delivers energy to the grid when the photovoltaic (PV) system is produc<strong>in</strong>g more<br />
energy than is be<strong>in</strong>g used <strong>in</strong> the home and draws from the grid when the PV system is produc<strong>in</strong>g less<br />
energy than needed <strong>in</strong> the home.<br />
The particular project here is termed “a <strong>Near</strong> <strong>Zero</strong> <strong>Energy</strong> <strong>Home</strong>” (NZEH) with the <strong>in</strong>tention that it<br />
provide 70% <strong>of</strong> its annual electrical energy and 62% <strong>of</strong> its annual site energy requirement (<strong>in</strong>clud<strong>in</strong>g<br />
natural gas) when evaluated over a full year. This project is a case study <strong>of</strong> reach<strong>in</strong>g near the zero energy<br />
goal with<strong>in</strong> a hot humid climate <strong>in</strong> a more cost effective manner than <strong>in</strong> earlier efforts.<br />
NZEH Design<br />
When Build<strong>in</strong>g America became<br />
<strong>in</strong>volved <strong>in</strong> the project, the lot<br />
orientations were already determ<strong>in</strong>ed<br />
and could not be altered – the primary<br />
reason for the solar systems on the West<br />
ro<strong>of</strong>. The energy analysis <strong>of</strong> the s<strong>in</strong>gle<br />
story home, shown <strong>in</strong> Figure 1, was<br />
performed us<strong>in</strong>g EGUSA s<strong>of</strong>tware<br />
(Parker, et. al. 1999) to achieve a<br />
build<strong>in</strong>g that would have a 70%<br />
reduction to annual energy use relative<br />
to a Benchmark build<strong>in</strong>g <strong>in</strong> the same<br />
climate. This eng<strong>in</strong>eer<strong>in</strong>g approach was<br />
developed <strong>in</strong> partnership with the<br />
developer and builder <strong>in</strong> Ga<strong>in</strong>esville, FL.<br />
The 1,770 ft 2 home specifications are<br />
summarized <strong>in</strong> Table 1.<br />
Figure 1. <strong>Near</strong> <strong>Zero</strong> <strong>Energy</strong> <strong>Home</strong> <strong>in</strong> Ga<strong>in</strong>esville, FL as viewed<br />
from the southwest.<br />
1
Square footage<br />
Table 1. Summary <strong>of</strong> Ga<strong>in</strong>esville NZEH Attributes<br />
1772 ft 2 ; s<strong>in</strong>gle story construction<br />
Number <strong>of</strong> bedrooms 3 bedrooms, 2 baths<br />
Number <strong>of</strong> occupants 2 adults<br />
Design heat<strong>in</strong>g load<br />
21,500 Btu/hr<br />
Design cool<strong>in</strong>g load<br />
15,100 Btu/hr<br />
Walls 2 x4” walls with 3.5” <strong>of</strong> cellulose<br />
Nom<strong>in</strong>al R-value = 13 hr ft 2 F/Btu<br />
Ceil<strong>in</strong>g/Ro<strong>of</strong> IR reflective metal tile ro<strong>of</strong> (Solar Absorptance= 0.65)<br />
Radiant barrier under ro<strong>of</strong> deck with 1:300 attic ventilation<br />
Ceil<strong>in</strong>g <strong>in</strong>sulation R value = 30 hr ft 2 F/Btu<br />
Floor Un<strong>in</strong>sulated slab floor<br />
80% tile floor for passive earth contact cool<strong>in</strong>g<br />
W<strong>in</strong>dows 274 ft 2 ( 15.5% glaz<strong>in</strong>g); Low-e, low SHGC<br />
U = 0.34 Btu/hr ft 2 F, SHGC = 0.28<br />
Miscellaneous Electric load control None<br />
Occupant <strong>Energy</strong> Information Real time energy feedback <strong>in</strong>stalled <strong>in</strong> home (T.E.D.)<br />
Water heat<strong>in</strong>g<br />
Dra<strong>in</strong>back closed-loop gycol solar system fac<strong>in</strong>g west, 5/12 tilt<br />
Solar water heat<strong>in</strong>g<br />
80 ft 2 AET-40 collectors with 120 gallon storage tank<br />
Auxiliary electric water heater for backup (EF= 0.90)<br />
Ducts Very low duct leakage tested Qn=0.022; all ducts <strong>in</strong> conditioned space<br />
framed out below ceil<strong>in</strong>g<br />
Space heat<strong>in</strong>g<br />
Fully condens<strong>in</strong>g natural gas furnace (AFUE=0.94); Carrier 58MVB060<br />
Space cool<strong>in</strong>g<br />
SEER 19 two speed, 2-ton air conditioner (Carrier 24ANA124A300)<br />
Light<strong>in</strong>g Hard wired fluorescent and compact fluorescent throughout the house (owner<br />
provided with replacement CFLs, 92% lights are CFL’s)<br />
Appliances <strong>Energy</strong> Star Whirlpool clothes washer (WFW 83005), dishwasher<br />
(DU850SWP) and refrigerator (GR25HWXPB02). Natural gas dryer<br />
and range.<br />
Solar electric Nom<strong>in</strong>al 3.150 kWp DC photovoltaic system (Conergy S 175MU modules)<br />
with 94% efficient SMA 3300 <strong>in</strong>verter; west fac<strong>in</strong>g (azimuth= 270)<br />
Infiltration/Ventilation Tight construction: tested leakage <strong>of</strong> 3.1 ACH @50 Pa pressure; Low noise,<br />
high efficiency bathroom fans, supplemented by 29 cfm <strong>of</strong> runtime whole<br />
house mechanical ventilation and dedicated kitchen ventilation<br />
HERS Index for the house 29<br />
Figure 2: Interior duct system show<strong>in</strong>g roughed <strong>in</strong> ducts<br />
and fram<strong>in</strong>g details.<br />
2<br />
Figure 3. F<strong>in</strong>ished <strong>in</strong>terior duct system pass<strong>in</strong>g over<br />
kitchen area.
The envelope <strong>of</strong> the home is a s<strong>in</strong>gle stud wall design 16” on centers with ladder T’s and blown<br />
cellulose (R-13 hr/ft 2 -F o /Btu). The attic ceil<strong>in</strong>g has R-30 blown cellulose <strong>in</strong>sulation. Although the slab<br />
floor is un<strong>in</strong>sulated, we chose to use an 80% tile floor<strong>in</strong>g to take advantage <strong>of</strong> passive cool<strong>in</strong>g from the<br />
earth contact portion <strong>of</strong> the build<strong>in</strong>g.<br />
Figure 4. Eighty percent tile floors <strong>in</strong> the NZEH home<br />
improves earth contact cool<strong>in</strong>g.<br />
3<br />
Figure 5. R-30 cellulose attic <strong>in</strong>sulation, radiant barrier<br />
vented attic and R-6 flex duct.<br />
The s<strong>in</strong>gle-story home is designed to largely reject solar ga<strong>in</strong> <strong>in</strong> Florida’s hot humid climate. Two<br />
foot overhangs are used around the plan. The w<strong>in</strong>dows are double-glazed low-e with v<strong>in</strong>yl frames. An IR<br />
reflective metal sh<strong>in</strong>gle ro<strong>of</strong> with a solar absorptance <strong>of</strong> only 65% is used to reject heat from the top <strong>of</strong><br />
the build<strong>in</strong>g. An attic radiant barrier is used underneath to provide additional reduction to attic heat ga<strong>in</strong>.<br />
The attic is normally ventilated (1:300 vent ratio) with both s<strong>of</strong>fit and <strong>of</strong>f-ridge vents.<br />
With these shell efficiency features, the peak design heat<strong>in</strong>g load for the home is small – about 21,500<br />
Btu/hr (5.3 kW). This load was met us<strong>in</strong>g a 56,000 Btu/hr natural gas furnace (Carrier 58MVB060) with<br />
an AFUE <strong>of</strong> 94%. The design cool<strong>in</strong>g load was even lower: 15,100 Btu/hr with the cool<strong>in</strong>g load<br />
addressed by a two-ton SEER 19 Btu/Wh, two-stage air conditioner (Carrier 24ANA124A300). The<br />
matched CNPVP3617A air handler <strong>in</strong>cludes a variable speed blower with a brushless DC motor. 1 The<br />
comb<strong>in</strong>ation has an EER <strong>of</strong> 13.9 Btu/Wh at the 95/80/67 ARI rat<strong>in</strong>g condition.<br />
All mechanical equipment is conta<strong>in</strong>ed with<strong>in</strong> this thermal envelope.With<strong>in</strong> the construction, the<br />
ducts were located underneath the <strong>in</strong>sulation on the <strong>in</strong>terior and thus with<strong>in</strong> the <strong>in</strong>sulated envelope. The<br />
air handler is located <strong>in</strong> an <strong>in</strong>terior utility room. Water heat<strong>in</strong>g is accomplished us<strong>in</strong>g a solar thermal<br />
system and 120 gallons <strong>of</strong> water for thermal storage. The solar system has 80 ft 2 <strong>of</strong> collector area which<br />
faces west because <strong>of</strong> the build<strong>in</strong>g orientation. The solar water heat<strong>in</strong>g system was sized to provide a high<br />
solar sav<strong>in</strong>g fraction year round, and a dra<strong>in</strong>back configuration is used to prevent the need for a glycol<br />
loop and heat exchanger.<br />
The grid-tied solar electric PV system consistes <strong>of</strong> eighteen 175-Watt Conergy S175MU modules<br />
connected to an SMA 3300 <strong>in</strong>verter. Due to the home’s lot orientation and available ro<strong>of</strong> space, the ro<strong>of</strong>mounted<br />
PV and solar DHW systems face west.<br />
1<br />
Full details and performance map <strong>of</strong> the air conditioner, air handler and furnace unit can be found on the <strong>in</strong>ternet:<br />
http://www.docs.hvacpartners.com/idc/groups/public/documents/techlit/24ana1-2pd.pdf
Figure 6. SEER 19 AC system on east side <strong>of</strong> home with grid-tied SMA <strong>in</strong>verter <strong>in</strong> background.<br />
Data Acquisition System Design<br />
A data acquisition system was <strong>in</strong>stalled to<br />
determ<strong>in</strong>e if the home met its energy design<br />
goal <strong>of</strong> near zero energy. The system was<br />
designed to allow disaggregation <strong>of</strong> the PV<br />
energy production and some end uses. A<br />
summary <strong>of</strong> the data po<strong>in</strong>ts and the equipment<br />
used is given <strong>in</strong> Table 2.<br />
Data were collected on 15-m<strong>in</strong>ute<br />
<strong>in</strong>tervals. A dedicated website was created to<br />
aggregate daily and monthly averages and<br />
sums and to create graphics on the<br />
performance <strong>of</strong> the home for daily<br />
troubleshoot<strong>in</strong>g (www.<strong>in</strong>fomonitors.com/nzg).<br />
All electrical end use measurements were <strong>in</strong><br />
place by August 2008. However, the water<br />
flow and natural gas end use monitor<strong>in</strong>g will<br />
not be complete until March 2009. This report<br />
summarizes prelim<strong>in</strong>ary data from the project<br />
from July – December <strong>of</strong> 2008. Long term data<br />
will be collected on the project over the next<br />
year through spr<strong>in</strong>g 2010.<br />
Table 2. Measurements and Components<br />
<strong>of</strong> the Data Acquisition System<br />
Measurements Component<br />
Electrical energy measurements<br />
House total power<br />
Heat pump compressor power<br />
Air Handler power<br />
Heat pump pump power<br />
DHW power<br />
Natural gas measurements<br />
Space heat<br />
Total gas consumption<br />
4<br />
Pulse output<br />
watt-hour transducers<br />
Diaphragm gas meters<br />
with pulse output<br />
Temperatures & humidity Temperature & RH transmitter<br />
Ambient air<br />
Indoor air temperature<br />
Indoor relative humidity<br />
Inlet water temperature<br />
Solar from system<br />
Return air temperature & humidity<br />
Supply air temperature & humidity<br />
Capacitive type hygrometer<br />
Type T thermocouples<br />
Water flow<br />
Hot water use Positive diplacemnent flowmeter<br />
Weather related measurements<br />
Outdoor temperature and RH<br />
Solar radiation - horizontal<br />
Solar radiation - plane <strong>of</strong> collectors<br />
Data Logg<strong>in</strong>g Equipment<br />
Communications<br />
T&RH sensor w/shield<br />
Pyranometer<br />
Pyranometer<br />
Campbell data logger<br />
Thermocouple multiplexer<br />
Switch closure multiplexer<br />
Telephone modem
Measured <strong>Home</strong> <strong>Energy</strong> <strong>Performance</strong><br />
The home is located <strong>in</strong> Ga<strong>in</strong>esville, Florida which is approximately 115 miles northwest <strong>of</strong> Orlando.<br />
Ga<strong>in</strong>eville has 1305 heat<strong>in</strong>g degree days and 2838 cool<strong>in</strong>g degree days (65 o F base; NOAA 2007). Us<strong>in</strong>g<br />
the <strong>Energy</strong>Gauge USA simulation (Version 2.8), the home has a prelim<strong>in</strong>ary HERS rat<strong>in</strong>g <strong>of</strong> 29 and a BA<br />
Benchmark estimated site energy sav<strong>in</strong>gs <strong>of</strong> 63.2% and a source energy sav<strong>in</strong>gs <strong>of</strong> 75.3%.<br />
It should be noted that the renewable energy portions <strong>of</strong> the home design strongly compliment the<br />
efficiency measures—particularly when source energy is considered. For <strong>in</strong>stance, without the 3.1 kW PV<br />
system, the HERS score rises to a 49 while site energy sav<strong>in</strong>gs drop to 48% and source energy sav<strong>in</strong>gs to<br />
only 55%. Similarly, with neither the PV system nor the solar water heat<strong>in</strong>g system, the HERS score rises<br />
to a 57 while site and source energy sav<strong>in</strong>gs fall to 41% and 46%, respectively.<br />
Based on the first six months <strong>of</strong> data, the home’s net energy performance has been close to<br />
expectations. The PV system was sized to achieve with<strong>in</strong> 70% <strong>of</strong> zero electricity use energy us<strong>in</strong>g TMY3<br />
weather data for Ga<strong>in</strong>esville, FL and BA Benchmark assumptions for occupant effects such as<br />
temperature setpo<strong>in</strong>ts and miscellaneous energy use (Hendron, et. al. 2004). The BA Benchmark<br />
represents U.S. average occupancy and behavior.<br />
The home was occupied by two adults <strong>in</strong> July <strong>of</strong> 2008. One <strong>of</strong> the occupants work dur<strong>in</strong>g the day and<br />
other, a retired pr<strong>of</strong>essor, rema<strong>in</strong>s at home. Both occupants are <strong>in</strong>terested <strong>in</strong> the energy use <strong>of</strong> their home<br />
and plan to choose appliances and equipment to reduce energy use when possible. Both also reported very<br />
actively us<strong>in</strong>g the <strong>in</strong>stalled build<strong>in</strong>g energy feedback system to manage loads.<br />
The overall home performance energy related performance is given <strong>in</strong> Table 3 when averaged on<br />
daily basis. To provide best <strong>in</strong>dication <strong>of</strong> long-term performance it does not <strong>in</strong>clud<strong>in</strong>g the period when the<br />
<strong>in</strong>verter was not operational:<br />
Table 3. Six Month <strong>Performance</strong> Summary <strong>of</strong> Ga<strong>in</strong>esville NZEH<br />
kWh/Day<br />
Site <strong>Energy</strong> Summary<br />
Total site electricity consumption 12.0<br />
Total AC site PV electricity production 8.3<br />
Net electrical energy production 0.0<br />
Total natural gas consumption (therms/day) 0.40<br />
Source <strong>Energy</strong> Summary*<br />
Total source energy consumption 49.9<br />
Total source energy <strong>of</strong>fset 26.2<br />
Net source energy 23.2<br />
Total source energy (BA Benchmark) 175.4<br />
Percent sav<strong>in</strong>gs relative to Benchmark 87%<br />
* The site to source energy conversions are U.S. national averages based on the BA Analysis Procedures (Hendron, et. al.<br />
2004): site-to-source multiplier for electricity = 3.365; site-to-source multiplier for natural gas = 1.02).<br />
Site electricity use (not count<strong>in</strong>g the solar contribution) has been exceed<strong>in</strong>gly low, averag<strong>in</strong>g only<br />
about 12 kWh/day or 2180 kWh over the six month period. By way <strong>of</strong> consumption, the typical July –<br />
December electricity use <strong>in</strong> North Florida for s<strong>in</strong>gle family houses averages 8860 kWh or about 49<br />
kWh/day (FPL, 2008)<br />
The Photovoltaic system performed well produc<strong>in</strong>g about 70% <strong>of</strong> the site electricity required and met<br />
the design goal. While excess solar electricity production was rout<strong>in</strong>ely fed back <strong>in</strong>to the grid, the total<br />
solar electricity produced was less than the site electricity consumption dur<strong>in</strong>g the six month monitor<strong>in</strong>g<br />
period. A total <strong>of</strong> 72 therms <strong>of</strong> natural gas was used over the half year monitor<strong>in</strong>g period. Based on data,<br />
consumption for cook<strong>in</strong>g and clothes dry<strong>in</strong>g is only about 2-3 therm/month with the totals show<strong>in</strong>g that<br />
57 therms were used for space heat<strong>in</strong>g – virtually all <strong>in</strong> Novermber and December. The monthly site<br />
electricity by end uses are shown <strong>in</strong> Figure 7 and Table 4. The average diurnal demand pr<strong>of</strong>ile over the<br />
24-hour cycle over the extended monitor<strong>in</strong>g period is shown <strong>in</strong> Figure 9.<br />
5
Table 4. Six Monthly <strong>Energy</strong> Summary 2008<br />
kWh<br />
July August Sept. Oct. Nov. Dec.<br />
6<br />
Average<br />
kWh/day<br />
Total House Electrical Demand 465 447 438 372 299 219 12.3<br />
Cool<strong>in</strong>g kWh 218 207 191 104 37 34 4.3<br />
Air Handler kWh 16 16 15 13 20 22 0.6<br />
Hot Water kWh 0 2 0 5 13 29 0.3<br />
Light<strong>in</strong>g, Appliances, & Other 231 222 232 250 214 134 7.1<br />
PV ac Power Produced 283 159 176 270 237 288 8.3<br />
Natural Gas (therms) 3 2 3 4 28 32 0.4 therms<br />
* PV system down with failed <strong>in</strong>verter Aug. 20th – Sept. 11th.<br />
Figure 7. Monthly site electricity consumption by end use.<br />
Overall, the PV system produced about 70% <strong>of</strong> the electricity needed over the monitor<strong>in</strong>g period, but<br />
about 53% <strong>of</strong> total site energy requirement when natural gas is <strong>in</strong>cluded. In addition, s<strong>in</strong>ce the NZEH<br />
home produces most <strong>of</strong> the energy for its water heat<strong>in</strong>g and is much more efficient than a standard new<br />
home the overall sav<strong>in</strong>gs is higher. We also compared its energy use to a typical 1993 home (the BA<br />
Benchmark) which showed a daily average source energy use <strong>of</strong> 175 kWh/day aga<strong>in</strong>st the 23.2 kWh<br />
actually measured for the NZEH home. This represents an 87% sav<strong>in</strong>gs <strong>in</strong> source energy. The detailed<br />
simulation results for this calculation conta<strong>in</strong>ed <strong>in</strong> Table 5.<br />
Table 5. Annual <strong>Energy</strong> Use and Site and Source Sav<strong>in</strong>gs<br />
Characteristic<br />
Electricity*<br />
kWh<br />
Natural Gas<br />
Therms<br />
Site<br />
10 6 Btu<br />
Source<br />
10 6 Btu<br />
Benchmark Total <strong>Energy</strong> Use 15769 343 88.088 218.48<br />
NZEH Prototype (simulation) 2454* 244 32.390 53.559<br />
NZEH (actual monitored) 1360* 146 19.209 29.457<br />
NZEH Sav<strong>in</strong>gs: Simulated 84.4% 28.9% 63.2% 75.5%<br />
NZEH Sav<strong>in</strong>gs: Actual 91.4% 57.4% 78.2% 86.5%<br />
* Net <strong>of</strong> subtracted PV power produced: 3766 kWh simulated; 3030 kWh measured.
Detailed Site and Source <strong>Energy</strong> Sav<strong>in</strong>gs<br />
We used the EGUSA Version 2.8 s<strong>of</strong>tware and monitored energy use to evaluate the source energy<br />
sav<strong>in</strong>gs <strong>of</strong> the NZEH design. As detailed <strong>in</strong> Appendix B, the s<strong>of</strong>tware predicted a 63% site energy sav<strong>in</strong>gs<br />
and a 75% source energy sav<strong>in</strong>gs versus the BA Benchmark for the <strong>in</strong>stalled measures. To evaluate<br />
measured performance, we assumed that the twelve month energy sav<strong>in</strong>gs would be twice that seen <strong>in</strong><br />
the July - December monitor<strong>in</strong>g period.<br />
In reality, the as built and as operated home did even better than predicted by the s<strong>of</strong>tware. Our<br />
evaluation showed that the actual site and source energy sav<strong>in</strong>gs were 78% and 87%, respectively –<br />
exceed<strong>in</strong>g the predicted performance. While simulated HVAC electrical energy was somewhat higher<br />
than that simulated (measured = 4.3 kWh/day vs. 3.1 kWh predicted), non-HVAC, non DHW measured<br />
electricity use was much lower than simulated: (7.1 kWh/day vs. 13.3 kWh/day simulated). This is likely<br />
due to the careful and frugal energy use <strong>of</strong> the home owners utiliz<strong>in</strong>g the energy feedback system.<br />
Figure 8. Inverter and electrical <strong>in</strong>terface at NZEH house.<br />
Figure 9. Ga<strong>in</strong>esville NZEH average 24-hour electrical demand, July – December 2008.<br />
7
Figure 10. Closeup <strong>of</strong> 3.1 kW PV system and 80 ft 2 solar water heat<strong>in</strong>g system.<br />
Monthly <strong>Energy</strong> Summary by End-Use<br />
As expected, space cool<strong>in</strong>g is the largest electricity end use <strong>in</strong> summer, while natural gas is the largest<br />
energy consumer <strong>in</strong> November and December. The house design and equipment must be seen as<br />
extraord<strong>in</strong>arily successful at reduc<strong>in</strong>g space cool<strong>in</strong>g needs. Air condition<strong>in</strong>g averaged only about 200<br />
kWh/month <strong>in</strong> July and August while typical home <strong>in</strong> North Florida use 800 – 1000 kWh/month dur<strong>in</strong>g<br />
summer months (FPL, 2008). Similarly, the air conditioner variable speed air handler and furnace system<br />
blower was very efficient us<strong>in</strong>g only about 15-20 kWh per month aga<strong>in</strong>st standard systems which would<br />
use three times as much energy for air circulation. Moreover, the system produced very comfortable<br />
<strong>in</strong>terior conditions dur<strong>in</strong>g summer as shown <strong>in</strong> Figure 11.<br />
Figure 11. NZEH summer home <strong>in</strong>terior comfort conditions (temperature and relative humidity),<br />
July - September 2008.<br />
8
Crankcase Heater Power<br />
Although the air conditioner has a very efficient two-stage scroll compressor, we found that crankcase<br />
heater (CCH) – a 60 Watt unit – can be a significant part <strong>of</strong> annual energy use <strong>of</strong> very low energy use<br />
homes. 2 Crankcase heaters mitigate the fact that refrigerant moves to the outside unit dur<strong>in</strong>g cold weather<br />
and condenses. Unfortunately, refrigerant is an excellent solvent which wipes oil from bear<strong>in</strong>gs and can<br />
<strong>in</strong>itiate slugg<strong>in</strong>g which shortens compressors reliability. Even scroll compressors are limited to the<br />
amount <strong>of</strong> liquid refrigerant that can pass through them without caus<strong>in</strong>g harm.<br />
Below is a plot show<strong>in</strong>g the crankcase heater (CCH) operation on 27 January 2008. Because <strong>of</strong> the<br />
controls, the CCH is designed to come on when the outdoor temperature is lower than 65 o F and then turns<br />
<strong>of</strong>f when the outdoor temperature is above 80 o F.<br />
Figure 12. Crankcase heater operation at NZEH site on 27 January 2008 as vary<strong>in</strong>g with outdoor temperatures.<br />
Unfortunately, the control method for CCH results <strong>in</strong> many hours, even <strong>in</strong> Florida, where the 55 Watt<br />
load is seen even though the unit is <strong>in</strong> heat<strong>in</strong>g mode where a natural gas furnace is used. For <strong>in</strong>stance, <strong>in</strong><br />
the NZEH, cool<strong>in</strong>g was not seen from 15 November onwards. However, <strong>in</strong> the ten week period from 15<br />
November - 28 January 2008, the CCH used 80 kWh. Dur<strong>in</strong>g that time no cool<strong>in</strong>g at all was used and yet<br />
the crankcase heater was on about 80% <strong>of</strong> the time. The energy use <strong>of</strong> the CCH was nearly that expected<br />
for a refrigerator over the same period.<br />
Also, there are many hours <strong>of</strong> crankcase heat with no prospect at all <strong>of</strong> cool<strong>in</strong>g operation that would<br />
make the heat worthwhile. For <strong>in</strong>stance when outdoor temperatures are 55 o F or lower, there is virtually no<br />
situation where cool<strong>in</strong>g would required and yet there 1677 hours when these temperatures conditions are<br />
encountered <strong>in</strong> Ga<strong>in</strong>esville, Florida. This amount <strong>of</strong> potentially wasted energy would total approximately<br />
100 kWh/year. In more northern climates, such long periods where CCH would be on without cool<strong>in</strong>g<br />
be<strong>in</strong>g needed would be much more. For <strong>in</strong>stance, <strong>in</strong> Boston, MA, there are 5,004 hours when the<br />
temperature is less than 55 o F and the crankcase heater would be on with virtually no prospect <strong>of</strong> heat<strong>in</strong>g<br />
be<strong>in</strong>g needed. Given the characteristics <strong>of</strong> the CCH, this would represent a wasted use <strong>of</strong> electricity <strong>of</strong><br />
275 kWh/year.<br />
S<strong>in</strong>ce CCH is not considered <strong>in</strong> the SEER procedures, this level <strong>of</strong> energy consumption suggests<br />
technology development with adaptive controls to reduce the <strong>in</strong>cidence <strong>of</strong> crankcase heat dur<strong>in</strong>g w<strong>in</strong>ter<br />
2<br />
It is a common misconception that scroll compressors do not require crankcase heat. Many do require CCH as acknowledged by field<br />
experience by major manufactuers.<br />
9
months when it serves no purpose. It also suggests that DOE somehow consider CCH operation <strong>in</strong> its<br />
efficiency rat<strong>in</strong>g procedures s<strong>in</strong>ce CCH energy use will otherwise be a large part <strong>of</strong> annual air conditioner<br />
energy use, particularly <strong>in</strong> northern climates with only short periods <strong>of</strong> active cool<strong>in</strong>g.<br />
Other Electrical Loads<br />
Base load light<strong>in</strong>g, refrigeration and other electrical end uses appear to be approximately 230<br />
kWh/month. As detailed below, the solar water heat<strong>in</strong>g system totally elim<strong>in</strong>ated water heat<strong>in</strong>g auxiliary<br />
energy dur<strong>in</strong>g summer.<br />
Even before the home was occupied <strong>in</strong> July 2008, we used an established protocol to identify<br />
miscellaneous electric loads <strong>in</strong> the home us<strong>in</strong>g The <strong>Energy</strong> Detective (TED) monitor. This was done when<br />
an energy feedback monitor (TED) was <strong>in</strong>stalled to help occupant monitor energy use. We found that the<br />
completed, but unoccupied home used 50 Watts <strong>of</strong> standby power to operate a garage door opener,<br />
HVAC control electronics, solar hot system control module, GFIs and smoke alarms.<br />
Table 6. Measured Miscellaneous Standby Electrical Demand Prior to Occupancy<br />
Garage door Opener 5 W<br />
Solar hot water controls 5 W<br />
Grid tied Inverter 5 W<br />
Bathroom GFI 5 W<br />
Kitchen GFI 5 W<br />
Dishwasher electronics 5 W<br />
HVAC electronics 20 W<br />
Total Baseload 40-50 Watt with breakers on<br />
S<strong>in</strong>ce total house electrical consumption averaged only 12 kWh/day, the pre-occupancy standby<br />
power <strong>in</strong> the home (50 Watts) amounts to to 1.2 kWh/day or 10% <strong>of</strong> total consumption! Note that this<br />
does not <strong>in</strong>clude any home owner <strong>in</strong>stalled appliances such as televisions, computers and so forth.<br />
Figure 13. Installed TED energy feedback display.<br />
Both <strong>of</strong> the occupants report employ<strong>in</strong>g the above energy feedback device to help control their energy<br />
use. I would appear as if they have been very successful s<strong>in</strong>ce measured non-space condition<strong>in</strong>g and<br />
water heat<strong>in</strong>g energy has only averaged 7.1 kWh/day. It is worth not<strong>in</strong>g that the Build<strong>in</strong>g America<br />
simulation Benchmark analysis predicts that typical non HVAC, non water heat<strong>in</strong>g energy use would<br />
typically average 12.2 kWh/day, even with the efficient appliances <strong>in</strong>stalled <strong>in</strong> the home. As seen before<br />
<strong>in</strong> other projects, this aga<strong>in</strong> highlights the critical nature <strong>of</strong> provid<strong>in</strong>g usable energy feedback to <strong>in</strong>terested<br />
occupants.<br />
10
Solar Electric Power Production<br />
The 3.15 kW system consists <strong>of</strong> 18 Conergy 175 Watt modules with a 3 kW SMA <strong>in</strong>verter.<br />
Photovoltaic (PV) power production was monitored beg<strong>in</strong>n<strong>in</strong>g on 6 July 2008. Unfortunately, there was a<br />
lightn<strong>in</strong>g related <strong>in</strong>verter failure on 20 August which was not repaired until the unit was replaced on<br />
September 11 th . Other than the <strong>in</strong>verter failure, the performance <strong>of</strong> the PV system has been as expected.<br />
A PV performance calculator, PVWatts, is available on NREL’s Renewable Resource Data Center<br />
website (http://rredc.nrel.gov). The PVWatts simulation <strong>of</strong> the 3.15 kWp DC PV west-fac<strong>in</strong>g system us<strong>in</strong>g<br />
TMY2 weather data from Jacksonville, FL predicts the system will deliver 3418 kWh (11.7 MBtu) <strong>of</strong> AC<br />
electricity per year with no shad<strong>in</strong>g. The PVWatts default derate factor <strong>of</strong> 0.77 was used for this<br />
prediction. Similarly, the PV calculator (PVFORM) <strong>in</strong> the EGUSA s<strong>of</strong>tware us<strong>in</strong>g the Ga<strong>in</strong>esville FL<br />
TMY3 weater data <strong>in</strong>dicated 3766 kWh/year from the PV system. The predicted PV output for the<br />
monitored period from the same s<strong>of</strong>tware was 9.5 kWh/day. With<strong>in</strong> the project a digitized shad<strong>in</strong>g<br />
analysis at the site <strong>in</strong>dicated approximately a 14% loss <strong>of</strong> potential solar power production due to trees on<br />
the east and north west sides <strong>of</strong> the property boundary. The detailed solar access analysis with images is<br />
shown <strong>in</strong> Appendix C. A 14% loss <strong>of</strong> solar radiation due to shad<strong>in</strong>g from mature trees on the site could be<br />
expected to reduce the expected annual PV production to about 8.2 kWh/day. 3 The actual solar electric<br />
energy delivered from 6 July – December 29, 2008 was 8.3 kWh/Day which is essentially identical to the<br />
predicted performance given variations <strong>in</strong> weather. The 15-m<strong>in</strong>ute and cumulative net electricity use over<br />
the period is shown <strong>in</strong> Figure 15.<br />
Figure 14. <strong>Evaluation</strong> <strong>of</strong> site shad<strong>in</strong>g us<strong>in</strong>g Solmetric Sun Eye.<br />
3<br />
Both PV simulation s<strong>of</strong>tware agree that use <strong>of</strong> the west orientation for the PV system results <strong>in</strong> about a further 10-15% drop <strong>in</strong> the annual<br />
electric power produced. For <strong>in</strong>stance, PVWATTS predicts an annual energy production <strong>of</strong> 3,418 kWh with the exist<strong>in</strong>g west face aga<strong>in</strong>st 4,052<br />
kWh had the same PV system been fac<strong>in</strong>g south. Similarly, EGUSA predicts 3,766 kWh with the west face and 4,121 kWh if it were fac<strong>in</strong>g south.<br />
All th<strong>in</strong>gs equal, this means that had the PV system been fac<strong>in</strong>g south, the PV system would have produced about 76% <strong>of</strong> total electrical needs<br />
and 58% <strong>of</strong> the annual energy required for the home vs. the 70% and 53%, respectively, now seen. Given the expensive energy <strong>of</strong> the solar<br />
electric system <strong>of</strong>fset, this means that optimal orientation and m<strong>in</strong>imization <strong>of</strong> PV array shad<strong>in</strong>g will provide best performance for ZEH projects<br />
when evaluated on an annual basis.<br />
11
Solar Water Heat<strong>in</strong>g<br />
Figure 15. Daily and cumulative net site electricity 15-m<strong>in</strong>ute data over a six month period.<br />
The solar water heat<strong>in</strong>g system was robustly eng<strong>in</strong>eered with the solar <strong>in</strong>staller (ECS Solar <strong>Energy</strong><br />
Systems, Inc.) determ<strong>in</strong>ed to virtually elim<strong>in</strong>ate back up water heat<strong>in</strong>g. A pumped dra<strong>in</strong>down system is<br />
used to provide function with freeze protection. Given the orientation <strong>of</strong> the house and the hipped ro<strong>of</strong>,<br />
the system had to be <strong>in</strong>stalled on the less advantageous west face <strong>of</strong> the home. Based on experience, the<br />
<strong>in</strong>staller decided on two 4 x 10 ft solar collectors (AET-40s) feed<strong>in</strong>g a 120 gallon storage <strong>in</strong> a dra<strong>in</strong>back<br />
configuration. Simulation <strong>of</strong> the solar water heat<strong>in</strong>g system <strong>in</strong> EGUSA estimated that such a system<br />
would provide 83% <strong>of</strong> typical water heat<strong>in</strong>g needs. However, this estimate is based on a three bedroom<br />
home with three occupants with typically more water to be heated than would be experienced <strong>in</strong> a two<br />
occupant household as mon<strong>in</strong>tored <strong>in</strong> this project.<br />
Full monitor<strong>in</strong>g for the solar water heat<strong>in</strong>g system was not yet <strong>in</strong>stalled dur<strong>in</strong>g the first six months <strong>of</strong><br />
the data obta<strong>in</strong>ed so that volume <strong>of</strong> the daily draws is not known. The first data <strong>in</strong>clude only the auxiliary<br />
electric energy use <strong>of</strong> the back up electric resistance elements <strong>in</strong> the solar hot water tank. These data<br />
showed that the home only used 0.3 kWh/day over the monitor<strong>in</strong>g perioid with many days with no<br />
auxiliary electrical use at all for the solar water heat<strong>in</strong>g system. As show<strong>in</strong>g <strong>in</strong> Figure 6, most <strong>of</strong> the<br />
auxiliary electricity use <strong>of</strong> the solar system comes <strong>in</strong> the cloudier months <strong>of</strong> November and December.<br />
However, monitor<strong>in</strong>g found that the dra<strong>in</strong>down solar system draws 150 watts when the system is<br />
circulated. With 7 hours <strong>of</strong> daily operation the pump energy is approximately 1.0 kWh per day. Based on<br />
a crude estimates us<strong>in</strong>g a very low estimated daily consumption <strong>of</strong> only 35 gallons per day, we would<br />
estimate that the solar water heat<strong>in</strong>g system is provid<strong>in</strong>g at least 90% <strong>of</strong> annual water heat<strong>in</strong>g energy<br />
needs. However, the high pump power observed argues for down-sized pumps, shorter pump<strong>in</strong>g and lifts<br />
(85 W pump).<br />
12
Later we will have data on the gallons <strong>of</strong> hot water use and the supply and <strong>in</strong>let water temperatures to<br />
the auxiliary tank which will allow a more precise determ<strong>in</strong>ation <strong>of</strong> the water heat<strong>in</strong>g load and a more<br />
exact estimate <strong>of</strong> the contribution by the solar system. We also <strong>in</strong>tend to measure the hot water system<br />
pump energy.<br />
Figure 16. 120 gallon solar water tank with monitor show<strong>in</strong>g system function.<br />
Peak Summer Electrical Load Shape<br />
Florida electric utilities are very concerned with how homes demand energy dur<strong>in</strong>g peak periods.<br />
Figure 17 shows the average load shape dur<strong>in</strong>g the peak July period <strong>in</strong> summer when peak daily outdoor<br />
temperatures were sometimes greater than 95 o F. Note that total household electric power demand dur<strong>in</strong>g<br />
the summer peak period (45-7 PM EDT) is only 762 W and only 422 W when net <strong>of</strong> solar power<br />
produced. This is approximately one tenth <strong>of</strong> the peak period power demand <strong>in</strong> a conventional house<br />
where utility co<strong>in</strong>cident peak demand is typically about 4 kW. Also, the cool<strong>in</strong>g energy use <strong>of</strong> the design<br />
was very low with a peak period demand <strong>of</strong> only 466 Watts and a daily energy use <strong>of</strong> only 7.5 kWh/day.<br />
13
Conclusions<br />
Figure 17. Average electric load, cool<strong>in</strong>g load, PV output and net load to grid for July 2008.<br />
We have reported on the prelim<strong>in</strong>ary performance data on a <strong>Near</strong> <strong>Zero</strong> <strong>Energy</strong> <strong>Home</strong> (NZEH) built <strong>in</strong><br />
Ga<strong>in</strong>esville, Florida. Featur<strong>in</strong>g a battery <strong>of</strong> very efficient construction methods, appliances and<br />
equipment, the 1772 square foot home was anticipated to produce about 70% <strong>of</strong> its annual electrical<br />
energy and 63% <strong>of</strong> its required site energy from its renewable energy systems. Based on six months <strong>of</strong><br />
monitor<strong>in</strong>g, the home’s energy use has been very low. Total daily electricity use has averaged only 12<br />
kWh per day and 3.7 kWh/day when solar energy production is <strong>in</strong>cluded. The compares to about 49 kWh<br />
per day for a typical s<strong>in</strong>gle family home <strong>in</strong> North Florida over the same period. Thus, the home’s net<br />
electricity use is less than 8% <strong>of</strong> that <strong>of</strong> a typical exist<strong>in</strong>g home. We also compared the home’s<br />
performance aga<strong>in</strong>st the Build<strong>in</strong>g America Benchmark consider<strong>in</strong>g all fuels. The half year Benchmark for<br />
the home <strong>in</strong>dicated a daily source energy use <strong>of</strong> 175 kWh aga<strong>in</strong>st the 23.2 kWh actually measured. This<br />
represents a sav<strong>in</strong>gs <strong>of</strong> 87%.<br />
Average cool<strong>in</strong>g energy use averaged only 4.3 kWh/day and air handler use was only 0.6 --<br />
exceed<strong>in</strong>gly low <strong>in</strong> Florida's hot climate. The 2-ton SEER 19 two-stage cool<strong>in</strong>g system appeared to work<br />
extremely well us<strong>in</strong>g very little electrical energy, even <strong>in</strong> the most try<strong>in</strong>g conditions <strong>of</strong> summer to<br />
ma<strong>in</strong>ta<strong>in</strong> 78 o F <strong>in</strong>doors with approximately a 55% relative humidity. Moreover, the occupants reported<br />
be<strong>in</strong>g very pleased with the even temperature conditions and low energy bills. Unfortunately we also<br />
found that energy use <strong>of</strong> AC crankcase heaters (CCH) can <strong>in</strong>crease daily electrical energy by 1.3<br />
kWh/day dur<strong>in</strong>g w<strong>in</strong>ter months where there is no prospect <strong>of</strong> the need for cool<strong>in</strong>g. Often dur<strong>in</strong>g w<strong>in</strong>ter<br />
days the CCH was 15% <strong>of</strong> total electricity consumption. This suggests the need for future adaptive<br />
technology for low energy houses.<br />
14
With a large solar water heat<strong>in</strong>g system with 80 ft 2 <strong>of</strong> collectors and 120 gallon storage, virtually all<br />
hot water needs were met dur<strong>in</strong>g summer months. Over the six month period, only 0.3 kWh <strong>of</strong> auxiliary<br />
water heat<strong>in</strong>g electricity was used each day. However, estimated circulation pump energy (150 W when<br />
operat<strong>in</strong>g) was about 1.0 kWh/day, <strong>in</strong>dicat<strong>in</strong>g that reduction to this parasitic load should be an objective<br />
for future efforts. Standby power as a part <strong>of</strong> miscellaneous electric loads from a garage door opener,<br />
HVAC and solar water heater control electronics and a dishwasher and household GFIs were found to<br />
total 50 Watts prior to occupancy. Thus, these constant standby loads (1 kWh/day) account for roughly<br />
10% <strong>of</strong> total measured household electricity use before homeowner electronics (computers, televisions,<br />
<strong>of</strong>fice equipment and m<strong>in</strong>or appliances) were brought to site.<br />
Although refrigeration, light<strong>in</strong>g and other m<strong>in</strong>or appliances were not monitored, they were found to<br />
be the largest collective household end use at 7.1 kWh/day or 58% <strong>of</strong> the total rema<strong>in</strong><strong>in</strong>g electrical loads.<br />
The home had a very efficient <strong>Energy</strong> Star refrigerator and fluorescent light<strong>in</strong>g used throughout (and the<br />
owners seem<strong>in</strong>gly committed to ma<strong>in</strong>ta<strong>in</strong><strong>in</strong>g this status), however this area rema<strong>in</strong>ed the largest energy<br />
end use load. This serves as another lesson from the project: <strong>in</strong> very efficient homes, light<strong>in</strong>g, appliance<br />
and miscellaneous loads will comprise the largest use <strong>of</strong> electricity and likely the most fruitful area for<br />
load reduction.<br />
The house has a gas dryer, range and heat<strong>in</strong>g system. Total measured natural gas consumption was 72<br />
therms over the six month period. Basel<strong>in</strong>e consumption <strong>in</strong> the months <strong>of</strong> July - October showed only 2-3<br />
therms used each month for cook<strong>in</strong>g and clothes dry<strong>in</strong>g. However, energy use for space heat<strong>in</strong>g was<br />
roughly 24 therms <strong>in</strong> November and 28 therms <strong>in</strong> December.<br />
The 3.15 kW west fac<strong>in</strong>g solar electric PV system operated close to expectations. We did experience<br />
one problem with the <strong>in</strong>verter, which was corrected <strong>in</strong> late summer. Not <strong>in</strong>clud<strong>in</strong>g this period, the system<br />
produced an average <strong>of</strong> 8.3 kWh/day which is similar to what is predicted with PV system simulations.<br />
We did note however, that audited site shad<strong>in</strong>g could be expected to reduce annual PV output by about<br />
14%. Also, the west fac<strong>in</strong>g array reduces output by another 10-15% over what would be expected from a<br />
south fac<strong>in</strong>g system. Both these issues along with the expense <strong>of</strong> the PV <strong>in</strong>stallation po<strong>in</strong>t out the need to<br />
optimize solar access and array orientation where possible <strong>in</strong> ZEH projects.<br />
Based on the six months monitor<strong>in</strong>g, we found the PV system to produce about 70% <strong>of</strong> the electricity<br />
used on site and when natural gas use was considered, the result was about 53% <strong>of</strong> the annual site energy<br />
use. However, the NZEH is much more efficient than standard new homes. Source energy sav<strong>in</strong>gs<br />
compared to the BA Benchmark were 87%. Based on our prelim<strong>in</strong>ary evaluation, approximately 5 kW <strong>of</strong><br />
unobstructed PV fac<strong>in</strong>g south would produce a true net zero energy home by <strong>of</strong>fsett<strong>in</strong>g all electric and<br />
natural gas use. Monitor<strong>in</strong>g will be cont<strong>in</strong>ued for another full year to access long-term performance.<br />
Acknowledgements<br />
The authors would like to thank the many <strong>in</strong>dividuals and organizations that supported this project<br />
<strong>in</strong>clud<strong>in</strong>g the homeowners, the developer, Richard Shackow and the builder, Chad Kalisak with Trunnell<br />
Construction. Ken Fonorow with FL H.E.R.O.(www.floridahero.com ) designed the <strong>in</strong>terior duct system,<br />
conducted on site test<strong>in</strong>g and provided the HERS rat<strong>in</strong>g <strong>of</strong> the home as well as important construction<br />
quality assurance. Tom Lane with ECS Solar <strong>Energy</strong> Systems provided the solar hot water and PV system<br />
design. At FSEC, Andreas Hermel<strong>in</strong>k and David Hoak <strong>in</strong>stalled <strong>of</strong> the energy feedback system and<br />
conducted and evaluation <strong>of</strong> household standby loads. We would also like to thank our sponsors at the<br />
U.S. Department <strong>of</strong> <strong>Energy</strong>’s Build<strong>in</strong>g America Program (www.build<strong>in</strong>gamerica.gov). The research<br />
fund<strong>in</strong>g was provided by DOE N.E.T.L. through a cooperative agreement DE-FC26-06NT42767.<br />
15
References<br />
Christensen, C.; Anderson, R.; Horowitz, S.; Courtney, A.; Spencer, J. 2006. BEopt(TM) S<strong>of</strong>tware for<br />
Build<strong>in</strong>g <strong>Energy</strong> Optimization: Features and Capabilities. National Renewable <strong>Energy</strong> Laboratory,<br />
NREL TP-550-39929.<br />
EIA. 2005. Annual <strong>Energy</strong> Review 2005, United States <strong>Energy</strong> Information Adm<strong>in</strong>istration, DOE/EIA-<br />
0384(2005).<br />
EPA. 2007. Climate Change – Greenhouse Gas Emissions, Personal Emissions Calculator.<br />
http://www.epa.gov/climatechange/emissions/<strong>in</strong>d_calculator.html<br />
FPL, 2008, “Typical Monthly Total Electric Usage for S<strong>in</strong>gle-Family Customer,” provided by Craig<br />
Muccio, March 2008.<br />
Hendron, B., et. al. 2004. Build<strong>in</strong>g America Perfomance Analysis Procedures, Revision 1. National<br />
Renewable <strong>Energy</strong> Laboratory, NREL/TP-550-35567.<br />
LBNL. 2004. DOE-2 Build<strong>in</strong>g Simulation S<strong>of</strong>tware, developed by Lawrence Berkeley National<br />
Laboratory, Berkeley, CA.<br />
NOAA, 2007. Climatography <strong>of</strong> the United States No. 81, Monthly Normals <strong>of</strong> Temperature,<br />
Precipitation, and Heat<strong>in</strong>g and Cool<strong>in</strong>g Degree Days, 1971-2000, National Climatic Data Center,<br />
National Oceanic and Atmospheric Adm<strong>in</strong>istration, U.S. Department <strong>of</strong> Commerce.<br />
Parker, D. et.al., 1999. "<strong>Energy</strong>Gauge® USA: A Residential Build<strong>in</strong>g <strong>Energy</strong> Simulation Design Tool",<br />
Proceed<strong>in</strong>gs <strong>of</strong> Build<strong>in</strong>g Simulation ‘99, International Build<strong>in</strong>g <strong>Performance</strong> Simulation Association,<br />
Organiz<strong>in</strong>g Committee for the 6th International IBPSA Conference, Department <strong>of</strong> Architecture<br />
Texas A&M University, TX.<br />
16
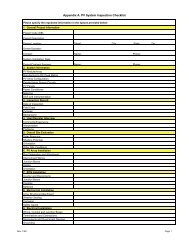
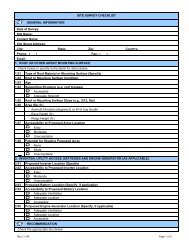
Appendix A<br />
Project Stagegate Analysis
Appendix A<br />
<strong>Evaluation</strong> <strong>of</strong> Project Stage-gate Criteria<br />
With<strong>in</strong> the Build<strong>in</strong>g America process, projects are evaluated us<strong>in</strong>g the Stagegate process to<br />
evaluate overall project success, potential for cont<strong>in</strong>uation and ref<strong>in</strong>ements to research and<br />
development. With<strong>in</strong> the process are “must meet” and “should meet” criteria. Each <strong>of</strong> these are<br />
exam<strong>in</strong>ed relative to the <strong>Near</strong> <strong>Zero</strong> <strong>Energy</strong> <strong>Home</strong> <strong>in</strong> Ga<strong>in</strong>esville.<br />
“Must Meet Criteria”<br />
Detailed Site and Source <strong>Energy</strong> Sav<strong>in</strong>gs<br />
We used the EGUSA Version 2.8 s<strong>of</strong>tware to evaluate the source energy sav<strong>in</strong>gs <strong>of</strong> the NZEH<br />
design. As detailed <strong>in</strong> Appendix B, the s<strong>of</strong>tware predicted a 63% site energy sav<strong>in</strong>gs and a 75%<br />
source energy sav<strong>in</strong>gs versus the BA Benchmark for the <strong>in</strong>stalled measures. We assumed that the<br />
twelve month energy sav<strong>in</strong>gs would be twice that seen <strong>in</strong> the July - December monitor<strong>in</strong>g period.<br />
Annual <strong>Energy</strong> use<br />
Characteristic Electricity* N. Gas Site Source<br />
kWh Therm 10 6 Btu 10 6 Btu<br />
Benchmark Total <strong>Energy</strong> Use 15769 343 88.088 218.48<br />
NZEH Prototype (simulation) 2454* 244 32.390 53.559<br />
NZEH (Actual monitored) 1360* 146 19.209 29.457<br />
NZEH Sav<strong>in</strong>gs: Simulated 84.4% 28.9% 63.2% 75.5%<br />
NZEH Sav<strong>in</strong>gs: Actual 91.4% 57.4% 78.2% 86.5%<br />
* Net <strong>of</strong> subtracted PV power produced: 3766 kWh simulated; 3030 kWh measured.<br />
In reality, the as built and as operated home did even better than predicted by the s<strong>of</strong>tware. Our<br />
evaluation showed that the actual site and source energy sav<strong>in</strong>gs were 78% and 87%,<br />
respectively– exceed<strong>in</strong>g the expectations.<br />
While simulated HVAC electrical energy was somewhat higher than that measured (monitored =<br />
4.3 kWh/day vs. 3.1 kWh predicted), non-HVAC, non DHW measured electricity use was much<br />
lower than simulated: (7.1 kWh/day vs. 13.3 kWh/day simulated). Given the response from the<br />
homeowners, this may mean that hav<strong>in</strong>g energy feedback along with <strong>in</strong>terested homeowners may<br />
be important to exceed<strong>in</strong>g sav<strong>in</strong>gs expectations <strong>in</strong> future projects. Similarly, automated controls<br />
to help shed miscellaneous electric loads may be helpful as well.
Prescriptive Based Code Approval<br />
The site related construction techniques used <strong>in</strong> the Ga<strong>in</strong>esville NZEH prototype were all<br />
relatively conventional and did not alter code-related approvals. The solar electric (PV) and solar<br />
water heat<strong>in</strong>g modules and collectors were storm rated and the electrical <strong>in</strong>spection <strong>of</strong> the PV<br />
system was completed without difficulty.<br />
Neutral Cost Target<br />
As seen <strong>in</strong> Table A1, <strong>in</strong>cremental costs <strong>of</strong> improvements over regional standard practice are<br />
presented, along with the amortized annual cost. Incremental and amortized cost <strong>of</strong> rebates and<br />
<strong>in</strong>centives are also presented. As seen <strong>in</strong> the table, the total amortized <strong>in</strong>cremental cost to the<br />
buyer, not <strong>in</strong>clud<strong>in</strong>g PV, after rebates and <strong>in</strong>centives, is $591.32 per year. Total cost <strong>in</strong>clud<strong>in</strong>g<br />
PV is $1176.05 per year. Part <strong>of</strong> these costs were s<strong>of</strong>tened by hav<strong>in</strong>g supplier provide special<br />
price accommodation on the metal ro<strong>of</strong>, the AC system, tile, radiant barrier, HVAC and<br />
appliances.<br />
Table A2 presents the simulated source energy sav<strong>in</strong>gs <strong>of</strong> the Schackow NZEH compared to<br />
both the BA Benchmark and regional standard practice. The annual utility bill reduction <strong>of</strong> the<br />
Prototype with respect to the BA Benchmark is not shown <strong>in</strong> this table, for apply<strong>in</strong>g local utility<br />
rates charged to the homeowner to source energy numbers would appear to artificially <strong>in</strong>flate the<br />
sav<strong>in</strong>gs. Instead, Table A3 presents the simulated site energy sav<strong>in</strong>gs <strong>of</strong> the Schackow NZEH<br />
compared to both the BA Benchmark and regional standard practice. In this table, us<strong>in</strong>g the<br />
local utility rates <strong>of</strong> $0.12 per kWh and $1.72 per therm, the annual utility bill reduction <strong>of</strong> the<br />
Prototype with respect to the two references is shown by end use and <strong>in</strong> total. When total<br />
amortized <strong>in</strong>cremental cost <strong>of</strong> the Prototype over the regional standard practice, <strong>in</strong>clud<strong>in</strong>g rebates<br />
and <strong>in</strong>centives, is subtracted from the utility bill reduction over this reference the result shows a<br />
net positive cash flow <strong>of</strong> $182.48 per year when the PV system is excluded from the analysis.<br />
When the PV system is <strong>in</strong>cluded, the result shows a negative cash flow <strong>of</strong> $30.05 per year.<br />
The 1772 sq. foot NZEH home sale price was $306,000. However, it must be said that the<br />
premium cost <strong>of</strong> the various components and equipment, likely add about $15-$20 /square foot<br />
to the f<strong>in</strong>al sales price– depend<strong>in</strong>g on whether special price accommodation is available as with<strong>in</strong><br />
our prototype project.
Measure<br />
Build<strong>in</strong>g Enclosure<br />
Table A1. Incremental and Amortized Cost <strong>of</strong> Improvements<br />
Regional Standard<br />
Practice Schackow NZEH<br />
Incremental<br />
Cost<br />
Amortized<br />
Annual Cost<br />
Ro<strong>of</strong><strong>in</strong>g sh<strong>in</strong>gle<br />
selective metal sh<strong>in</strong>gles<br />
and radiant barrier $ 3,000.00 $ 239.40<br />
W<strong>in</strong>dows double pane clear <strong>Energy</strong> Star Low-E $ - $<br />
-<br />
Wall Insulation<br />
Envelope and Duct<br />
fiberglass batts R-13 cellulose $ 300.00 $ 23.94<br />
Seal<strong>in</strong>g<br />
HVAC System<br />
standard<br />
SEER 13 a/c/ 80%<br />
mastic and caulk $ 350.00 $ 27.93<br />
Heat<strong>in</strong>g/Cool<strong>in</strong>g system furnace seer 19 a/c, 95%furnace $ 4,000.00 $ 319.20<br />
Fresh Air Ventilation none runtime vent system $ 150.00 $ 11.97<br />
Appliances standard <strong>Energy</strong> Star $ 1,000.00 $ 79.80<br />
Light<strong>in</strong>g<br />
Total <strong>Energy</strong><br />
<strong>in</strong>candescent compact fluorescent $ 110.00 $<br />
8.78<br />
Efficiency Investment<br />
Solar Systems<br />
PV system and<br />
$ 8,910.00 $ 711.02<br />
<strong>in</strong>stallation none 3.15kW $ 25,200.00 $ 2,010.96<br />
Dra<strong>in</strong>back Solar DHW none <strong>in</strong>stalled $ 5,000.00 $ 399.00<br />
Total with Solar<br />
Rat<strong>in</strong>gs, Rebates and<br />
Incentives<br />
HERS rat<strong>in</strong>g and Tax<br />
$ 39,110.00 $ 3,120.98<br />
Credit certification<br />
Federal New <strong>Home</strong> Tax<br />
none received $ 500.00 $ 39.90<br />
Credit<br />
State <strong>of</strong> Florida PV<br />
none received $ (2,000.00) $ (159.60)<br />
rebate none received $ (13,100.00) $ (1,045.38)<br />
Federal Tax Credits none $ (6,622.50) $ (528.48)<br />
Utility Rebate for Solar<br />
Cost to Builder w/o<br />
none received $ (3,150.00) $ (251.37)<br />
Solar<br />
Total Incremental<br />
Cost to Builder w/<br />
$ 7,410.00 $ 591.32<br />
Solar $ 14,737.50 $<br />
1,176.05
Table A2. Neutral Cost Analysis for the Schackow NZEH Us<strong>in</strong>g Source <strong>Energy</strong> Sav<strong>in</strong>gs<br />
Description BA Bench<br />
Table A3. Neutral Cost Analysis for the Schackow NZEH Us<strong>in</strong>g Site <strong>Energy</strong> Sav<strong>in</strong>gs<br />
Description<br />
BA<br />
Bench<br />
Regional<br />
Standard<br />
Practice<br />
Prototype<br />
House<br />
End Use Mbtu/y Mbtu/y Mbtu/y<br />
Annual Source <strong>Energy</strong> Estimated Source <strong>Energy</strong> Sav<strong>in</strong>gs<br />
Regional<br />
Standard<br />
Practice<br />
Annual Site <strong>Energy</strong><br />
Prototype<br />
House<br />
End Use Mbtu/y Mbtu/y Mbtu/y<br />
vs. BA<br />
Bench<br />
vs.<br />
Standard<br />
Percent <strong>of</strong> End Use Percent <strong>of</strong> Total<br />
vs. BA<br />
Bench<br />
Estimated Site <strong>Energy</strong> Sav<strong>in</strong>gs<br />
Percent <strong>of</strong> End Use Percent <strong>of</strong> Total<br />
vs. BA<br />
Bench<br />
vs.<br />
Standard<br />
vs.<br />
Standard<br />
vs. BA<br />
Bench<br />
Annual Utility Bill<br />
Reduction<br />
Prototype<br />
WRT<br />
Benchmark<br />
Prototype<br />
WRT<br />
Standard<br />
Space Heat<strong>in</strong>g 24 19.2 13.8 43% 28% 12% 7% $177.00 $96.00<br />
Space Cool<strong>in</strong>g 23.1 10.6 3.6 84% 66% 22% 9% $684.00 $244.00<br />
DHW 9.9 15.3 1.4 86% 91% 10% 18% $258.00 $173.00<br />
Light<strong>in</strong>g 7.6 7.9 2.6 66% 67% 6% 7% $174.00 $183.00<br />
Appl. & MEL 23 23 21.8 5% 5% 1% 2% $45.71 $40.00<br />
Ceil<strong>in</strong>g Fan 0.5 0.5 0.5 0% 0% 0% 0% $0.00 $0.00<br />
OA Vent Fan 0.1 0.1 1.4 -1300% -1300% -1% 0% -$45.00 -$42.00<br />
Total Usage 88.2 76.6 45.1 49% 41% 49% 41% $1,293.71 $694.00<br />
Site Generation 0 0 -12.85 15% 17% $452.00 $452.00<br />
Net <strong>Energy</strong> Use 88.2 76.6 32.3 63% 58% 63% 58% $1,745.71 $1,146.00<br />
Added Annual Mortgage Cost w/o Solar<br />
Impact on Mortgage from Incentives and Rebates w/o Solar<br />
Net Annual Cash Flow w/o Solar<br />
Added Annual Mortgage Cost w/ Solar<br />
Impact on Mortgage from Incentives and Rebates w/ Solar<br />
Net Annual Cash Flow w/ Solar<br />
vs.<br />
Standard<br />
Space Heat<strong>in</strong>g 27.3 22 15.8 42% 28% 5% 4%<br />
Space Cool<strong>in</strong>g 77.8 35.6 12.2 84% 66% 30% 15%<br />
DHW 33.3 16.7 4.8 86% 71% 13% 8%<br />
Light<strong>in</strong>g 25.6 26.4 8.9 65% 66% 8% 11%<br />
Appl. & MEL 52.6 52.6 48.8 7% 7% 2% 2%<br />
Ceil<strong>in</strong>g Fan 1.6 1.6 1.6 0% 0% 0% 0%<br />
OA Vent Fan 0.3 0.3 4.6 -1433% -1433% -2% 0%<br />
Total Usage 218.5 155.2 96.7 56% 38% 56% 38%<br />
Site Generation 0 0 -43.2 20% 28%<br />
Net <strong>Energy</strong> Use 218.5 155.2 53.5 76% 66% 76% 66%<br />
$711.02<br />
-$199.50<br />
$182.48<br />
$3,120.98<br />
-$1,944.93<br />
-$30.05
Gaps Analysis /Lessons Learned<br />
A number <strong>of</strong> lessons were learned with<strong>in</strong> the NZEH project:<br />
Two stage SEER 19 cool<strong>in</strong>g equipment worked exceed<strong>in</strong>gly well provid<strong>in</strong>g good comfort<br />
with low power.<br />
Advanced construction techniques <strong>in</strong> the project were successful at reduc<strong>in</strong>g heat<strong>in</strong>g and<br />
cool<strong>in</strong>g loads: good <strong>in</strong>sulation and w<strong>in</strong>dows with an attic radiant barrier and low solar<br />
absorptance metal ro<strong>of</strong><strong>in</strong>g system with <strong>in</strong>terior ducts<br />
West fac<strong>in</strong>g 80 ft 2 solar water heat<strong>in</strong>g system worked well, provid<strong>in</strong>g 100% <strong>of</strong> summer water<br />
heat<strong>in</strong>g and likely 90% for the overall year.However, pump power for the dra<strong>in</strong>-down solar<br />
water heat<strong>in</strong>g system was large enough (~1 kWh per day) that efforts should be made to use<br />
a downsized pump, or even better, variable speed pumps for future projects to reduce this<br />
consumption.<br />
Occupants were able to use energy feedback device to control miscellaneous electric loads so<br />
that they were nearly half the typical consumption level.<br />
Pre-occupancy standby loads <strong>of</strong> the HVAC controls, garage door opener, GFI and kitchen<br />
electronics was approximately 50 Watts or 10% <strong>of</strong> total daily consumption<br />
Shad<strong>in</strong>g <strong>of</strong> PV system and solar water heat<strong>in</strong>g systems should be carefully evaluated for<br />
future projects.<br />
AC unit crankcase heater draws 55 W when outdoor temperature is less than 65 o F.In<br />
Ga<strong>in</strong>esville such a system will use a lot <strong>of</strong> energy when no space cool<strong>in</strong>g is needed. For<br />
<strong>in</strong>stance, <strong>in</strong> an average year there are 2231 hours <strong>in</strong> Ga<strong>in</strong>esville with outdoor temperatures<br />
less then 60 o F – imply<strong>in</strong>g a waste <strong>of</strong> 128 kWh/year.<br />
Identified gaps with<strong>in</strong> the research process:<br />
Need low standby energy products for hardwired items <strong>in</strong> a ZEH (doorbells, garage door<br />
openers, appliances and HVAC electronics).<br />
Solar access and orientation should have a priority for ZEH projects.<br />
Need variable speed pump for pump<strong>in</strong>g dra<strong>in</strong>-down water heat<strong>in</strong>g systems which have a high<br />
<strong>in</strong>itial head capability need and then low pump power for cont<strong>in</strong>uous circulation.<br />
<strong>Home</strong> construction had an excess <strong>of</strong> wall fram<strong>in</strong>g that should be tackled <strong>in</strong> future projects to<br />
reduce wood use, save on first cost and improve thermal performance.<br />
Need high efficiency AC units that allow the crankcase heater to be deactivated when<br />
outdoor temperatures are less than 40 o F.<br />
Quality Assurance<br />
Quality assurance with<strong>in</strong> the project has been adequately achieved. The builder, Trunnell<br />
Construction effectively followed up on a number <strong>of</strong> unusual construction and specification<br />
issues. The FL H.E.R.O. organization was available on site dur<strong>in</strong>g the construction process to<br />
provide attention to several details that were otherwise difficult or prone to improper <strong>in</strong>stallation.<br />
This resulted <strong>in</strong> corrections with<strong>in</strong> the construction process: proper w<strong>in</strong>dow specification, better<br />
build<strong>in</strong>g air tightness and correction to several <strong>in</strong>sulation details.<br />
City arbor ord<strong>in</strong>ances have made tree removal difficult <strong>in</strong> ways that were not foreseen before<br />
construction. Removal <strong>of</strong> two trees will significantly improve the PV output <strong>of</strong> this house.
Appendix B<br />
Build<strong>in</strong>g America Benchmark Analysis<br />
Simulation Runs (<strong>Energy</strong>Gauge USA)
PROJECT<br />
Title:<br />
RSfc-2-danny2-12-09<br />
Bedrooms:<br />
3<br />
Build<strong>in</strong>g Type: User Bathrooms: 2<br />
Owner: New home<br />
Conditioned Area: 1772<br />
# <strong>of</strong> Units: 1<br />
Total Stories: 1<br />
Builder Name: Richard Schackow<br />
Worst Case: No<br />
Permit Office:<br />
Rotate Angle: 0<br />
Jurisdiction:<br />
Cross Ventilation:<br />
Family Type: S<strong>in</strong>gle-family<br />
Whole House Fan:<br />
New/Exist<strong>in</strong>g:<br />
Comment:<br />
New (Confirmed)<br />
CLIMATE<br />
Adress Type:<br />
Lot #<br />
SubDivision:<br />
PlatBook:<br />
Street:<br />
County:<br />
City, State, Zip:<br />
Street Address<br />
2<br />
Forest Creek<br />
1650 NW 34th Ave<br />
Alachua<br />
Ga<strong>in</strong>esville ,<br />
FL , 32601-<br />
Design<br />
Design Temp Int Design Temp Heat<strong>in</strong>g Design Daily Temp<br />
Location Tmy Site<br />
97.5 % 2.5 % W<strong>in</strong>ter Summer Degree Days Moisture Range<br />
FL, Ga<strong>in</strong>esville<br />
FL_GAINESVILLE_REGIONAL_AP<br />
32<br />
UTILITY RATES<br />
92 70 75 1305.5 51 Medium<br />
Fuel Unit Utility Name Monthly Fixed Cost $/Unit<br />
Electricity kWh<br />
Natural Gas Therm<br />
Fuel Oil Gallon<br />
Propane Gallon<br />
MyFloridaAverage 0<br />
0.12<br />
Florida Average 0 1.72<br />
Florida Default 0 1.1<br />
Florida Default 0 1.4<br />
SURROUNDINGS<br />
Shade Trees Adjacent Build<strong>in</strong>gs<br />
Ornt Type Height Width Distance Exist Height Width Distance<br />
N<br />
NE<br />
E<br />
SE<br />
S<br />
SW<br />
W<br />
NW<br />
None<br />
None<br />
None<br />
None<br />
None<br />
None<br />
None<br />
None<br />
0 ft 0 ft 0 ft 0 ft 0 ft 0 ft<br />
0 ft 0 ft 0 ft 0 ft 0 ft 0 ft<br />
0 ft 0 ft 0 ft 0 ft 0 ft 0 ft<br />
0 ft 0 ft 0 ft 0 ft 0 ft 0 ft<br />
0 ft 0 ft 0 ft 0 ft 0 ft 0 ft<br />
0 ft<br />
0 ft 0 ft 0 ft 0 ft 0 ft<br />
0 ft 0 ft 0 ft 0 ft 0 ft 0 ft<br />
0 ft 0 ft 0 ft 0 ft 0 ft 0 ft<br />
FLOORS<br />
# Floor Type Perimeter R-Value Area Tile Wood Carpet<br />
1 Slab-On-Grade Edge Insulatio 221 ft 0<br />
1772 ft² 0.8 0 0.2<br />
ROOF<br />
Ro<strong>of</strong> Gable Ro<strong>of</strong> Solar Deck<br />
# Type Materials Area Area Color Absor. Tested Insul. Pitch<br />
1 Hip Metal 1982 ft² 0 ft² Light 0.65 No 0 26.6 deg<br />
ATTIC<br />
# Type Ventilation Vent Ratio (1 <strong>in</strong>) Area RBS IRCC<br />
1 Full attic Vented 300 1772 ft² Y N<br />
2/12/2009 5:34 PM<br />
Build<strong>in</strong>g Input Summary Report<br />
<strong>Energy</strong>Gauge® / USRRIB v2.8<br />
Page 1 <strong>of</strong> 4
CEILING<br />
# Ceil<strong>in</strong>g Type R-Value Area Fram<strong>in</strong>g Fraction Truss Type<br />
1 Under Attic (Vented) 30 1772 ft² 0.11 Wood<br />
WALLS<br />
Wall orientation below is as entered. Actual orientation is modified by rotate angle shown <strong>in</strong> "Project" section above.<br />
Adjacent Cavity Width Height<br />
Sheath<strong>in</strong>g Fram<strong>in</strong>g Solar<br />
# Ornt To Wall Type R-Value Ft In Ft In Area R-Value Fraction Absor.<br />
1 N Exterior Frame - Wood<br />
13 45.67 0 9 0 411.03 ft² 0 0.23 0.5<br />
2 W Exterior Frame - Wood<br />
13 57.33 0 9 0 515.97 ft² 0 0.23 0.5<br />
3 E Exterior Frame - Wood<br />
13 43 0 9 0 387 ft² 0 0.23 0.5<br />
4 S Exterior Frame - Wood<br />
13 29 0 9 0 261 ft² 0 0.23 0.5<br />
5 NE Exterior Frame - Wood<br />
13 4 0 9 0 36 ft² 0<br />
0.5<br />
6 S Garage Frame - Wood<br />
13 20 9<br />
180 ft² 0 0.23 0.5<br />
7 E Garage Frame - Wood<br />
13 16 9<br />
144 ft² 0 0.23 0.5<br />
8 W Garage Frame - Wood<br />
13 4 9<br />
36 ft² 0 0.23 0.5<br />
DOORS<br />
Width Height<br />
# Ornt Door Type Storms<br />
U-Value Ft In Ft In Area<br />
1 Insulated None 0.29 3 0 6.67 0 20.01 ft²<br />
2 E Insulated None<br />
0.29 2.67 0 6.67 0 17.81 ft²<br />
WINDOWS<br />
Overhang<br />
# Ornt Frame Panes NFRC U-Factor SHGC Storm Area Depth Separation Interior Shade Screen<strong>in</strong>g<br />
1 V<strong>in</strong>yl Low-E Double Yes 0.34 0.28 N 32.04 ft² 1.5 ft 0 <strong>in</strong> 1.5 ft 0 <strong>in</strong> Drapes/bl<strong>in</strong>ds Exterior 50%<br />
2 V<strong>in</strong>yl Low-E Double Yes 0.34 0.28 N 20.01 ft² 15 ft 0 <strong>in</strong> 1.5 ft 0 <strong>in</strong> Drapes/bl<strong>in</strong>ds Exterior 100%<br />
3 V<strong>in</strong>yl Low-E Double Yes 0.34 0.28 N 16 ft² 1.5 ft 0 <strong>in</strong> 1.5 ft 0 <strong>in</strong> Drapes/bl<strong>in</strong>ds None<br />
4 V<strong>in</strong>yl Low-E Double Yes 0.34 0.28 N 54 ft² 9 ft 0 <strong>in</strong> 1.5 ft 0 <strong>in</strong> Drapes/bl<strong>in</strong>ds Exterior 100%<br />
5 V<strong>in</strong>yl Low-E Double Yes 0.34 0.28 N 20.01 ft² 7 ft 0 <strong>in</strong> 2 ft 0 <strong>in</strong> Drapes/bl<strong>in</strong>ds Exterior 100%<br />
6 V<strong>in</strong>yl Low-E Double Yes 0.34 0.28 N 36 ft² 1.5 ft 0 <strong>in</strong> 1.5 ft 0 <strong>in</strong> Drapes/bl<strong>in</strong>ds Exterior 50%<br />
7 V<strong>in</strong>yl Low-E Double Yes 0.34 0.28 N 16 ft² 1.5 ft 0 <strong>in</strong> 1.5 ft 0 <strong>in</strong> Drapes/bl<strong>in</strong>ds Exterior 50%<br />
8 V<strong>in</strong>yl Low-E Double Yes 0.34 0.28 N 15 ft² 1.5 ft 0 <strong>in</strong> 1.5 ft 0 <strong>in</strong> Drapes/bl<strong>in</strong>ds Exterior 50%<br />
9 V<strong>in</strong>yl Low-E Double Yes 0.34 0.28 N 32.04 ft² 1.5 ft 0 <strong>in</strong> 1.5 ft 0 <strong>in</strong> Drapes/bl<strong>in</strong>ds Exterior 50%<br />
10 S V<strong>in</strong>yl Low-E Double Yes 0.34 0.28 N 32.04 ft² 6 ft 0 <strong>in</strong> 1.5 ft 0 <strong>in</strong> Drapes/bl<strong>in</strong>ds Exterior 50%<br />
INFILTRATION & VENTING<br />
---- Forced Ventilation ---- Terra<strong>in</strong>/W<strong>in</strong>d<br />
Method SLA CFM 50 ELA EqLA ACH ACH 50 Supply Exhaust Run Time Shield<strong>in</strong>g<br />
Tested Multi Po<strong>in</strong>t BD<br />
2/12/2009 5:34 PM<br />
Build<strong>in</strong>g Input Summary Report<br />
0.00016 825 39.6 78.1 0.119 3.10 29 0 0 Suburban / Suburban<br />
<strong>Energy</strong>Gauge® / USRRIB v2.8<br />
Page 2 <strong>of</strong> 4
GARAGE<br />
# Floor Area Ro<strong>of</strong> Area Exposed Wall Perimeter Avg. Wall Height Exposed Wall Insulation<br />
1 447.26 ft² 447.26 ft² 56 ft 9 ft 1<br />
MASS<br />
Mass Type Area Thickness Furniture Fraction<br />
No Added Mass 0 ft² 0 ft 0.3<br />
COOLING SYSTEM<br />
# System Type Subtype<br />
Efficiency Capacity Air Flow SHR Ductless<br />
1 Central Unit None<br />
SEER: 19 26 kBtu/hr 780 cfm 0.75 False<br />
HEATING SYSTEM<br />
# System Type Subtype<br />
Efficiency Capacity<br />
1 Natural Gas Furnace None<br />
AFUE: 0.95 56 kBtu/hr<br />
HOT WATER SYSTEM<br />
Ductless<br />
# System Type EF Cap Use SetPnt Credits<br />
1 Electric 0.9 120 gal 60 gal 120 deg Solar System<br />
Collector Type<br />
SOLAR HOT WATER<br />
Collector<br />
Surface Absorp. Trans<br />
Tilt Azimuth Area Loss Coef. Prod. Corr.<br />
Tank<br />
Volume<br />
Tank<br />
U-Value<br />
Tank<br />
Surf Area<br />
Heat<br />
Exch Eff<br />
PV<br />
Pumped<br />
Flat Plate (Closed Loop) 26.6 270 7.43 m² 4.91 W/m² 0.71 0.96 454.0 L 0.700 W/m²/C 2.32 m² 0.88 No 120 W<br />
---- Supply ---- ---- Return ----<br />
# Location R-Value Area Location Area<br />
DUCTS<br />
Number<br />
Leakage Type<br />
Air<br />
Handler CFM 25<br />
Percent<br />
Leakage<br />
Pump<br />
<strong>Energy</strong><br />
QN RLF<br />
1 Interior 6 134 ft² Interior 24 ft² 1 Duct Tester Results Interior 39.00 cfm 3.48 % 0.02 0.60<br />
Programable Thermostat: Y Ceil<strong>in</strong>g Fans: Y<br />
TEMPERATURES<br />
Cool<strong>in</strong>g [X] Jan [X] Feb [X] Mar [X] Apr [X] May [X] Jun [X] Jul [X] Aug [X] Sep [X] Oct [X] Nov [X] Dec<br />
Heat<strong>in</strong>g [X] Jan [X] Feb [X] Mar [X] Apr [X] May [X] Jun [X] Jul [X] Aug [X] Sep [X] Oct [X] Nov [X] Dec<br />
Vent<strong>in</strong>g [X] Jan [X] Feb [X] Mar [X] Apr [X] May [X] Jun [X] Jul [X] Aug [X] Sep [X] Oct [X] Nov [X] Dec<br />
Thermostat Schedule: HERS 2006 Reference Hours<br />
Schedule Type 1 2 3 4 5 6 7 8 9 10 11 12<br />
Cool<strong>in</strong>g (WD) AM<br />
PM<br />
Cool<strong>in</strong>g (WEH) AM<br />
PM<br />
Heat<strong>in</strong>g (WD) AM<br />
PM<br />
Heat<strong>in</strong>g (WEH) AM<br />
PM<br />
2/12/2009 5:34 PM<br />
Build<strong>in</strong>g Input Summary Report<br />
78.5<br />
80.5<br />
78.5<br />
78.5<br />
66<br />
68<br />
66<br />
68<br />
78.5<br />
80.5<br />
78.5<br />
78.5<br />
66<br />
68<br />
66<br />
68<br />
78.5<br />
78.5<br />
78.5<br />
78.5<br />
66<br />
68<br />
66<br />
68<br />
78.5<br />
78.5<br />
78.5<br />
78.5<br />
66<br />
68<br />
66<br />
68<br />
78.5<br />
78.5<br />
78.5<br />
78.5<br />
66<br />
68<br />
66<br />
68<br />
78.5<br />
78.5<br />
78.5<br />
78.5<br />
68<br />
68<br />
68<br />
68<br />
<strong>Energy</strong>Gauge® / USRRIB v2.8<br />
78.5<br />
78.5<br />
78.5<br />
78.5<br />
68<br />
68<br />
68<br />
68<br />
78.5<br />
78.5<br />
78.5<br />
78.5<br />
68<br />
68<br />
68<br />
68<br />
80.5<br />
78.5<br />
78.5<br />
78.5<br />
68<br />
68<br />
68<br />
68<br />
80.5<br />
78.5<br />
78.5<br />
78.5<br />
68<br />
68<br />
68<br />
68<br />
80.5<br />
78.5<br />
78.5<br />
78.5<br />
68<br />
66<br />
68<br />
66<br />
80.5<br />
78.5<br />
78.5<br />
78.5<br />
68<br />
66<br />
68<br />
66<br />
Page 3 <strong>of</strong> 4
APPLIANCES & LIGHTING<br />
Appliance Schedule: HERS 2006 Reference<br />
Schedule Type 1 2 3 4 5 6<br />
Hours<br />
7 8 9 10 11 12<br />
Ceil<strong>in</strong>g Fans (Summer) AM 0.65 0.65 0.65 0.65 0.65 0.65 0.65 0.33 0.33 0.33 0.33 0.33<br />
% Released: 100<br />
Annual Use: 652 kWh/Yr<br />
PM 0.33 0.33 0.33 0.33 0.33 1 0.9 0.9 0.9 0.9 0.9 0.65<br />
Peak Value: 128 Watts<br />
Clothes Washer AM 0.105 0.081 0.046 0.046 0.081 0.128 0.256 0.57 0.849 1 0.977 0.872<br />
% Released: 60<br />
Annual Use: 32 kWh/Yr<br />
PM 0.779 0.698 0.605 0.57 0.581 0.57 0.57 0.57 0.57 0.488 0.43 0.198<br />
Peak Value: 8 Watts<br />
Dishwasher AM 0.139 0.05 0.028 0.024 0.029 0.09 0.169 0.303 0.541 0.594 0.502 0.443<br />
% Released: 60<br />
Annual Use: 157 kWh/Yr<br />
PM 0.377 0.396 0.335 0.323 0.344 0.448 0.791 1 0.8 0.597 0.383 0.281<br />
Peak Value: 48 Watts<br />
Dryer AM 0.2 0.1 0.05 0.05 0.05 0.075 0.2 0.375 0.5 0.8 0.95 1<br />
% Released: 10 PM 0.875 0.85 0.8 0.625 0.625 0.6 0.575 0.55 0.625 0.7 0.65 0.375<br />
Annual Use: 44 Therms/Yr<br />
Peak Value: 1 kBTU/Hr<br />
Light<strong>in</strong>g AM 0.16 0.15 0.16 0.18 0.23 0.45 0.4 0.26 0.19 0.16 0.12 0.11<br />
% Released: 90 PM 0.16 0.17 0.25 0.27 0.34 0.55 0.55 0.88 1 0.86 0.51 0.28<br />
Annual Use: 633 kWh/Yr<br />
Peak Value: 207 Watts<br />
Miscellaneous AM 0.48 0.47 0.47 0.47 0.47 0.47 0.64 0.71 0.67 0.61 0.55 0.53<br />
% Released: 90 PM 0.52 0.5 0.5 0.5 0.59 0.73 0.79 0.99 1 0.96 0.77 0.55<br />
Annual Use: 1900 kWh/Yr<br />
Peak Value: 348 Watts<br />
Pool Pump AM 0 0 0 0 0 0 0 0 0 1 1 1<br />
% Released: 0<br />
PM 1 1 1 1 0 0 0 0 0 0 0 0<br />
Annual Use: 0 kWh/Yr<br />
Peak Value: 0 Watts<br />
Range AM 0.057 0.057 0.057 0.057 0.057 0.114 0.171 0.286 0.343 0.343 0.343 0.4<br />
% Released: 100 PM 0.457 0.343 0.286 0.4 0.571 1 0.857 0.429 0.286 0.229 0.171 0.114<br />
Annual Use: 24 Therms/Yr<br />
Peak Value: 1 kBTU/Hr<br />
Refrigeration AM 0.85 0.78 0.75 0.73 0.73 0.73 0.75 0.75 0.8 0.8 0.8 0.8<br />
% Released: 100 PM 0.88 0.85 0.85 0.83 0.88 0.95 1 0.98 0.95 0.93 0.9 0.85<br />
Annual Use: 456 kWh/Yr<br />
Peak Value: 62 Watts<br />
Well Pump AM 0.05 0.05 0.05 0.05 0.05 0.05 0.1 0.1 0.1 0.1 0.1 0.1<br />
% Released: 0<br />
PM 0.1 0.1 0.1 0.1 0.1 0.1 0.1 0.1 0.1 0.1 0.1 0.1<br />
Annual Use: 0 kWh/Yr<br />
Peak Value: 0 Watts<br />
PHOTOVOLTAICS<br />
Array Type Azimuth Tilt L<strong>in</strong>e Loss Eff Coeff Inverter Type Battery Type Capacity<br />
Conergy S175mu 270 23 0.0035 0.0048 Sunnyboy None k W h<br />
2/12/2009 5:34 PM<br />
Build<strong>in</strong>g Input Summary Report<br />
<strong>Energy</strong>Gauge® / USRRIB v2.8<br />
Page 4 <strong>of</strong> 4
New home<br />
1650 NW 34th Ave<br />
Ga<strong>in</strong>esville, FL 32601-<br />
Build<strong>in</strong>g America<br />
Site <strong>Energy</strong> Summary 2008<br />
Project Title:<br />
RSfc-2-danny2-12-09<br />
Climate: FL_GAINESVILLE_REGIONAL_<br />
2/12/2009<br />
_______________ End Use: __________________________________ Benchmark __________________________________ Prototype ________ Sav<strong>in</strong>gs<br />
kWh Therm Gal MBTU Cost kWh Therm Gal MBTU Cost Site<br />
Total Space Heat<strong>in</strong>g: 152 234 0 23.928 420 92 135 0 13.824 243 42.2%<br />
Heat<strong>in</strong>g: 0 234 0 23.409 402 0 135 0 13.510 232<br />
Heat<strong>in</strong>g Fan: 152 0 0 0.519 18 92 0 0 0.314 11<br />
Total Space Cool<strong>in</strong>g: 6773 0 0 23.109 812 1065 0 0 3.634 128 84.3%<br />
Cool<strong>in</strong>g: 5812 0 0 20 697 826 0 0 3 99<br />
Cool<strong>in</strong>g Fan: 961 0 0 3.279 115 239 0 0 0.815 29<br />
Total Hot Water: 2900 0 0 9.894 348 420 0 0 1.432 90 85.5%<br />
Light<strong>in</strong>g Subtotal: 2226 0 0 7.595 267 776 0 0 2.647 93 65.1%<br />
Wired Light<strong>in</strong>g: 1851 0 0 6.317 222 645 0 0 2.201 77 65.2%<br />
Plug Light<strong>in</strong>g: 375 0 0 1.278 45 131 0 0 0.446 16 65.1%<br />
Appliance Subtotal: 3549 109 0 22.985 604 3213 109 0 21.839 564 5.0%<br />
Refrigerator: 669 0 0 2.283 80 455 0 0 1.552 55 32.0%<br />
ClothesWasher: 105 0 0 0.358 13 32 0 0 0.109 4 69.5%<br />
ClothesDryer: 76 53 0 5.560 91 76 53 0 5.560 91 0.0%<br />
Dishwasher: 206 0 0 0.703 25 157 0 0 0.536 19 23.8%<br />
Cook<strong>in</strong>g: 0 45 0 4.500 77 0 45 0 4.500 77 0.0%<br />
Other Appls: 2493 11 0 9.582 318 2493 11 0 9.582 318 0.0%<br />
Ceil<strong>in</strong>g Fan: 146 0 0 0.498 18 146 0 0 0.498 18 0.0%<br />
OAVentilation Fan: 23 0 0 0.078 3 400 0 0 1.365 48 -1639.1%<br />
__________________________________________________________________________________________________________________________<br />
Total: 15769 343 0 88.088 2454 6111 244 0 45.239 1166 48.6%<br />
Generation(PV): 0 0 0 0 0 -3766 0 0 -12.850 -452<br />
Net: 15769 343 0 88.088 2454 2345 244 0 32.390 714 63.2%<br />
<strong>Energy</strong>Gauge USA 2.8 page 1
New home<br />
1650 NW 34th Ave<br />
Ga<strong>in</strong>esville, FL 32601-<br />
Build<strong>in</strong>g America<br />
Source <strong>Energy</strong> Summary 2008<br />
Project Title:<br />
RSfc-2-danny2-12-09<br />
Climate: FL_GAINESVILLE_REGIONAL_<br />
2/12/2009<br />
_______________ End Use: __________________________________ Benchmark __________________________________ Prototype ________ Sav<strong>in</strong>gs<br />
kWh Therm Gal MBTU Cost kWh Therm Gal MBTU Cost Source<br />
Total Space Heat<strong>in</strong>g: 152 234 0 27.308 420 92 135 0 15.809 243 42.1%<br />
Heat<strong>in</strong>g: 0 234 0 25.563 402 0 135 0 14.753 232<br />
Heat<strong>in</strong>g Fan: 152 0 0 1.745 18 92 0 0 1.056 11<br />
Total Space Cool<strong>in</strong>g: 6773 0 0 77.763 812 1065 0 0 12.228 128 84.3%<br />
Cool<strong>in</strong>g: 5812 0 0 67 697 826 0 0 9 99<br />
Cool<strong>in</strong>g Fan: 961 0 0 11.034 115 239 0 0 2.744 29<br />
Total Hot Water: 2900 0 0 33.294 348 420 0 0 4.820 90 85.5%<br />
Light<strong>in</strong>g Subtotal: 2226 0 0 25.557 267 776 0 0 8.908 93 65.1%<br />
Wired Light<strong>in</strong>g: 1851 0 0 21.257 222 645 0 0 7.407 77 65.2%<br />
Plug Light<strong>in</strong>g: 375 0 0 4.300 45 131 0 0 1.501 16 65.1%<br />
Appliance Subtotal: 3549 109 0 52.622 604 3213 109 0 48.765 564 7.3%<br />
Refrigerator: 669 0 0 7.681 80 455 0 0 5.224 55 32.0%<br />
ClothesWasher: 105 0 0 1.206 13 32 0 0 0.367 4 69.5%<br />
ClothesDryer: 76 53 0 6.661 91 76 53 0 6.661 91 0.0%<br />
Dishwasher: 206 0 0 2.365 25 157 0 0 1.803 19 23.8%<br />
Cook<strong>in</strong>g: 0 45 0 4.914 77 0 45 0 4.914 77 0.0%<br />
Other Appls: 2493 11 0 29.795 318 2493 11 0 29.795 318 0.0%<br />
Ceil<strong>in</strong>g Fan: 146 0 0 1.574 18 146 0 0 1.574 18 0.0%<br />
OAVentilation Fan: 23 0 0 0.264 3 400 0 0 4.593 48 -1639.1%<br />
__________________________________________________________________________________________________________________________<br />
Total: 15769 343 0 218.48 2454 6111 244 0 96.798 1166 55.7%<br />
Generation(PV): 0 0 0 0 0 -3766 0 0 -43.239 -452<br />
Net: 15769 343 0 218.48 2454 2345 244 0 53.559 714 75.5%<br />
<strong>Energy</strong>Gauge USA 2.8 page 2
FORM FRBER-2006<br />
Confirmed Rat<strong>in</strong>g<br />
New home<br />
1650 NW 34th Ave<br />
Ga<strong>in</strong>esville, FL 32601- Title: RSfc-2-danny2-12-09<br />
$0<br />
Design: Ga<strong>in</strong>esville, FL<br />
TMY: GAINESVILLE_REGIONAL_AP, FL<br />
BUILDING ENERG RATING GUIDE<br />
3<br />
$616<br />
0 MBtu<br />
Cool<strong>in</strong>g<br />
Heat<strong>in</strong>g<br />
Hot Water<br />
Ceil. Fan<br />
Dishwash<br />
Dryer<br />
Light<strong>in</strong>g<br />
Misc.<br />
Pumps<br />
Range<br />
Refrig.<br />
28.7 MBtu<br />
Reference<br />
$1868<br />
67 MBtu<br />
Proposed <strong>Home</strong><br />
Cost Basis:<br />
MyFloridaAverage Electric Rate: $0.120 /kWh<br />
Florida Average Gas Rate: $1.720 /Therm<br />
Sav<strong>in</strong>gs = $1252 Statewide Prices Oil: $1.50/gal LP Gas: $1.75/gal<br />
PV<br />
This <strong>Home</strong> may Qualify for EPA's <strong>Energy</strong> Star Label 1<br />
This <strong>Home</strong> Qualifies for an <strong>Energy</strong> Efficient Mortgage (EEM)<br />
$87<br />
$155<br />
$116<br />
$53<br />
$19<br />
$76<br />
$106<br />
$41<br />
$55<br />
($452)<br />
HERS Index :<br />
2<br />
$360<br />
29<br />
Ken Fonorow 292<br />
Certified Rater I.D. Number<br />
Signature Date<br />
This Rat<strong>in</strong>g Guide is provided to you by a <strong>Home</strong> <strong>Energy</strong> Rater<br />
who is tra<strong>in</strong>ed and certified to perform Rat<strong>in</strong>gs <strong>in</strong> accordance<br />
with the RESNET standard. Questions or compla<strong>in</strong>ts regard<strong>in</strong>g<br />
this Rat<strong>in</strong>g may be directed to:<br />
<strong>Energy</strong>Gauge Program Office<br />
1679 Clearlake Road<br />
Cocoa, FL 32922-5703<br />
(321)638-1492<br />
engauge@fsec.ucf.edu<br />
NOTES:<br />
1<br />
The home builder must have signed a Memorandum <strong>of</strong> Understand<strong>in</strong>g with EPA as an <strong>Energy</strong> Star <strong>Home</strong>s partner.<br />
2<br />
HERS Index calculated <strong>in</strong> accordance with 2006 RESNET standard, Section 303.2 (Reference home = 100, <strong>Zero</strong> energy use = 0).<br />
3<br />
PV production assumes net meter<strong>in</strong>g.<br />
2/12/2009 5:35:07 PM <strong>Energy</strong>Gauge® / USRRIB v2.8<br />
Page 1/1
New home Title: RSfc-2-F<strong>in</strong>al_2_12_09 TMY City: FL_GAINESVILLE_R<br />
1650 NW 34th Ave<br />
Ga<strong>in</strong>esville, FL, 32601-<br />
User<br />
Elec Util: MyFloridaAverage<br />
Gas Util: Florida Average<br />
Registration #:<br />
Run Date: 02/12/2009 17:38:01<br />
Size<br />
# m² (ft²)<br />
2/12/2009 5:39 PM<br />
Photovoltaic System <strong>Performance</strong> Summary<br />
Orientation<br />
Degrees<br />
(N=0,E=90)<br />
Photovoltaic System Inputs<br />
Tilt<br />
Degrees<br />
(0 = flat) Array Type # Modules<br />
<strong>Energy</strong>Gauge® / USRRIB v2.8<br />
Array<br />
Rated<br />
Efficiency<br />
Array<br />
Rat<strong>in</strong>g<br />
@STC Wp Inverter Type<br />
Inverter<br />
Rated<br />
Efficiency<br />
1 22.97(247.24) 270 23 Conergy S175mu 18 0.126 3150 Sunnyboy 94 %<br />
Total 22.97(247.24) NA NA NA 18 0.12617 3150 NA<br />
94.0 %<br />
Average Meteorological Data<br />
Horizontal Insolation Ambient Temp. W<strong>in</strong>d Speed<br />
(kWh/m²/Day) ºC (ºF) m/s (mph)<br />
5.14 20.1 (68.1) 3.02 (6.75)<br />
Solar<br />
Insolation POA<br />
# (kWh/m²)<br />
Start Date: January 1 End Date: December 31<br />
Wet Bulb<br />
ºC (ºF)<br />
17.2 (63.0)<br />
Average Daily System <strong>Performance</strong><br />
DC <strong>Energy</strong> Array AC <strong>Energy</strong> Conversion<br />
Overall<br />
AC <strong>Energy</strong>/<br />
(kWh) Efficiency (kWh) Efficiency Rat<strong>in</strong>g/Sun<br />
PV AC to<br />
Avg. Capacity<br />
Factor PV(AC) as<br />
House kWhAC/(24*RatedWp) % <strong>of</strong> HVAC<br />
1 4.59 11.35 10.78 % 10.32 90.9 % 71.4 % 34.91 % 13.6 % 2009.03 %<br />
Total 4.59 11.4 10.80 % 10.3 90.9 % 71.4 % 34.9 % 13.6 % 2.01E3 %<br />
Page 1 <strong>of</strong> 1
Appendix C<br />
Photovoltaic System Site Shad<strong>in</strong>g Analysis and Report
Solar Access and Shade Report for Danny Parker file:///D:/FL_ZEH_Proposal/NZEH_Data/Danny%20Parker%20Report%...<br />
Solar Access and Shade Report<br />
01/28/09<br />
For:<br />
Danny Parker<br />
1650<br />
Ga<strong>in</strong>esville, FL<br />
By:<br />
Andreas<br />
FLorida Solar <strong>Energy</strong> Center<br />
1679 Clearlake Rd<br />
Cocoa, FL 32922<br />
321-638-1000<br />
Measurements made by Solmetric SunEye -- www.solmetric.com<br />
1 <strong>of</strong> 6 1/28/2009 4:32 PM
Solar Access and Shade Report for Danny Parker file:///D:/FL_ZEH_Proposal/NZEH_Data/Danny%20Parker%20Report%...<br />
Session Properties<br />
Name 1650<br />
Creation Date 04/24/08 14:55<br />
Note (none)<br />
Location<br />
Lat: 30°, Lon: -82°<br />
Mag Dec: -5°<br />
Time Zone: GMT-5:00<br />
Solar access averages <strong>of</strong> all skyl<strong>in</strong>es(4) <strong>in</strong> this session<br />
Annual Summer W<strong>in</strong>ter<br />
86% 85% 87%<br />
Skyl<strong>in</strong>es<br />
Sky01 - Lower sw pv corner<br />
Sky02 - Lower middle pv<br />
Sky03 - Lower nw pv corner<br />
Sky04 - Lower sw corner v2<br />
2 <strong>of</strong> 6 1/28/2009 4:32 PM
Solar Access and Shade Report for Danny Parker file:///D:/FL_ZEH_Proposal/NZEH_Data/Danny%20Parker%20Report%...<br />
Sky01 -- 04/24/08 14:59 -- Lower sw pv corner<br />
Panel Orientation: Tilt=30° -- Azimuth=180°<br />
Solar Access: Annual: 82% -- Summer (May-Oct): 80% -- W<strong>in</strong>ter (Nov-Apr): 84%<br />
3 <strong>of</strong> 6 1/28/2009 4:32 PM
Solar Access and Shade Report for Danny Parker file:///D:/FL_ZEH_Proposal/NZEH_Data/Danny%20Parker%20Report%...<br />
Sky02 -- 04/24/08 15:04 -- Lower middle pv<br />
Panel Orientation: Tilt=30° -- Azimuth=180°<br />
Solar Access: Annual: 87% -- Summer (May-Oct): 86% -- W<strong>in</strong>ter (Nov-Apr): 90%<br />
4 <strong>of</strong> 6 1/28/2009 4:32 PM
Solar Access and Shade Report for Danny Parker file:///D:/FL_ZEH_Proposal/NZEH_Data/Danny%20Parker%20Report%...<br />
Sky03 -- 04/24/08 15:07 -- Lower nw pv corner<br />
Panel Orientation: Tilt=30° -- Azimuth=180°<br />
Solar Access: Annual: 86% -- Summer (May-Oct): 89% -- W<strong>in</strong>ter (Nov-Apr): 82%<br />
5 <strong>of</strong> 6 1/28/2009 4:32 PM
Solar Access and Shade Report for Danny Parker file:///D:/FL_ZEH_Proposal/NZEH_Data/Danny%20Parker%20Report%...<br />
Sky04 -- 04/24/08 15:33 -- Lower sw corner v2<br />
Panel Orientation: Tilt=30° -- Azimuth=180°<br />
Solar Access: Annual: 89% -- Summer (May-Oct): 85% -- W<strong>in</strong>ter (Nov-Apr): 93%<br />
6 <strong>of</strong> 6 1/28/2009 4:32 PM