Case Study of an Innovative HVAC System with Integral Dehumidifier
Case Study of an Innovative HVAC System with Integral Dehumidifier
Case Study of an Innovative HVAC System with Integral Dehumidifier

Create successful ePaper yourself
Turn your PDF publications into a flip-book with our unique Google optimized e-Paper software.
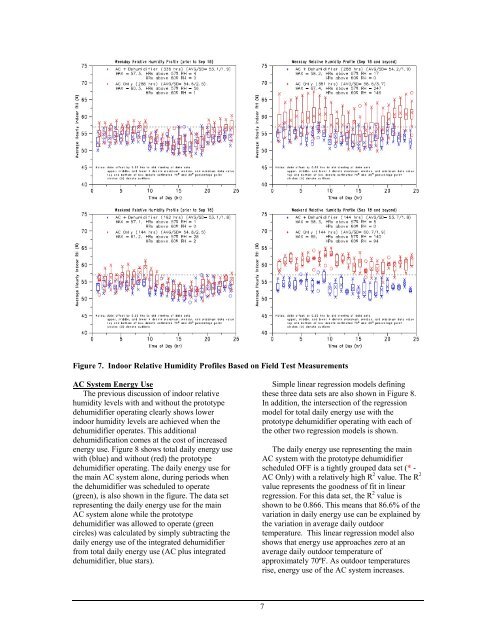
Figure 7. Indoor Relative Humidity Pr<strong>of</strong>iles Based on Field Test Measurements<br />
AC <strong>System</strong> Energy Use<br />
The previous discussion <strong>of</strong> indoor relative<br />
humidity levels <strong>with</strong> <strong>an</strong>d <strong>with</strong>out the prototype<br />
dehumidifier operating clearly shows lower<br />
indoor humidity levels are achieved when the<br />
dehumidifier operates. This additional<br />
dehumidification comes at the cost <strong>of</strong> increased<br />
energy use. Figure 8 shows total daily energy use<br />
<strong>with</strong> (blue) <strong>an</strong>d <strong>with</strong>out (red) the prototype<br />
dehumidifier operating. The daily energy use for<br />
the main AC system alone, during periods when<br />
the dehumidifier was scheduled to operate<br />
(green), is also shown in the figure. The data set<br />
representing the daily energy use for the main<br />
AC system alone while the prototype<br />
dehumidifier was allowed to operate (green<br />
circles) was calculated by simply subtracting the<br />
daily energy use <strong>of</strong> the integrated dehumidifier<br />
from total daily energy use (AC plus integrated<br />
dehumidifier, blue stars).<br />
Simple linear regression models defining<br />
these three data sets are also shown in Figure 8.<br />
In addition, the intersection <strong>of</strong> the regression<br />
model for total daily energy use <strong>with</strong> the<br />
prototype dehumidifier operating <strong>with</strong> each <strong>of</strong><br />
the other two regression models is shown.<br />
The daily energy use representing the main<br />
AC system <strong>with</strong> the prototype dehumidifier<br />
scheduled OFF is a tightly grouped data set (* -<br />
AC Only) <strong>with</strong> a relatively high R 2 value. The R 2<br />
value represents the goodness <strong>of</strong> fit in linear<br />
regression. For this data set, the R 2 value is<br />
shown to be 0.866. This me<strong>an</strong>s that 86.6% <strong>of</strong> the<br />
variation in daily energy use c<strong>an</strong> be explained by<br />
the variation in average daily outdoor<br />
temperature. This linear regression model also<br />
shows that energy use approaches zero at <strong>an</strong><br />
average daily outdoor temperature <strong>of</strong><br />
approximately 70ºF. As outdoor temperatures<br />
rise, energy use <strong>of</strong> the AC system increases.<br />
7