The Hengill Geothermal System, Conceptual Model and Thermal ...
The Hengill Geothermal System, Conceptual Model and Thermal ...
The Hengill Geothermal System, Conceptual Model and Thermal ...

You also want an ePaper? Increase the reach of your titles
YUMPU automatically turns print PDFs into web optimized ePapers that Google loves.
Franzson et al.<br />
fracturing related to the SISZ. This thermal mining appears<br />
to be most effective at a depth range of ca 1400-2000 m.<br />
4.5 Hverahlíð Field<br />
<strong>The</strong> three wells in Hverahlíð field in the southern part of<br />
<strong>Hengill</strong> also show contrasts in formation <strong>and</strong> alteration<br />
temperatures as shown in Figures 14-16. Well 21, which is<br />
located near to the only thermal manifestation, shows<br />
consistently higher formation temperatures than the<br />
alteration, while well 26 shows lower formation<br />
temperatures in the three depth levels. Well 36, on the other<br />
h<strong>and</strong>, shows equilibrium at the depth of the caprock, a<br />
slightly higher formation temperatures at 1000 m depth, but<br />
then a pronounced temperature reversal below 1500 m<br />
depth. It is tempting to suggest that the thermal mining at<br />
the base of the well is related to the most active part of the<br />
fissure swarm as shown in Figure 16, similar to what has<br />
been proposed for Nesjavellir. <strong>The</strong> higher formation<br />
temperatures in the upper part of the system compared to<br />
the alteration temperatures, however, raises hopes that a<br />
relatively recent heating episode has occurred in that area,<br />
unrelated to the aforementioned volcanic fissures. That<br />
upflow channel has not yet been identified.<br />
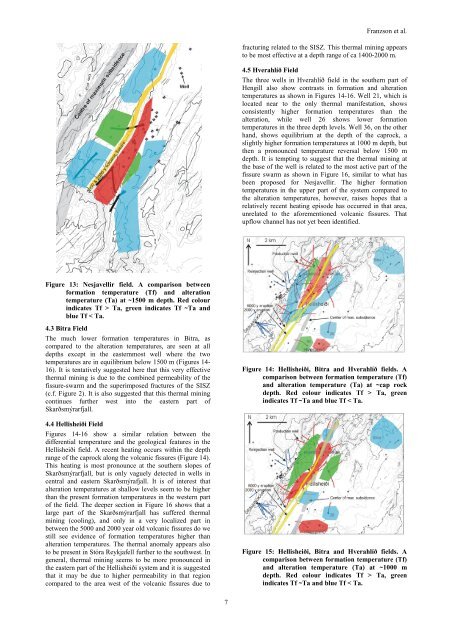
Figure 13: Nesjavellir field. A comparison between<br />
formation temperature (Tf) <strong>and</strong> alteration<br />
temperature (Ta) at ~1500 m depth. Red colour<br />
indicates Tf > Ta, green indicates Tf ~Ta <strong>and</strong><br />
blue Tf < Ta.<br />
4.3 Bitra Field<br />
<strong>The</strong> much lower formation temperatures in Bitra, as<br />
compared to the alteration temperatures, are seen at all<br />
depths except in the easternmost well where the two<br />
temperatures are in equilibrium below 1500 m (Figures 14-<br />
16). It is tentatively suggested here that this very effective<br />
thermal mining is due to the combined permeability of the<br />
fissure-swarm <strong>and</strong> the superimposed fractures of the SISZ<br />
(c.f. Figure 2). It is also suggested that this thermal mining<br />
continues further west into the eastern part of<br />
Skarðsmýrarfjall.<br />
4.4 Hellisheiði Field<br />
Figures 14-16 show a similar relation between the<br />
differential temperature <strong>and</strong> the geological features in the<br />
Hellisheiði field. A recent heating occurs within the depth<br />
range of the caprock along the volcanic fissures (Figure 14).<br />
This heating is most pronounce at the southern slopes of<br />
Skarðsmýrarfjall, but is only vaguely detected in wells in<br />
central <strong>and</strong> eastern Skarðsmýrafjall. It is of interest that<br />
alteration temperatures at shallow levels seem to be higher<br />
than the present formation temperatures in the western part<br />
of the field. <strong>The</strong> deeper section in Figure 16 shows that a<br />
large part of the Skarðsmýrarfjall has suffered thermal<br />
mining (cooling), <strong>and</strong> only in a very localized part in<br />
between the 5000 <strong>and</strong> 2000 year old volcanic fissures do we<br />
still see evidence of formation temperatures higher than<br />
alteration temperatures. <strong>The</strong> thermal anomaly appears also<br />
to be present in Stóra Reykjafell further to the southwest. In<br />
general, thermal mining seems to be more pronounced in<br />
the eastern part of the Hellisheiði system <strong>and</strong> it is suggested<br />
that it may be due to higher permeability in that region<br />
compared to the area west of the volcanic fissures due to<br />
Figure 14: Hellisheiði, Bitra <strong>and</strong> Hverahlíð fields. A<br />
comparison between formation temperature (Tf)<br />
<strong>and</strong> alteration temperature (Ta) at ~cap rock<br />
depth. Red colour indicates Tf > Ta, green<br />
indicates Tf ~Ta <strong>and</strong> blue Tf < Ta.<br />
Figure 15: Hellisheiði, Bitra <strong>and</strong> Hverahlíð fields. A<br />
comparison between formation temperature (Tf)<br />
<strong>and</strong> alteration temperature (Ta) at ~1000 m<br />
depth. Red colour indicates Tf > Ta, green<br />
indicates Tf ~Ta <strong>and</strong> blue Tf < Ta.<br />
7